We’ve designed the key in Figure 6.3.2–1 to be easy for students to use and understand, avoiding more complex jargon. If you are interested in knowing the meanings of the full set of colors on this map, you can consult its original source at https://doi.org/10.1038/sdata.2018.214, or this Wikipedia page that explains the Köppen climate classification system and shows the same map: https://en.wikipedia.org/wiki/Köppen_climate_classification
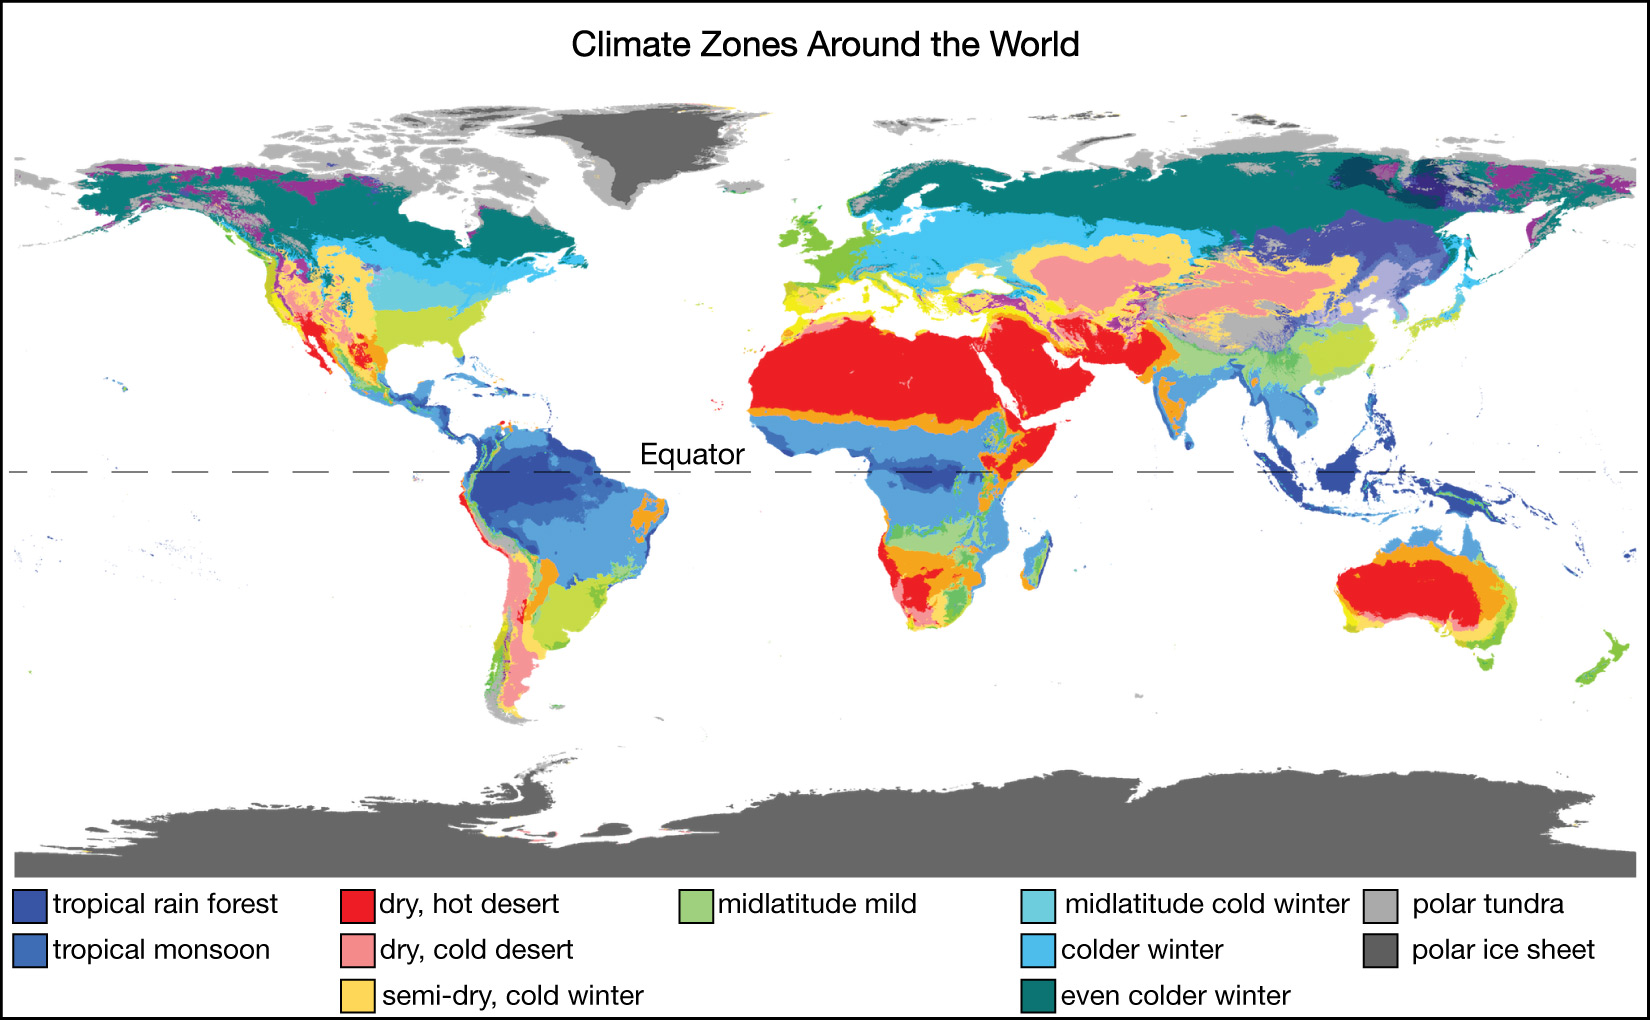
Spend a few minutes studying Figure 6.3.2–1, which shows major climate zones around the world . Although there is a lot of variation from place to place, you’ll also see some general patterns. For example, notice that wet, tropical regions are clustered near the equator, while dry, desert regions are found to the north and south of those wet regions.
As always in science, we take the existence of patterns like these as a hint that there must be underlying reasons behind them. In this section, we’ll explore these underlying reasons. We’ll organize our discussion by the three major climate factors that we discussed at the end of the last section: temperature, humidity and precipitation, and seasonal variation.
Temperature Zones
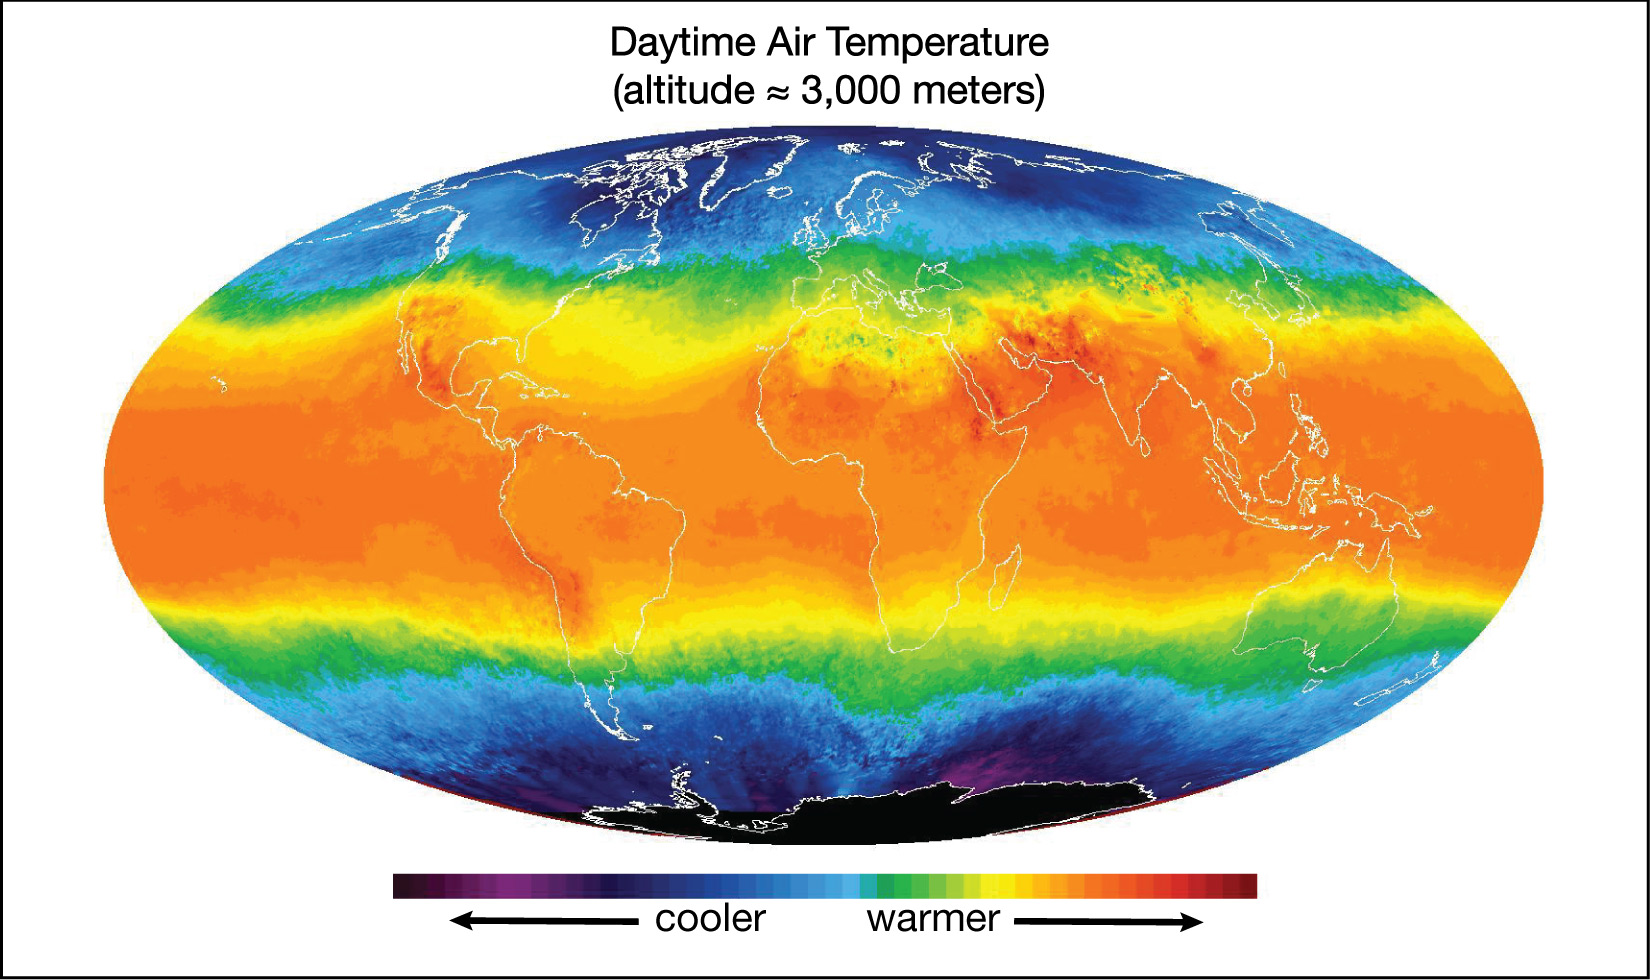
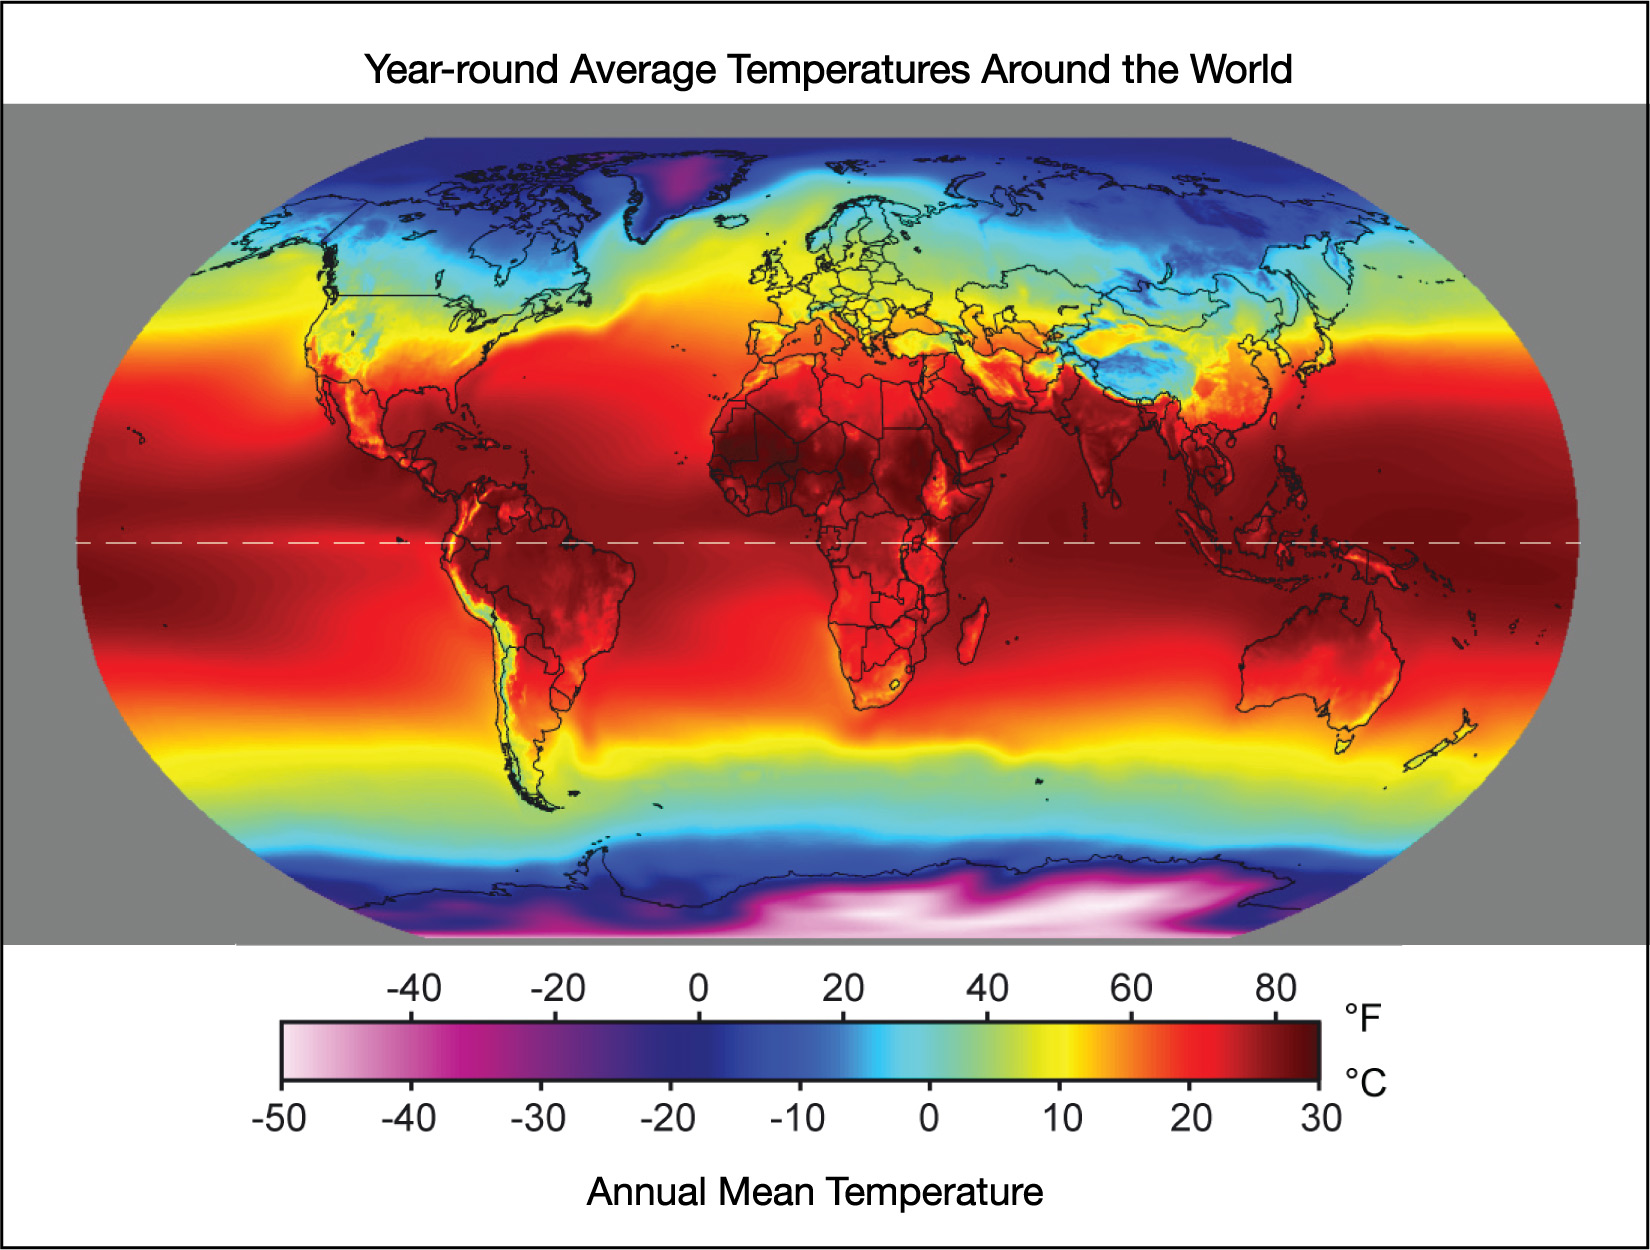
You already know that temperature varies with latitude because of differences in the angle of sunlight reaching the ground. Figure 6.3.2–2 shows year-round average temperatures around the world, counting both day and night. (You might want to compare this map to Figure 6.2.1–2, which showed temperatures in a particular month and higher in the atmosphere.)
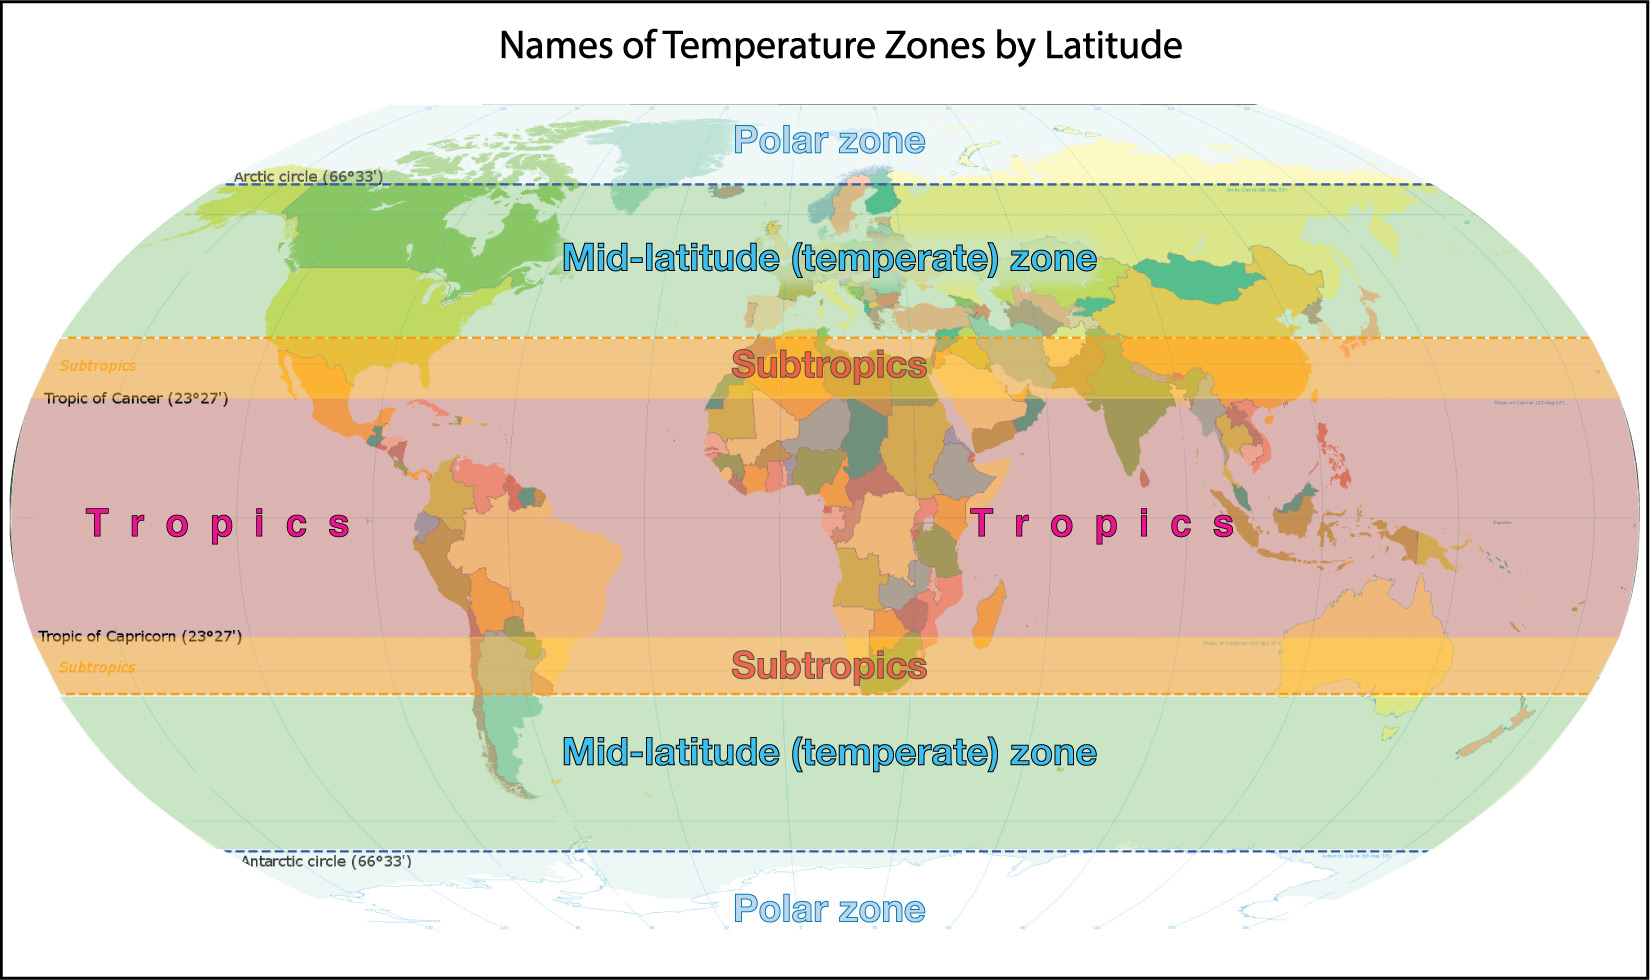
The fact that temperatures vary so strongly with latitude means it is useful to define different latitude zones around the world. Figure 6.3.2–3 shows the most common way of doing this:
- The tropics are the warm-weather latitudes that surround the equator, officially defined to represent latitudes between the Tropic of Capricorn (latitude 23½°S) and the Tropic of Cancer (latitude 23½°N). The tropics represent the latitudes at which Sun can sometimes pass directly overhead at noon . (Click here to review how the Tropics got their names.)
- The subtropics are regions that are within a few degrees of latitude of the tropics.
- Mid-latitudes (also called temperate zones) extend roughly from about latitude 30° to 60° in both hemispheres.
Note that the subtropics and mid-latitudes are more vaguely defined than the tropics. For example, latitudes near 30° might be considered both the “upper” subtropics and the “lower” mid-latitudes. - Polar zones are the Arctic and Antarctic regions. We usually think of them as anything north of about 60°N or south of about 60°S, but they are sometimes defined more precisely as the regions north of the Arctic Circle (latitude 66½°N) and south of the Antarctic Circle (latitude 66½°S).
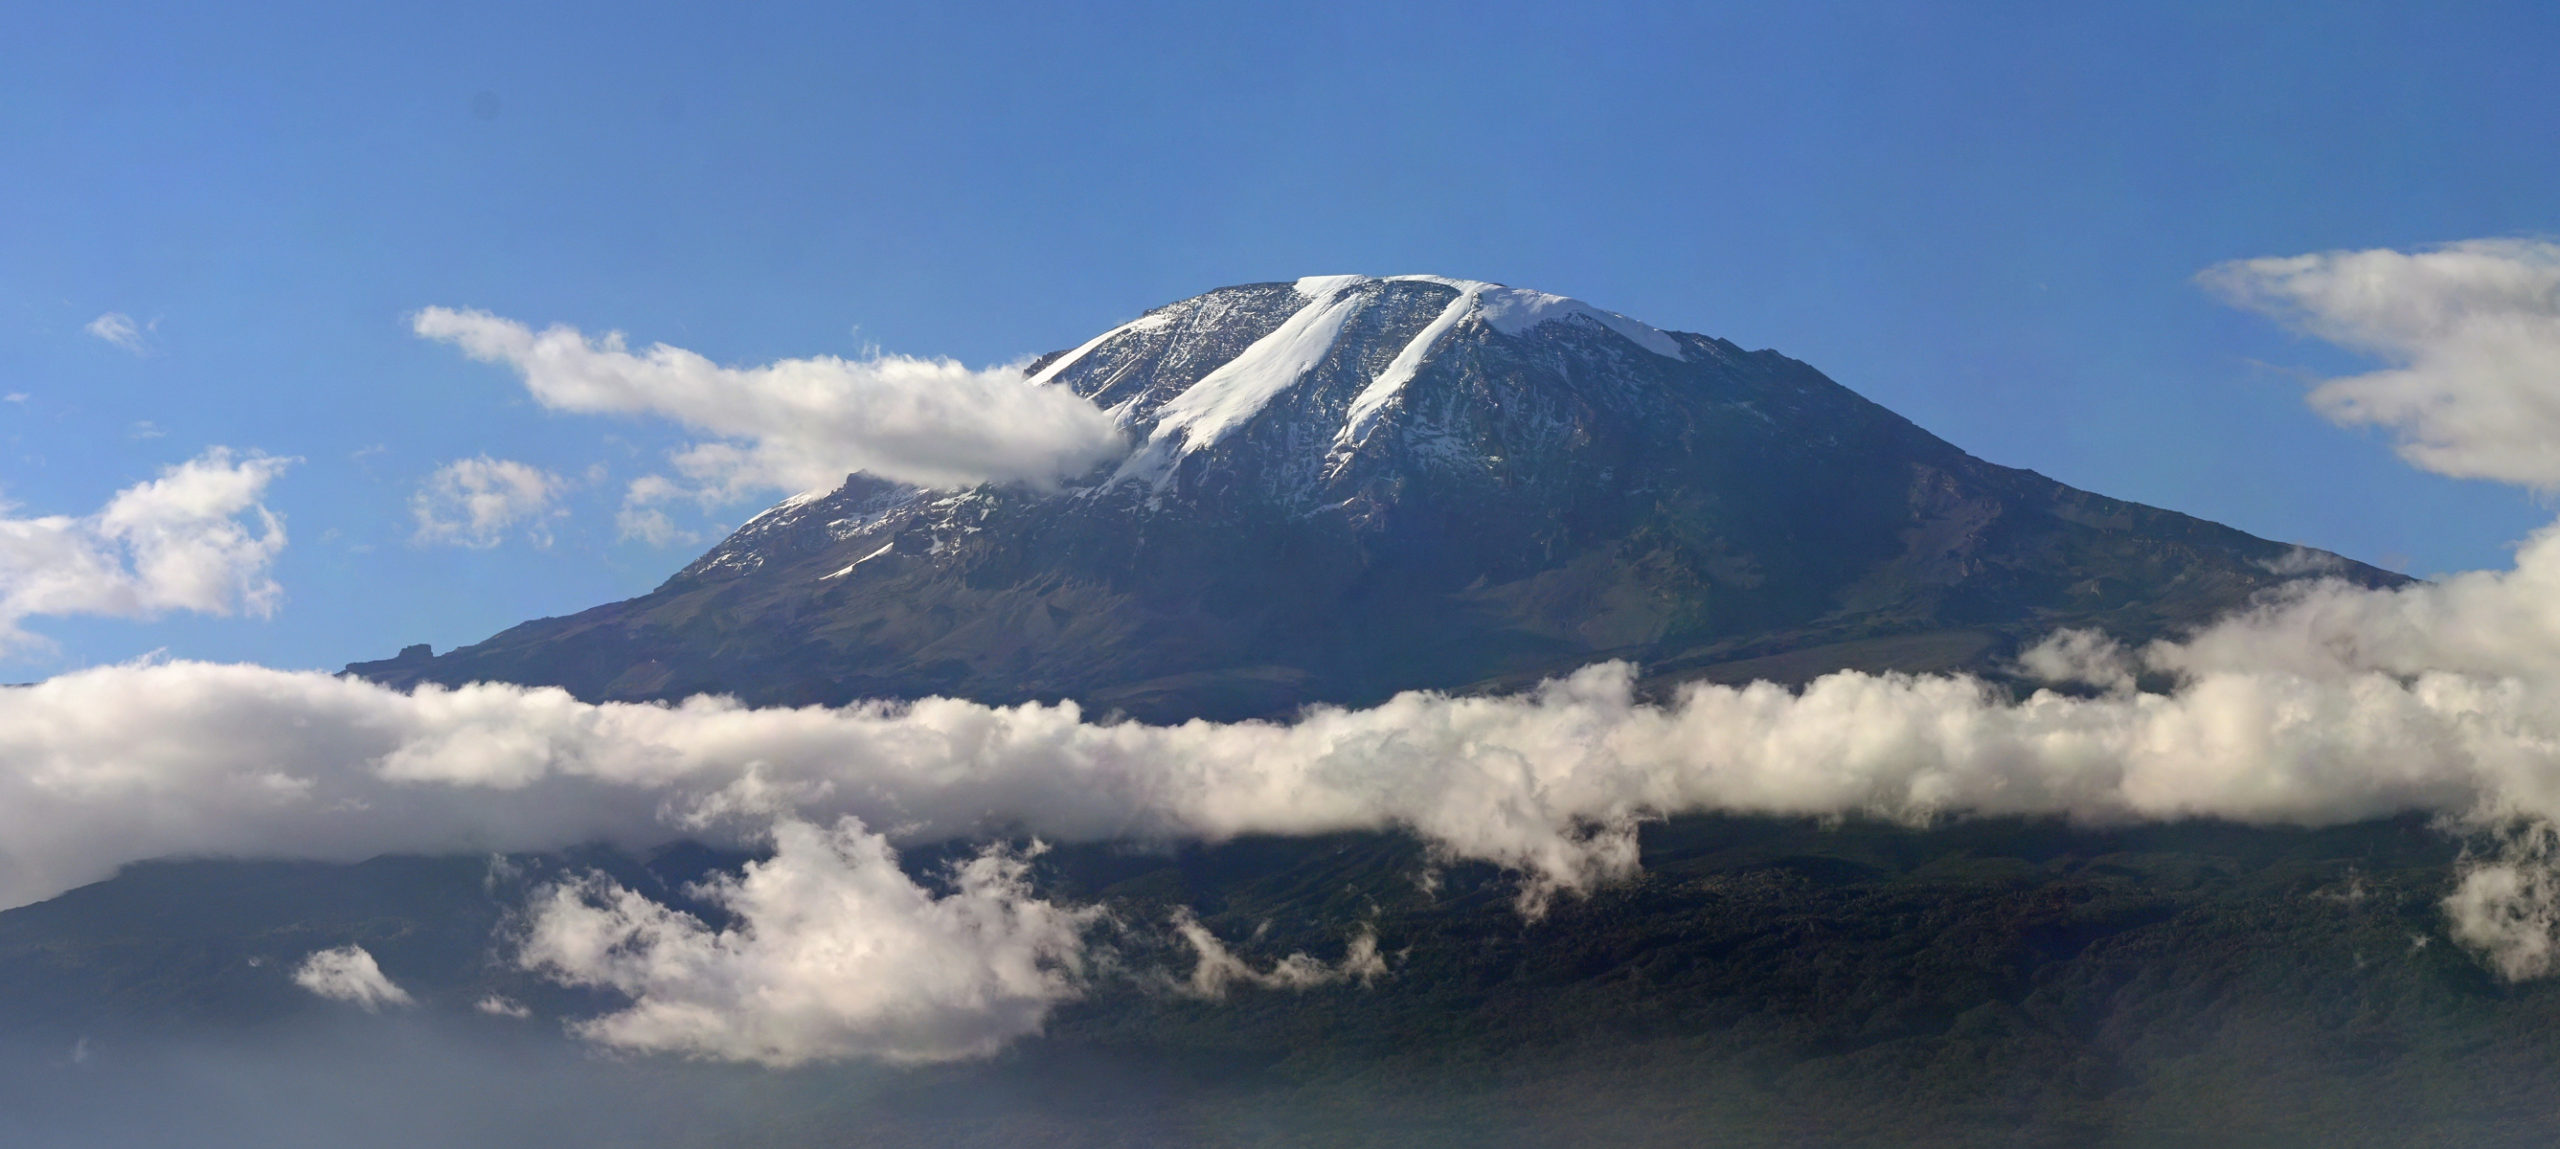
Keep in mind that these latitude-based temperature zones tell us only general trends in temperature. There are many localized variations as a result of factors like how close a region is to the ocean, global wind patterns, and altitude. For example, Africa’s Mount Kilimanjaro is located very close to the equator (latitude 3°S), which puts it near the center of the tropics. However, it is so tall (5,895 meters, or 19,341 feet) that its peak is capped by snow and glaciers .
Discussion
Temperature Zones
Briefly discuss the following questions by considering the four latitude-based temperatures zones: tropics, subtropics, mid-latitudes, polar.
- Which zone best represents your location? Note: in some cases, it may make sense to say you are near the border between two zones.
- Look back at the climate regions in Figure 6.3.2–1 and the average temperature map in Figure 6.3.2–2. Where are Earth’s hottest regions? Does this surprise you? Why or why not?
This very brief discussion is intended primarily to make sure students understand and recognize the different latitude-based zones.
- (1) Answers will vary with latitude.
- (2) The overall trend gets cooler with increasing latitude, but if students look carefully, they’ll notice that the very hottest regions are deserts that are generally in the subtropical regions. This may be somewhat surprising, since students might expect the hottest regions to be closer to the equator.
Precipitation Zones
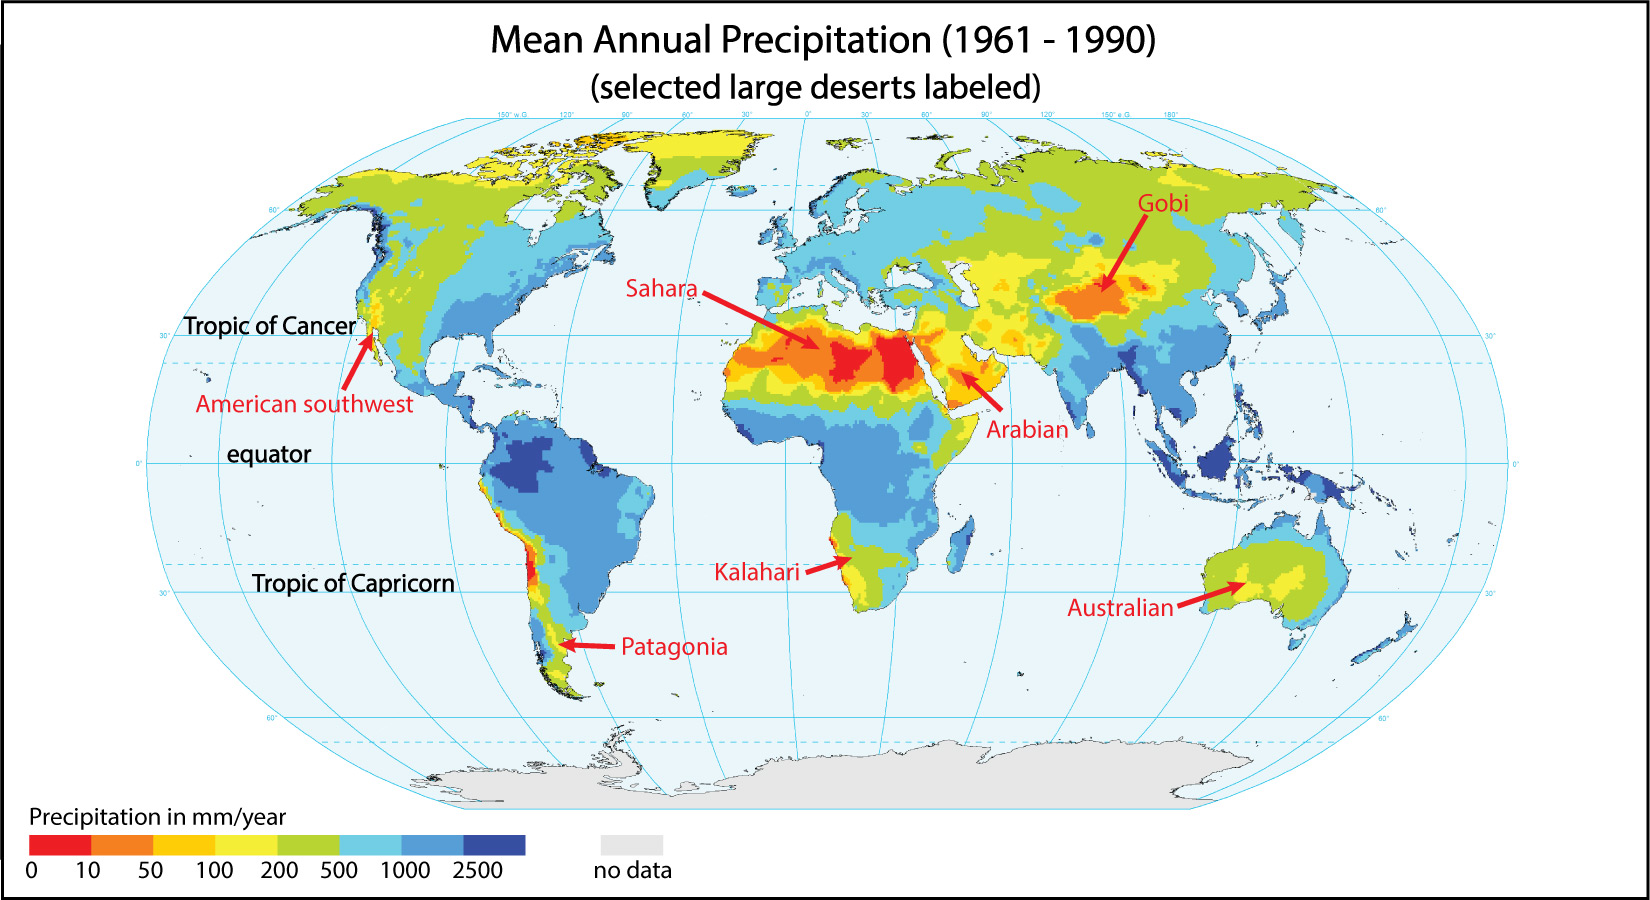
Let’s turn now to precipitation, which also varies greatly around the world. Some regions are so wet that we call them rain forests, while others are dry enough that we call them deserts. Figure 6.3.2–5 shows how average (or “mean”) annual precipitation varies around the world. Study the figure, then try the quiz that follows to make sure you’ve noticed key patterns.
Quiz – Patterns in Global Precipitation
Answer the following questions based on the global precipitation map in Figure 6.3.2–5.
Note: As always, after you finish the quiz, be sure you read the feedback that explains the correct answers, to make sure you understand the reasons for these answers.
As you’ve hopefully learned from the quiz, the most obvious pattern in global precipitation is this:
- Heavy rainfall is concentrated fairly close to the equator, within the tropics . That’s why we refer to the rain forests of these regions (such as the large rain forests in South America, Africa, and Southeast Asia) as tropical rain forests .
- On either side of this tropical band, concentrated in the subtropics , we find the major desert regions of Earth.
Why do the wettest and driest regions of Earth come clustered in these latitude bands? You already know enough figure out the answer. Use the following questions to make sure you can put the full picture together.
Discuss the following questions with a classmate. Then click to open the answers to see if they agree with what you came up with.
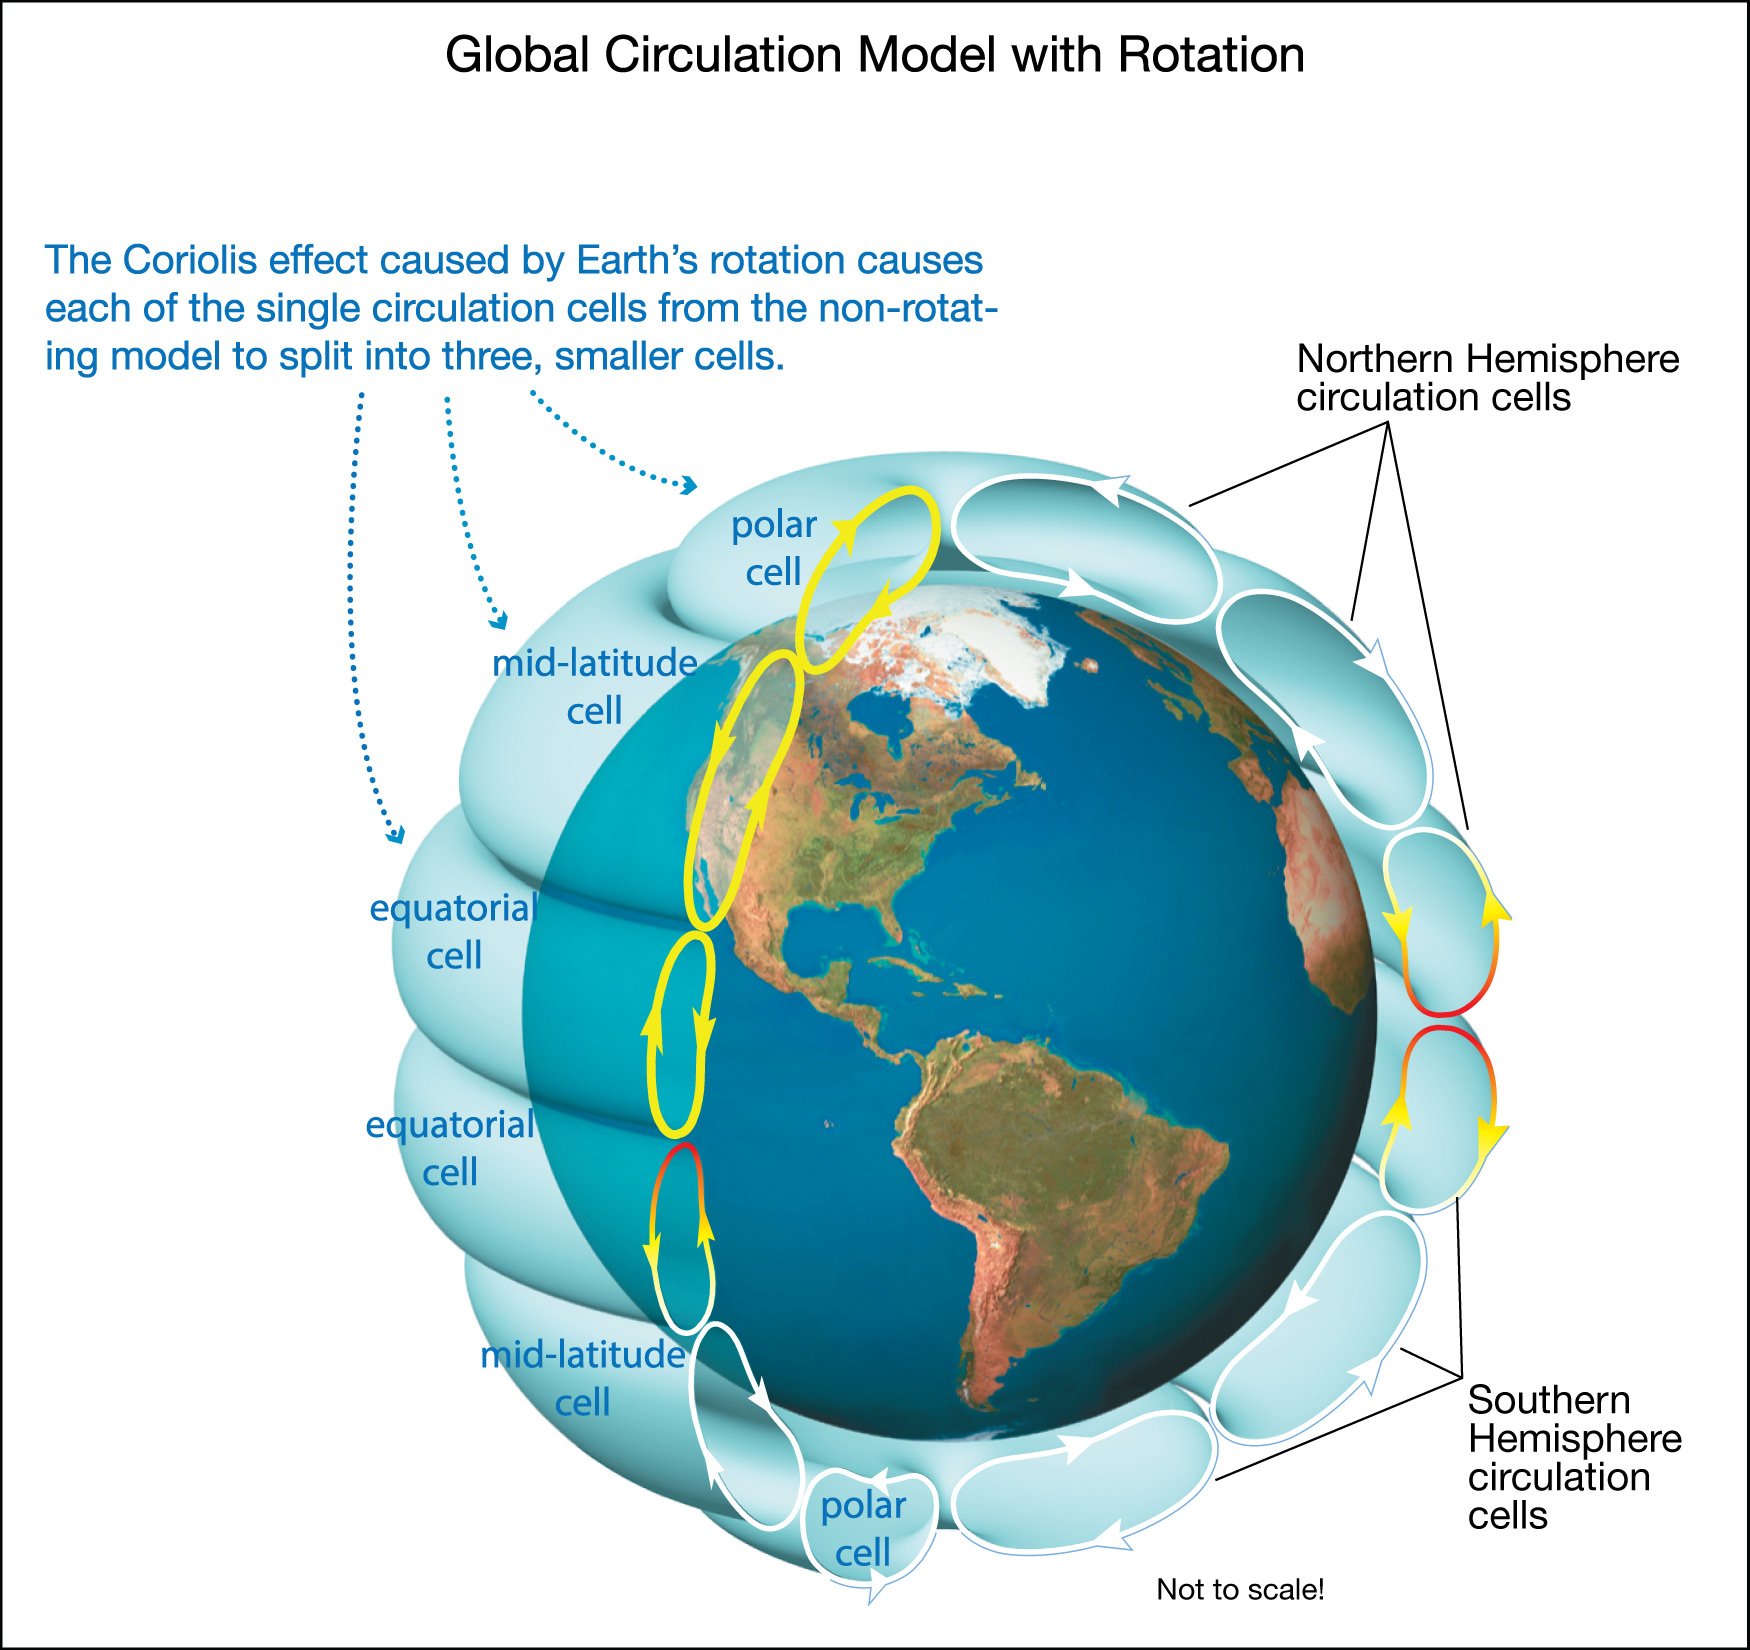
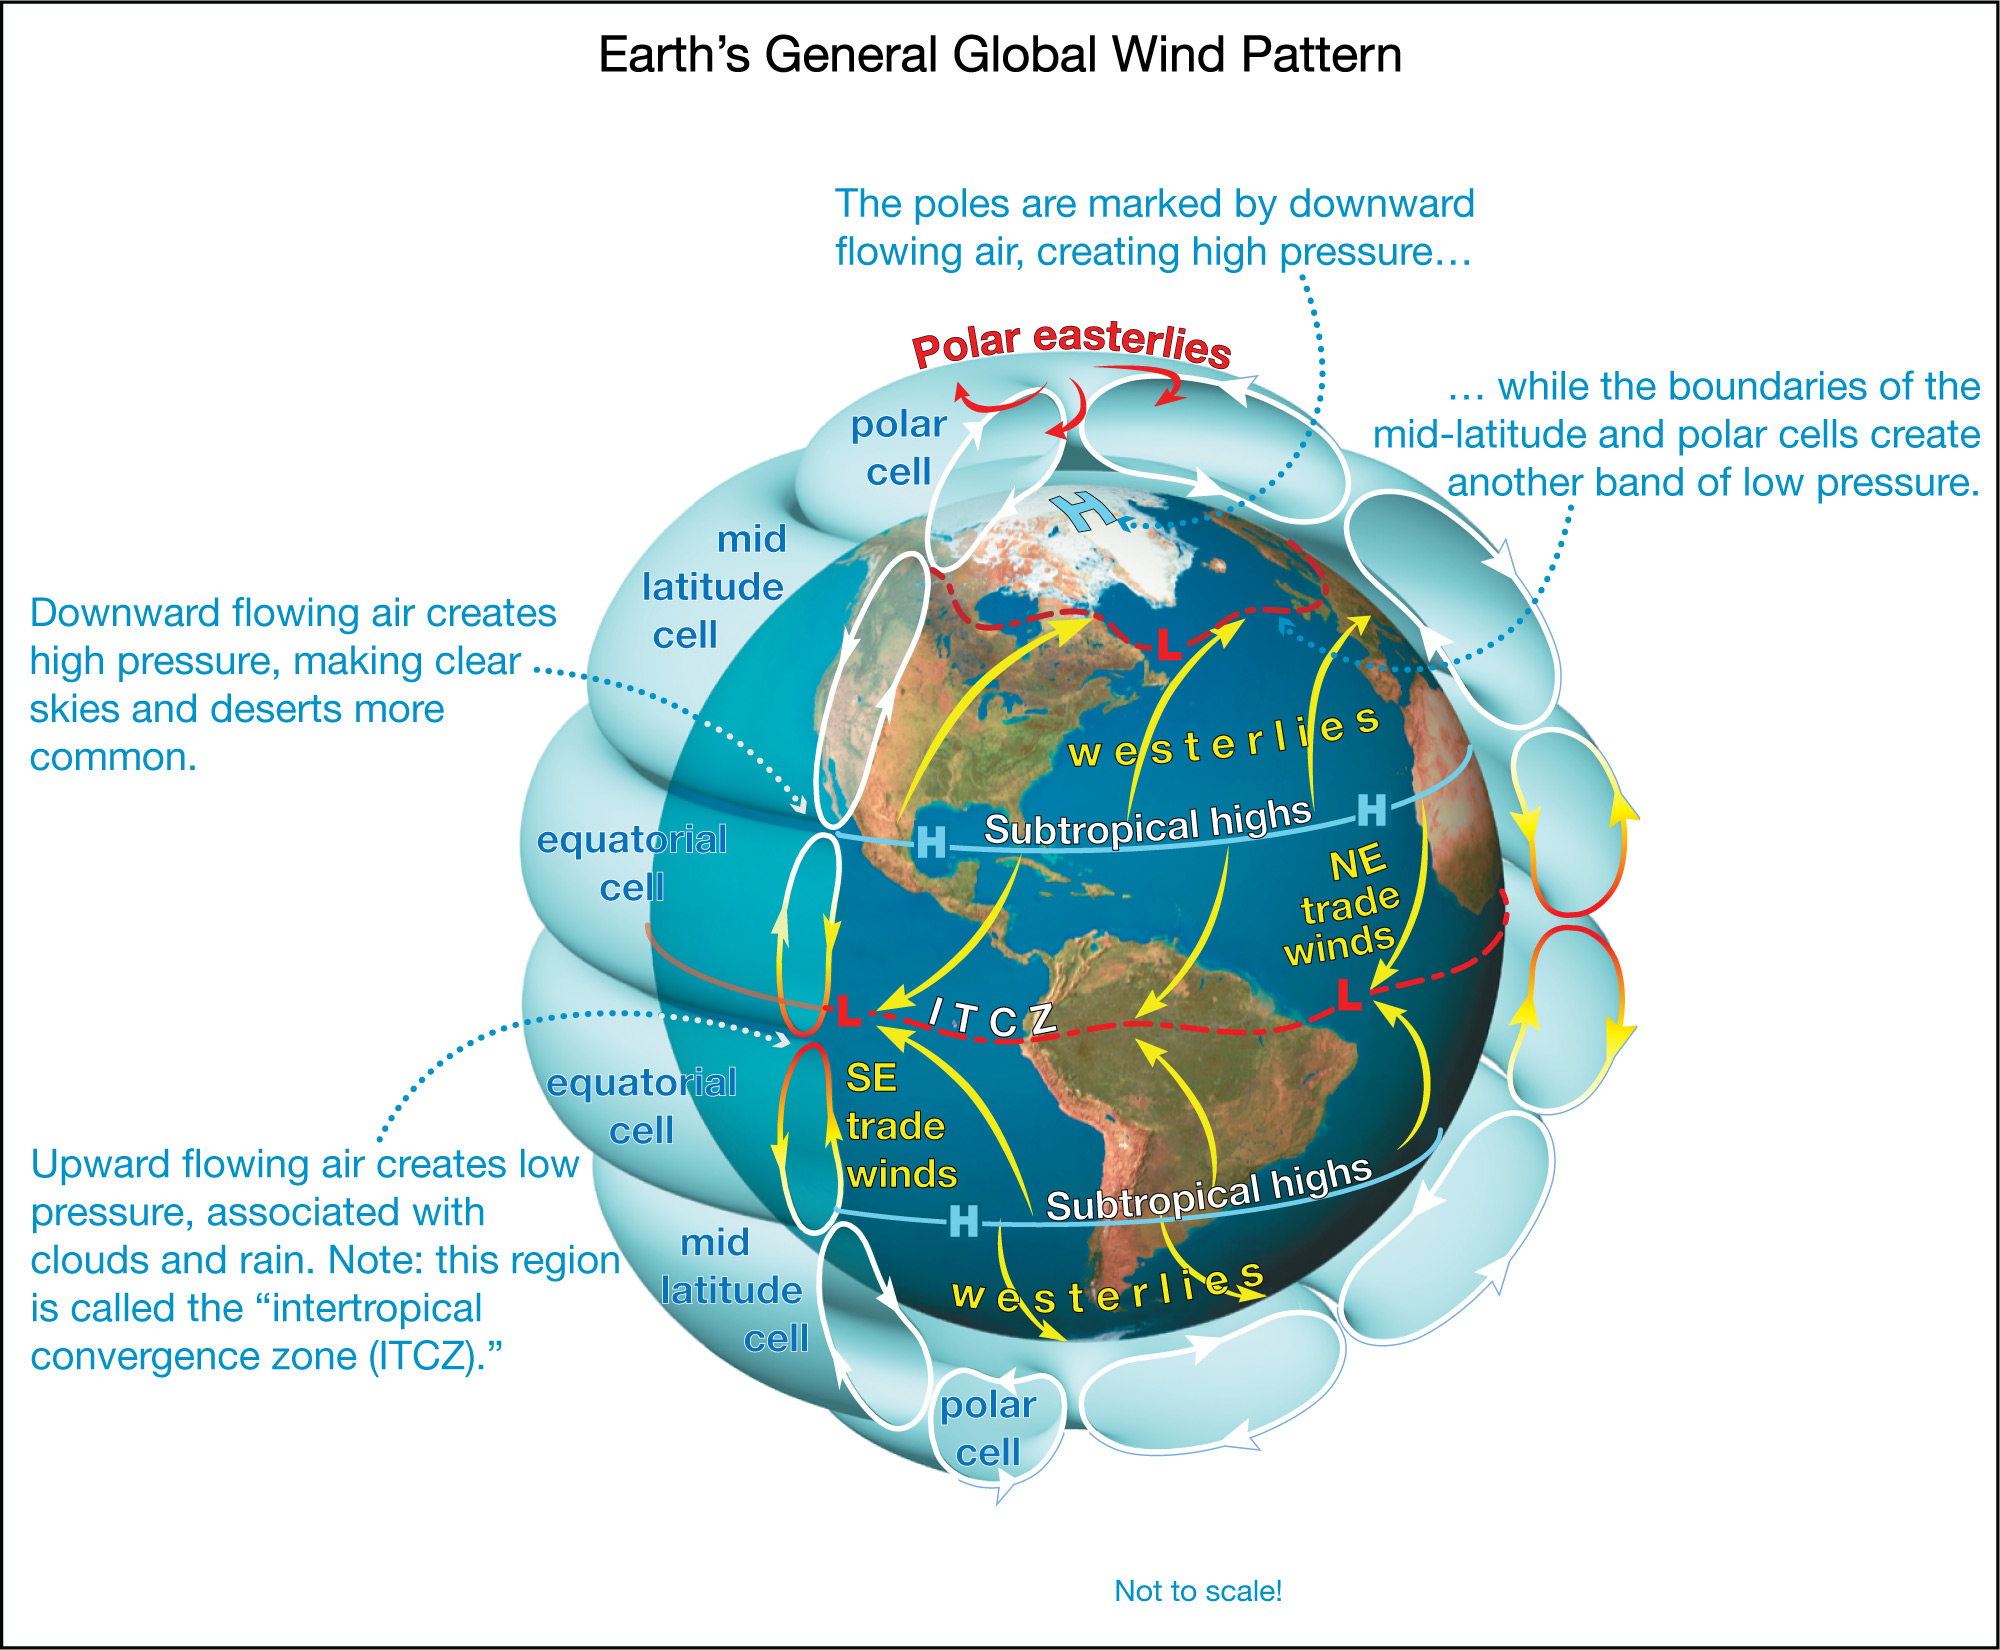
1. Review Figure 6.2.2–4, which shows the three-cell model for global circulation. If you concentrate on the cells closest to the equator, where is air generally rising upward? Where is air generally flowing downward?
As you follow the arrows in the circulation cells, you’ll see that:
- Air is generally flowing upward near the equator, where the two the equatorial cells meet.
- Air is generally flowing downward at the boundaries of the equatorial and mid-latitude cells.
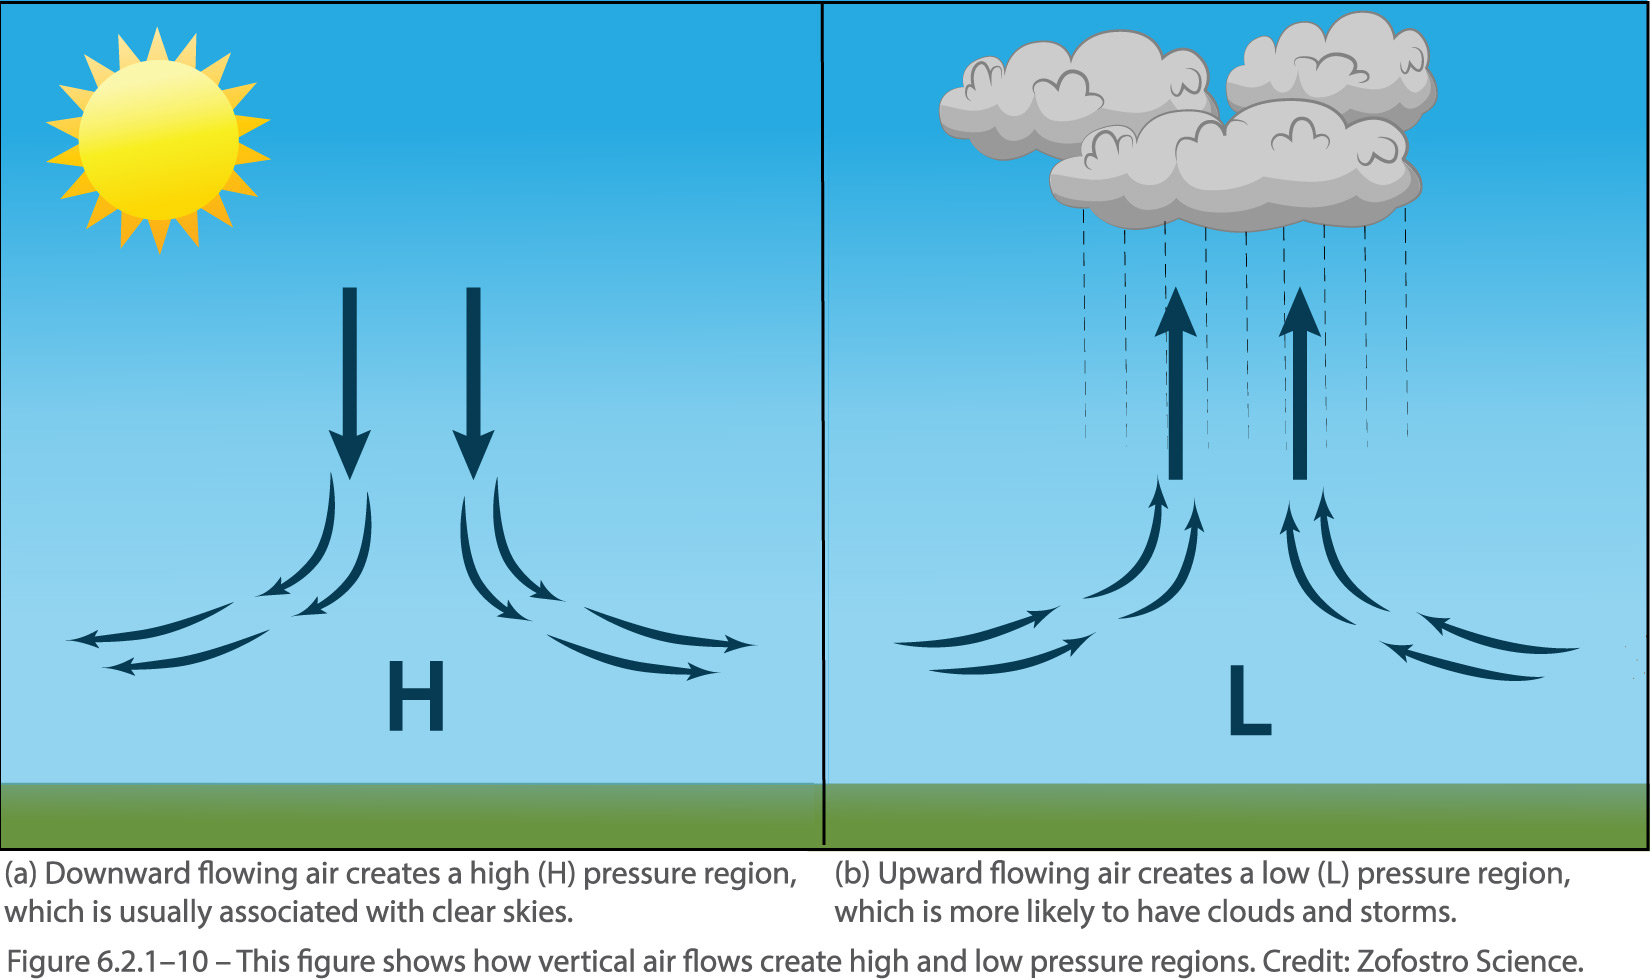
2. Now review Figure 6.2.1–10. What type of pressure (high or low) and weather is generally associated with upward air flows? What type of pressure is generally associated with downward air flows?
As you can see in Figure 6.2.1–10:
- Upward air flows (Figure 6.2.1–10b) lead to low pressure, which is more likely to mean cloudy skies and rain.
- Downward air flows (Figure 6.2.1–10ba) lead to high pressure, which is more likely to mean clear skies and dry weather.
3. Putting your answers from the first two questions together, explain why we should expect to find wet, rainy weather in regions near the equator.
The fact that air flows upward near the equator, where the two equatorial cells meet, means this region tends to have low pressure and therefore to be wet and rainy.
4. Further building on your prior answers, now explain why we should expect to find dry, desert regions in the subtropics.
The subtropics are where we find the downward air flows that occur at the boundaries of the equatorial and mid-latitude cells. These regions therefore tend to have high pressure and the clear, dry weather that marks a desert.
Figure 6.3.2–6 summarizes the picture you’ve put together from the questions above. Notice that the circulation cells create several bands of latitude that tend to have either low or high pressure. The low pressure bands, like the one near the equator, explain the locations of rain forests. The high pressure bands, like the ones in the subtropics, explain the locations of deserts.
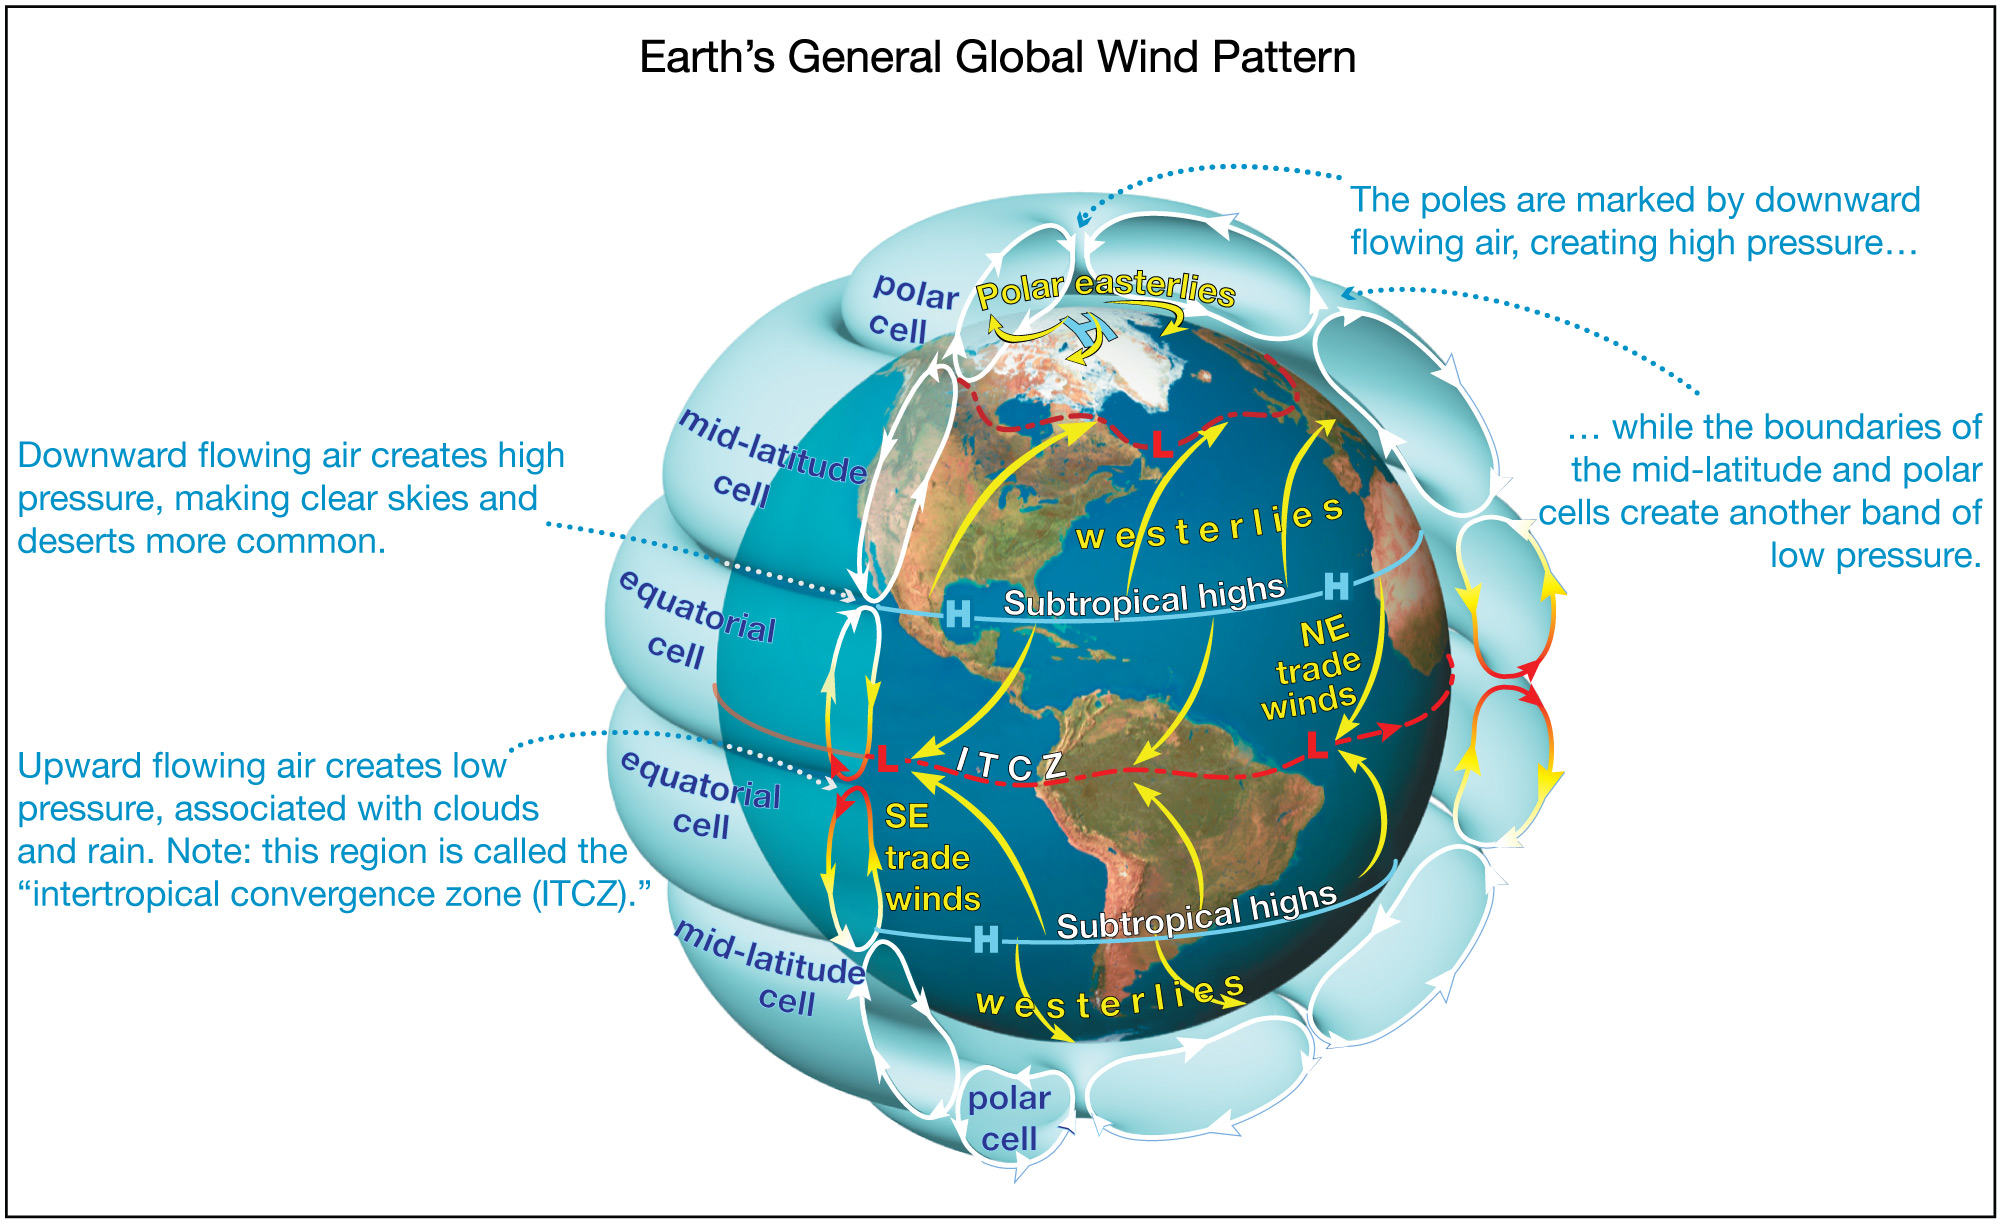
Figure 6.3.2–6 – This figure shows how the three-cell circulation model leads to bands of high and low pressure that encircle the Earth at particular latitudes. The equatorial low pressure, called the intertropical convergence zone (ITCZ ), explains why rain forests are common in the tropics. The subtropical highs explain the presence of deserts at these latitudes.Credit: Adapted from The Cosmic Perspective.
The high and low pressure bands not only have dramatic effects on regional climates, but you can actually see them from space. The most clearly visible is the low-pressure band created where the equatorial cells meet, which is called the intertropical convergence zone , commonly abbreviated as ITCZ. Because the ITCZ is band of low pressure, we expect it to be lined with clouds. Figure 6.3.2–7 shows that this is indeed the case.
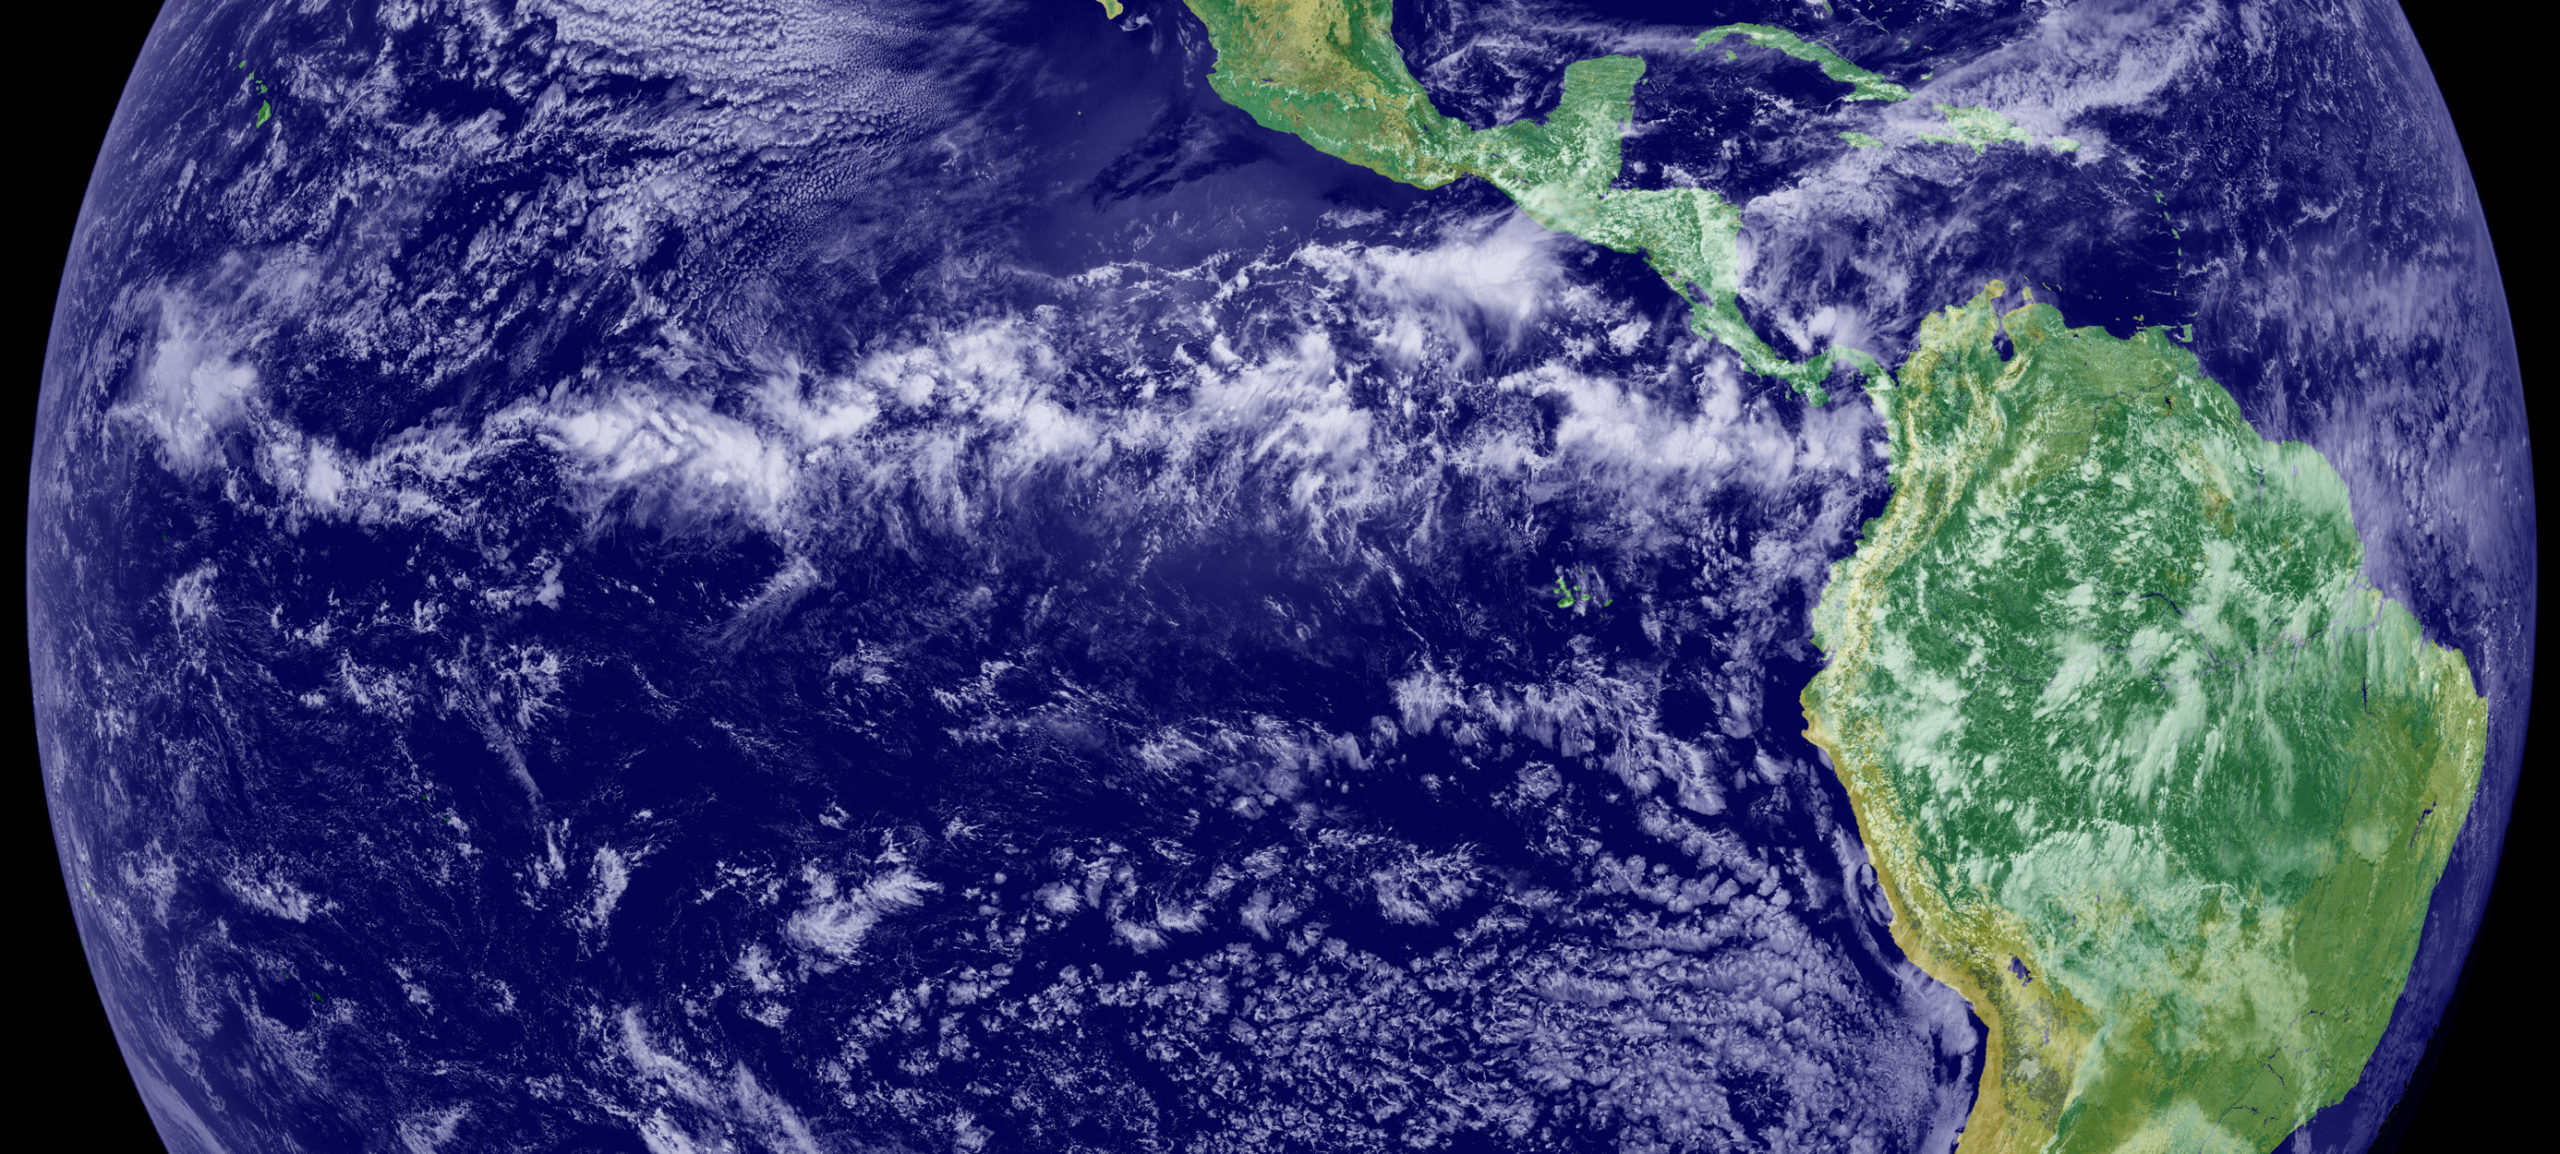
Figure 6.3.2–7 – The horizontal band of clouds in this photo traces out the location of the intertropical convergence zone (ITCZ) ,
a low-pressure band that encircles Earth near the equator. This band is created at the boundary of the north and south equatorial
circulation cells (as shown in Figure 6.3.2–6). It is marked by clouds because low pressure tends to mean cloudy skies.
Note: As discussed below, the precise location of the ITCZ shifts with the seasons. Here, it is slightly to the north of the equator,
which tells us that this photo was taken during northern hemisphere summer. Credit: NOAA.
Activity
Local and Global Precipitation
For this activity, go to this web site that allows you to explore an interactive globe showing average annual precipitation (screen shot below).
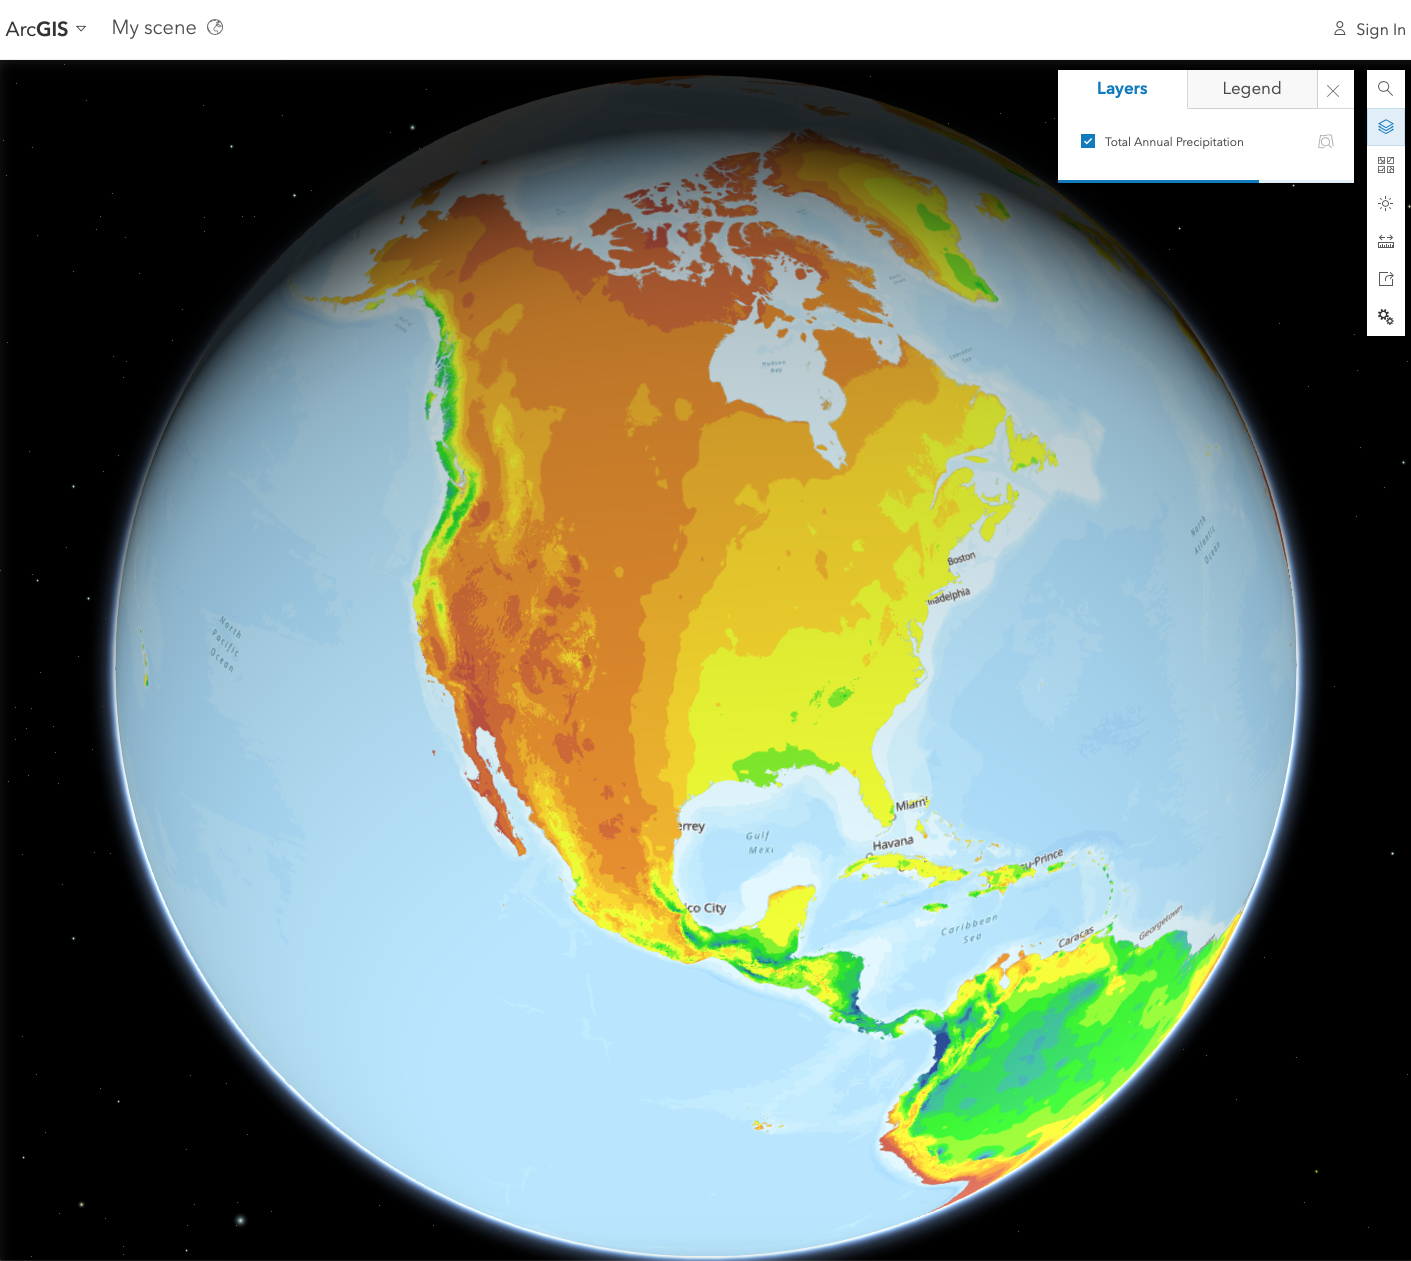
1. Once you are on the web site with the interactive globe, make sure you understand how to rotate the globe and how to zoom in and out. Notice that the colors used for precipitation on this globe are different from the ones used on the map in Figure 6.3.2–5. Click on the “legend” to see what the colors on this globe mean. How can you recognize rain forests and deserts on this globe?
2. As you study the interactive globe, can you use the color coding to identify the high and low pressure bands shown in Figure 6.3.2–6? Explain.
3. Notice that there are many exceptions to the general trends expected from the high and low pressure bands. Find your location on the interactive globe. Based on the color coding of your location, how much annual precipitation do you get? Does this agree with what you would expect based on your life experience? Would you say that your location fits the general trends of Figure 6.3.2–6, or is it an exception to those trends?
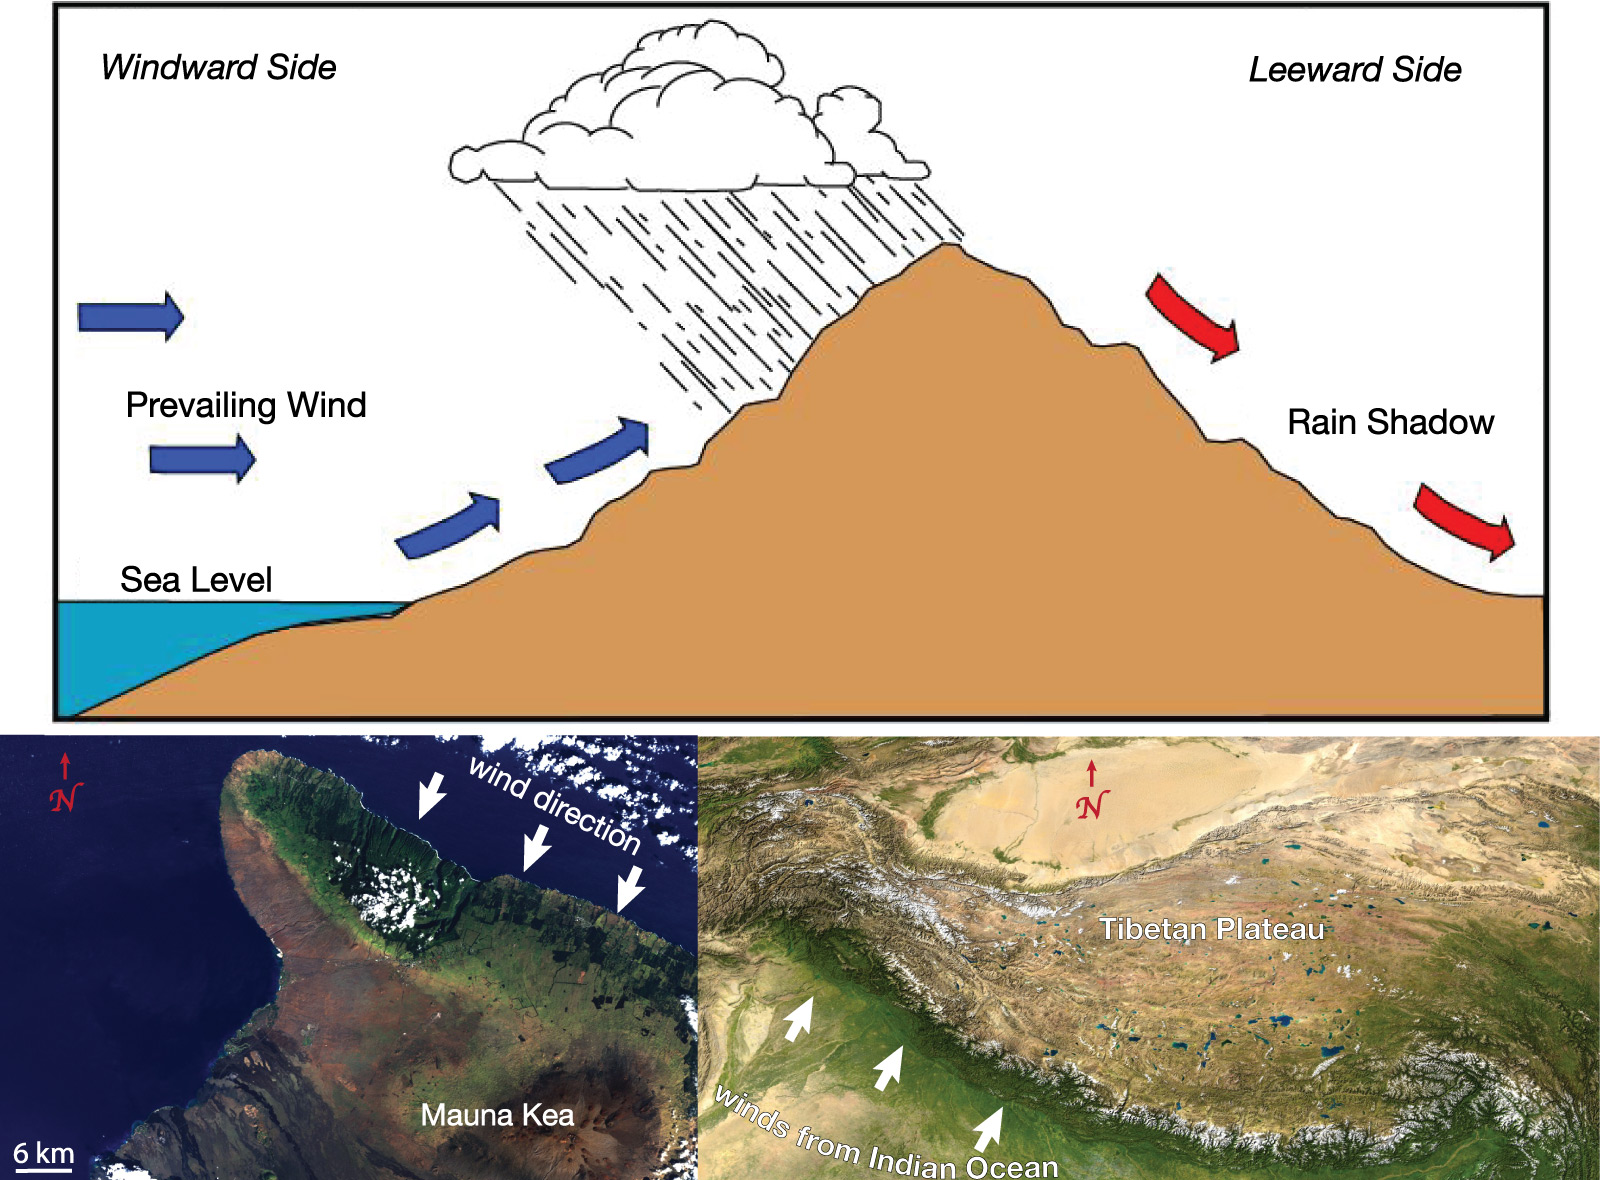
4. Some of the biggest exceptions to the general trends come in places where there is a strong rain shadow effect. Recall from Figure 6.2.1–12 that two places with particularly strong rain shadow effects are on the big island of Hawaii and in the Himalayas. Find each of these regions on the interactive globe, and explain how you can see the rain shadow effect.
5. Look around the globe and choose at least one other place where there is a precipitation pattern that surprises you based on general trends. Form a hypothesis about why this pattern exists in that location.
This activity should help reinforce both the general idea of high and low pressure bands on Earth and some earlier ideas (such as rain shadow) from this chapter. It should also be fun to explore the interactive map. We recommend having students do this activity in pairs, though it can also be done individually or in small groups. Or, you could do the activity with the entire class, projecting the interactive globe in the front of the classroom.
- (1) Be sure students find the legend and correctly identify the colors going with heavy rainfall (such as in rain forests) and dry, desert conditions.
- (2) Students may need help to see the general trends, because there are many localized exceptions to the trends. You can therefore use this question to reinforce how, in science, we try to separate signal from noise to see general patterns.
- (3) This question has students focus in on your local area, to see if your region fits the general trends or is an exception to them. Note: The question about whether the map coloring fits what students expect from life experience allows you to discuss the map resolution, which in some cases won’t be high enough to see how your particular local conditions may vary from the broader regional conditions around you.
- (4) As long as students find Hawaii and the Himalayas successfully, the differences in precipitation created by the rain shadow effect in these areas should be quite obvious.
- (5) This is a more open-ended question that allows you to engage students in trying to make sense of surprising patterns. Most of these will be attributable to geographical features, such as mountain ranges or etc. If you are unsure yourself about a particular regional pattern, you should be able to look up the climate of that region on Wikipedia or other sources, and thereby find an explanation for the pattern.
Seasonal Shifts
Our third major climate factor is seasonal shifts. Look again at Figure 6.3.2–1, and notice that some climates are identified as having stronger shifts with seasons than others. For example, the color key shows that some colors represent regions with cold winters, indicating that they have a strong seasonal shift between summer and winter. Also notice the blue color that represents a “tropical monsoon.” This climate type also has a strong seasonal shift, because a monsoon is a type of seasonal wind pattern that tends to lead to distinct wet and dry seasons.
You know that seasons are caused by the tilt of Earth’s axis, and that the angle of sunlight at different times of year is determined by latitude. Why then, would some places have stronger seasonal shifts in weather than other places at the same or similar latitudes? The full explanation is complex, but let’s look at two major global effects that are relatively easy to understand.
Seasonal Shifts in Circulation Cells
In Figure 6.3.2–6 (and similar earlier figures), the two equatorial circulation cells are shown meeting at Earth’s equator. In reality, the place where these cells meet shifts with the seasons. It’s easy to understand why. Use the following questions to make sure the reason is clear to you.
Discuss the following questions with a classmate. Then click to open the answers to see if they agree with what you came up with.
1. Think back to why circulation cells exist on Earth in the first place. Why do two circulation cells with rising air meet near the equator? Hint: You may wish to review Figure 6.2.1–2 and this associated discussion.
These cells meet near the equator because that is where Earth gets the most solar heating. The circulation cells carry this warm air toward the poles, so there must be one cell to carry the air north and one to carry it south.
2. Does the greatest solar heating always occur right at the equator, or does it shift with the seasons? Explain.
It shifts with the seasons, because the latitude at which the Sun is highest overhead shifts as Earth orbits the Sun. Recall that on the June solstice, the Sun is highest in the sky over the Tropic of Cancer (latitude 23½°N). The place where the Sun is highest then gradually moves southward to the equator by the September equinox, to the Tropic of Capricorn (latitude 23½°S) by the December solstice, and then back to the equator by the March equinox. You can review these ideas by looking back at Figure 2.18.
3. Combining your answers to the first two questions, how would you expect the equatorial circulation cells to shift with the seasons?
The boundary of the two cells will follow the seasonal pattern. They will meet near the Tropic of Cancer (latitude 23½°N) in June, then the boundary will gradually migrate to the Tropic of Capricorn (latitude 23½°S) in December, and then the boundary will head back northward.
Video 6.3.2–8 shows how the seasonal shifts in solar heating correspond to seasonal shifts in temperature. As you found in answering the questions above, the circulation cells must also move alternately northward and southward with these seasonal shifts.
Video 6.3.2–8 - This video shows how the locations of the warmest air temperatures shift northward and southward with the seasons. The boundary where the equatorial circulation cells meet follows this same seasonal pattern. Credit: NOAA.
The northward and southward seasonal shifts in the locations of the circulation cells mean that their boundary, which creates the low-pressure intertropical convergence zone (ITCZ) , also shifts in the same way. Figure 6.3.2–9 shows typical January and July locations for the ITCZ. Notice that the shift is not exactly the same everywhere around the world. The reason is that although solar heating depends only on latitude, the circulation cells and the ITCZ are also influenced by geography, such as the locations of continents and oceans and the distribution of mountain ranges.
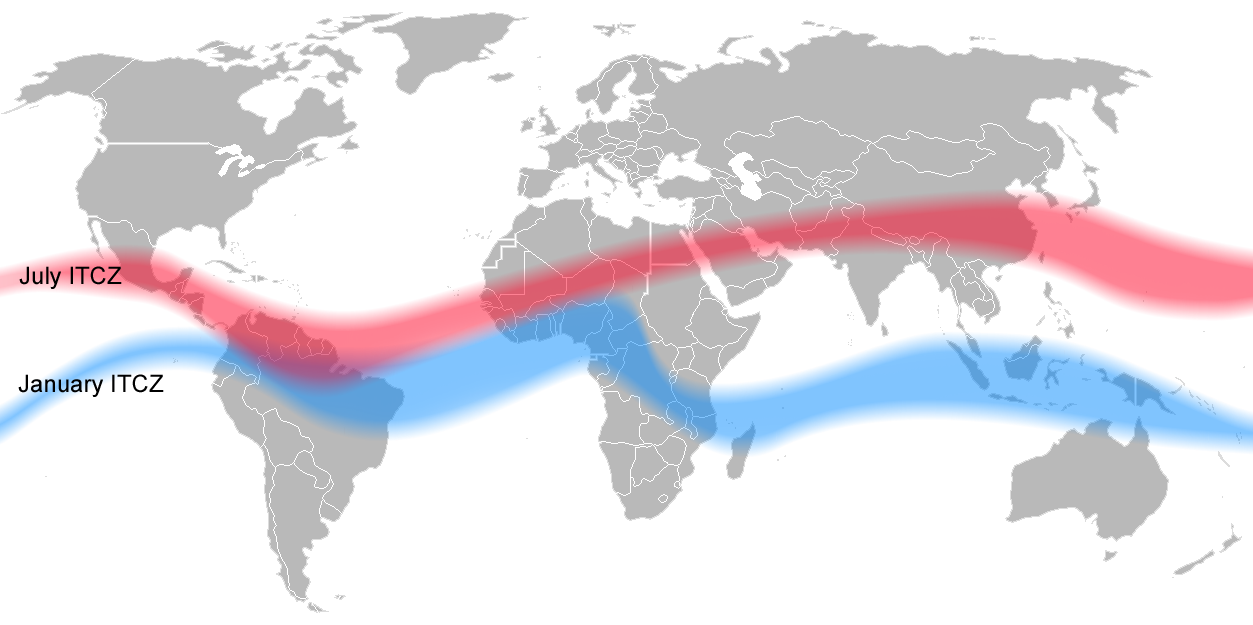
Figure 6.3.2–9 – This map shows how the location of the low-pressure intertropical convergence zone (ITCZ) shifts at
different times of year. Credit: Mats Halldin.
The seasonal shifts in the circulation zones and the ITCZ are one part of explaining whether a particular region has strong seasonal changes in weather. Notice, for example, that the January and July positions of the ITCZ are fairly close together in northern South America, which explains why this region has a fairly steady climate all year round. In contrast, the ITCZ shifts a lot with the seasons near southeast Asia, leading to much greater seasonal differences in climate. Similar effects occur with the shifts of other circulation cells (the mid-latitude and polar cells), explaining some of the seasonal differences we see at higher latitudes.
The Monsoon
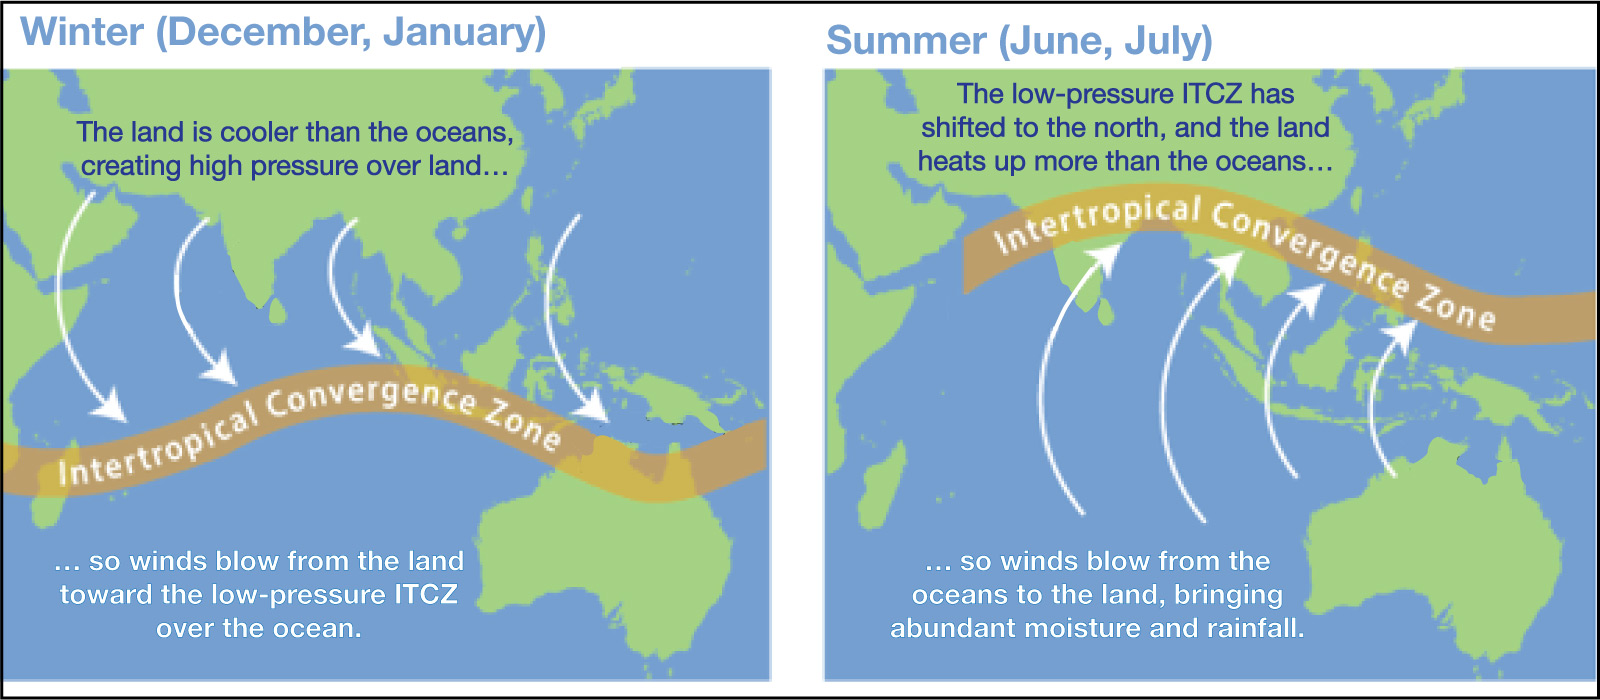
The seasonal shifts in the circulation cells have many consequences for weather and climate. One of the most important is the pattern that we call the monsoon . The word “monsoon” is sometimes used in other ways, but we’ll focus on its technical definition as a seasonally reversing wind. In brief, the monsoon pattern arises from the fact that land can warm or cool faster than the oceans (remember that the oceans have a moderating influence on climate) as follows:
- In summer months, the land warms more than the oceans, creating lower pressure over the land. Therefore, the wind blows from the oceans to the land, bringing moisture from the oceans that can create heavy rain.
- In winter months, the oceans remain warmer than the land, creating higher pressure over the land. Therefore, the wind blows from the land toward the oceans, leading to a dry season over the land.
Monsoons occur in many places around the world, but one of the strongest monsoon patterns occurs in southeast Asia, where it affects the lives of billions of people. Figure 6.3.2–10 shows the general monsoon pattern in this region for winter (left) and summer (right), and Video 6.3.2–11 uses satellite data to explain the pattern in a little more detail.
Video 6.3.2–11 - This NASA video uses satellite data to show the general monsoon pattern. Credit: NASA.
Discussion
The Asian Monsoon
Briefly discuss the following questions based on Figure 6.3.2–10 and Video 6.3.2–11.
1. Remember the general rule that winds blow from high pressure regions toward low pressure regions (see this discussion in section 6.2.1). Briefly explain how this rule comes into play in the way the monsoon winds change with the seasons.
2. Also remember the fact that the land can heat up and cool down much more quickly than the oceans (review this discussion). Explain how this helps to create higher pressure over land in winter and lower pressure in summer.
3. Briefly discuss how the video shows the seasonal differences created by the monsoon, both in terms of winds and clouds and in terms of rainfall.
4. Look back at Figure 6.3.2–1. Based on what you’ve learned, explain why many regions of southeast Asia have a “tropical monsoon” climate.
5. Notice in Figure 6.3.2–1 that there is a desert climate just to the north of some of these “tropical monsoon” climates in southeast Asia. What geographical feature explains the sharp distinction between these wet and dry regions? Hint: Think about what we’ve discussed earlier concerning the rain shadow effect.
6. Briefly discuss any dangers that you think might be associated with the seasonal monsoon pattern in southeast Asia.
This discussion is intended to make sure students understand the basic science behind the monsoon pattern. You may wish to do this one as a class, since some of the ideas are a bit subtle.
- (1) As explained by the annotations in Figure 6.3.2-10, the higher pressure is over the land in winter and over the oceans in summer, and in both cases the winds flow from the higher pressure region toward the lower pressure region.
- (2) Here, students need to think about (i) the moderating effects of oceans on temperature; (ii) the fact that warmer air rises upward while cooler air sinks downward; and (iii) the fact that rising air means low pressure and falling air means high pressure. Therefore: In winter, the fact that the land cools more means we get cooler, sinking air and high pressure over land, while we get warmer, rising, low pressure air over the oceans. As already found in question 1, this means the wind blows from the higher pressure over land toward the lower pressure over the oceans. In summer, the situation is reversed. The land heats up more than the oceans, so there is lower pressure over the land, which means the wind blows in from the oceans.
- (3) Be sure students understand what they saw in the video. The wind and cloud patterns are illustrated toward the beginning, and the rainfall is shown with color coding from satellite data when the second speaker begins.
- (4) This question just makes sure students understand the terms we’ve been using. The regions are “tropical” because they are in the tropics, and they are strongly affected by the Asian monsoon.
- (5) The Himalayas explain this sharp distinction. Their tall heights create a very strong rain shadow effect. So the rains all fall on the southern side, leaving the northern side a dry desert.
- (6) This question is more open-ended, but the biggest dangers are those of the flooding and mudslides that often occur during the wet season in this region of the world. You might connect this question with news reports of any such events that have occurred during the past year.
Note: You might also wish to connect these ideas to climate change, even though that topic comes in the next chapter. For example, climate change is expect to strengthen the monsoon pattern (larger summer/winter differences), thereby making wet season flooding more common and/or more severe.
Optional Video
The Himalayas and the Asian Monsoon
If you have time and access to the series, watch the “Everest” episode of the series “How the Earth was Made,” available here on Amazon. After watching the video, hold a brief class discussion about how geology affects climate over long periods of time, using the Asian monsoon as an example. Also discuss how such geological changes may have contributed to the rise of humanity, and the warnings they may pose concerning the changes we ourselves may be causing through our own activities.
This video, from the same series we used for optional videos in Chapter 5, does an excellent job of connecting geography and climate in the context of the Asian monsoon. It will also help review geology concepts from the prior chapter, and its discussion of long-term climate change will help set the stage for discussions of global warming in the next chapter.
Summary and Additional Climate Factors
We can briefly summarize the climate factors that we’ve discussed so far as follows:
- Temperature (see Figure 6.3.2–2): Temperatures are generally warm in the tropics and become cooler as we move toward the poles.
Reason: Sunlight is stronger in the tropics and weaker near the poles.
- Humidity and precipitation (see Figure 6.3.2–5): The tropics are generally wet, while the subtropics are much drier, with similar patterns repeating at higher latitudes.
Reason: As shown in Figure 6.3.2–6, Earth’s global circulation creates a low-pressure band near the equator, which promotes rainfall, and a high-pressure band near the subtropics, which leads to drier conditions. There are also similar lows and highs at higher latitudes.
- Seasonal variation (see Video 6.3.2–8 and Figure 6.3.2–9): The precise location of both the highest temperatures and highest precipitation shift alternately northward and southward with the seasons, which can lead to additional changes such as the seasonal monsoon (see Figure 6.3.2–10).
Reason: Temperatures shift because of seasonal changes in the angle of the Sun at different latitudes. Precipitation shifts because the temperature changes lead to a corresponding change in the latitude at which the equatorial circulation cells meet to create the intertropical convergence zone (ITCZ) .
If you now look again at Figure 6.3.2–1, repeated below, you’ll see how these patterns explain many of the climate zones. However, there are still plenty of exceptions to the general trends. These arise from other factors, including the way oceans can moderate climate, the way mountains can create a rain shadow effect, and the fact that higher altitudes tend to be colder. Moreover, all of these factors interact with each other, making the complete climate system extremely complex. Nevertheless, by using basic principles like those we have discussed (and many more), scientists can now create computer models that can successfully explain most aspects of Earth’s climate. We’ll discuss these models in Section 7.2.2, where we will see how scientists are using them to help us understand and predict the future effects we can expect from global warming.
Key Concepts: Modeling Earth’s Climate System
Earth’s complete climate system is very complex. However, this complexity arises from the interactions of simple principles that arise from basic physical laws. Scientists can use computer models to see how all of these principles and details of Earth’s geography interact with each other. Today, these models allow scientists to successfully explain all the major aspects of Earth’s climate system.
Discussion
Global and Local Climate
Work in small groups or as a class to discuss the following questions.
- Briefly explain how you can see each of the three major climate factors summarized above (temperature, humidity/precipitation, and seasonal shifts) in the climate map of Figure 6.3.2–1.
- Based on Figure 6.3.2–1, what type of climate do you live in?
- Overall, would you say that the three major factors (temperature, humidity/precipitation, and seasonal shifts) explain your local climate successfully, or is your climate an exception to the general trends?
- If your climate is consistent with the major patterns, explain why. If it is an exception, discuss other factors that may explain your local climate.
- Although we haven’t yet discussed human-caused climate change in any detail (that comes in the next chapter), you are probably aware of some of the changes that have been occurring in your area in recent years. Overall, how would you say your local climate is changing? For example, do you think your climate type is changing, or is the climate type staying the same but the weather is becoming either more or less extreme?
This discussion should help students consolidate their understanding of climate, and also help them start thinking about our coming discussion of climate change in the next chapter.
- (1) This question should serve as a way to confirm that students understand the major factors, since we have already discussed how they relate to the general climate patterns.
- (2) to (4): Answers will vary depending on where you live, but try to focus on the climate factors we have discussed in this chapter, including both the major factors and additional factors such as ocean moderation, rain shadow, and altitude.
- (5) Use this question to help build motivation for our discussion of global warming in the next chapter.