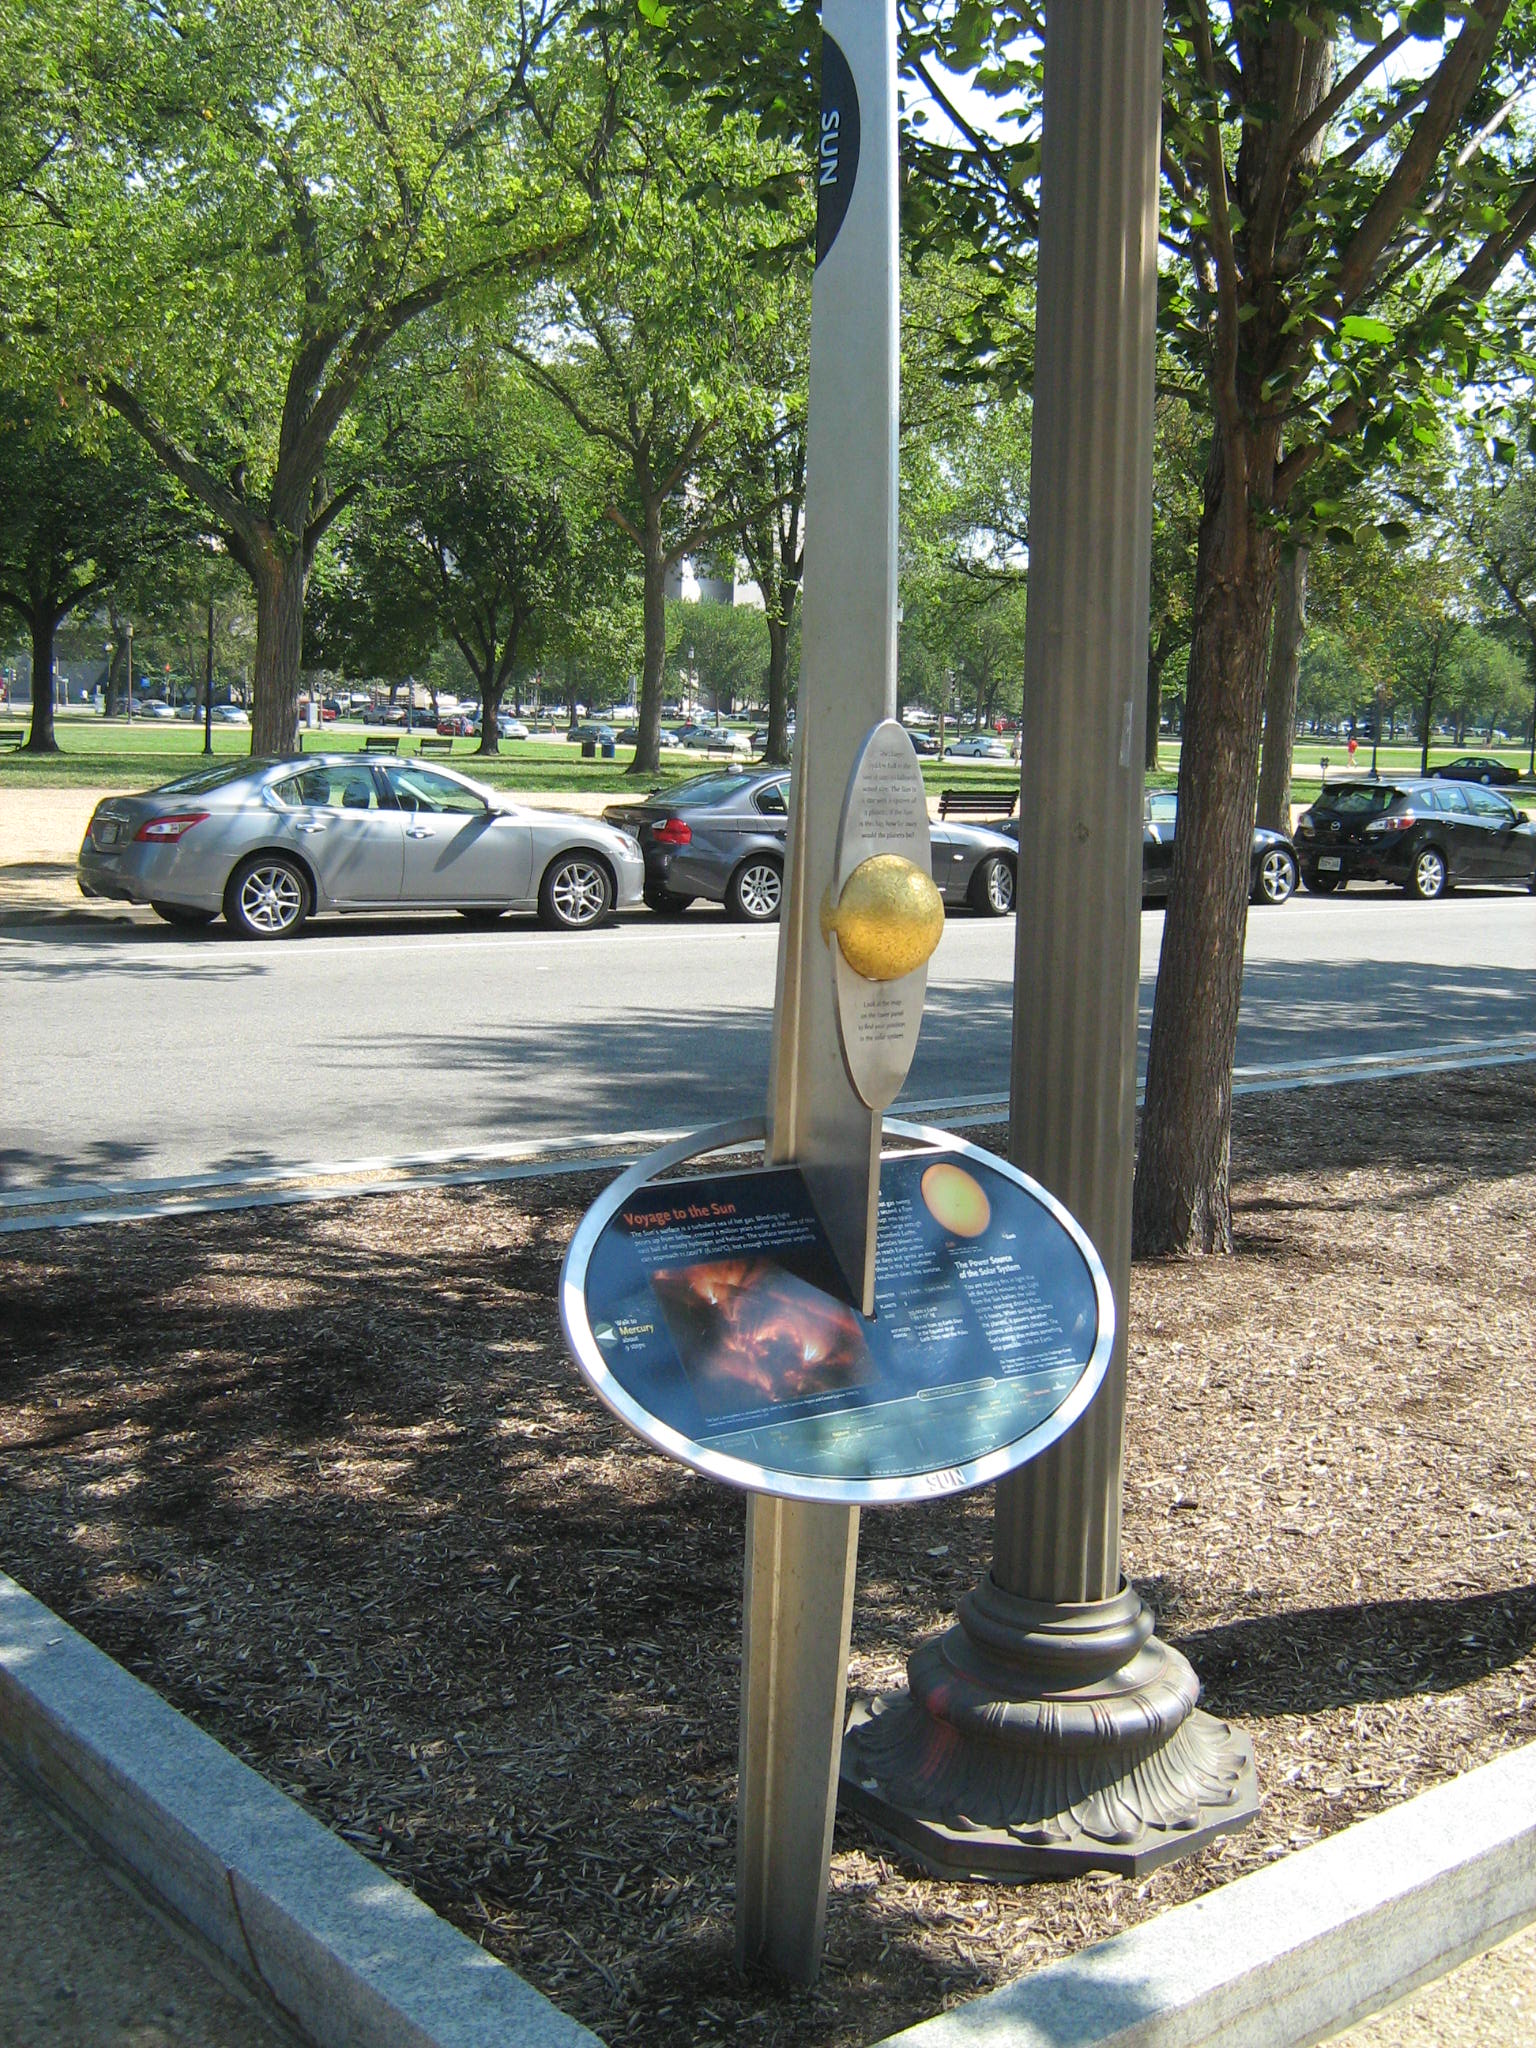
For our scale jump, let’s shrink the Sun down to a size you could hold in your hands. We’ll make it about the size of a large grapefruit, as shown in the photo above. How big will Earth be now? Make a guess before we continue, and draw it on a piece of paper.
It’s easy to figure out the correct answer. The real Sun is 10 billion times as large as the one we are using as our grapefruit-size model, which means we are using a scale of 1 to 10 billion (1 to 10,000,000,000). In other words, we can find sizes and distances in our solar system model simply by dividing real sizes and distances by 10 billion.
Let’s do this to find Earth’s size on this scale. The steps below show the general procedure, but for this example we’ve filled in the answers at each step.
Teachers Notes: The following calculation shows a very common and useful type of procedure, so it is worth making sure your students understand. Note that in Step 2, we drop the excess zeros at the right after the conversion, because they are not justified by the number of significant digits in the starting value. We have not explained this to students because it is fairly subtle, but you may wish to discuss it with your class.
Step 1: Look up Earth’s real diameter.
Earth’s diameter is about 12,800 km.
Step 2: Divide by the scale factor of 10 billion.
12,800 km ÷ 10,000,000,000 = .00000128 km
Note: Because 10 billion is 1010, or a 1 followed by 10 zeros, dividing by 10 billion means moving the decimal point 10 places to the left: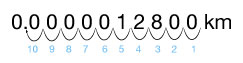
Step 3: Because the result is such a small fraction of a kilometer, convert to meters, which means multiplying by 1,000 because there are 1,000 meters in a kilometer.
.00000128 km × 1,000 m/km = .00128 m
Step 4: The result is still only about 1/1,000 of a meter, so we can make it even easier to understand by converting it to millimeters, remembering that there are 1,000 millimeters in a meter.
.00128 m × 1,000 mm/m = 1.28 mm
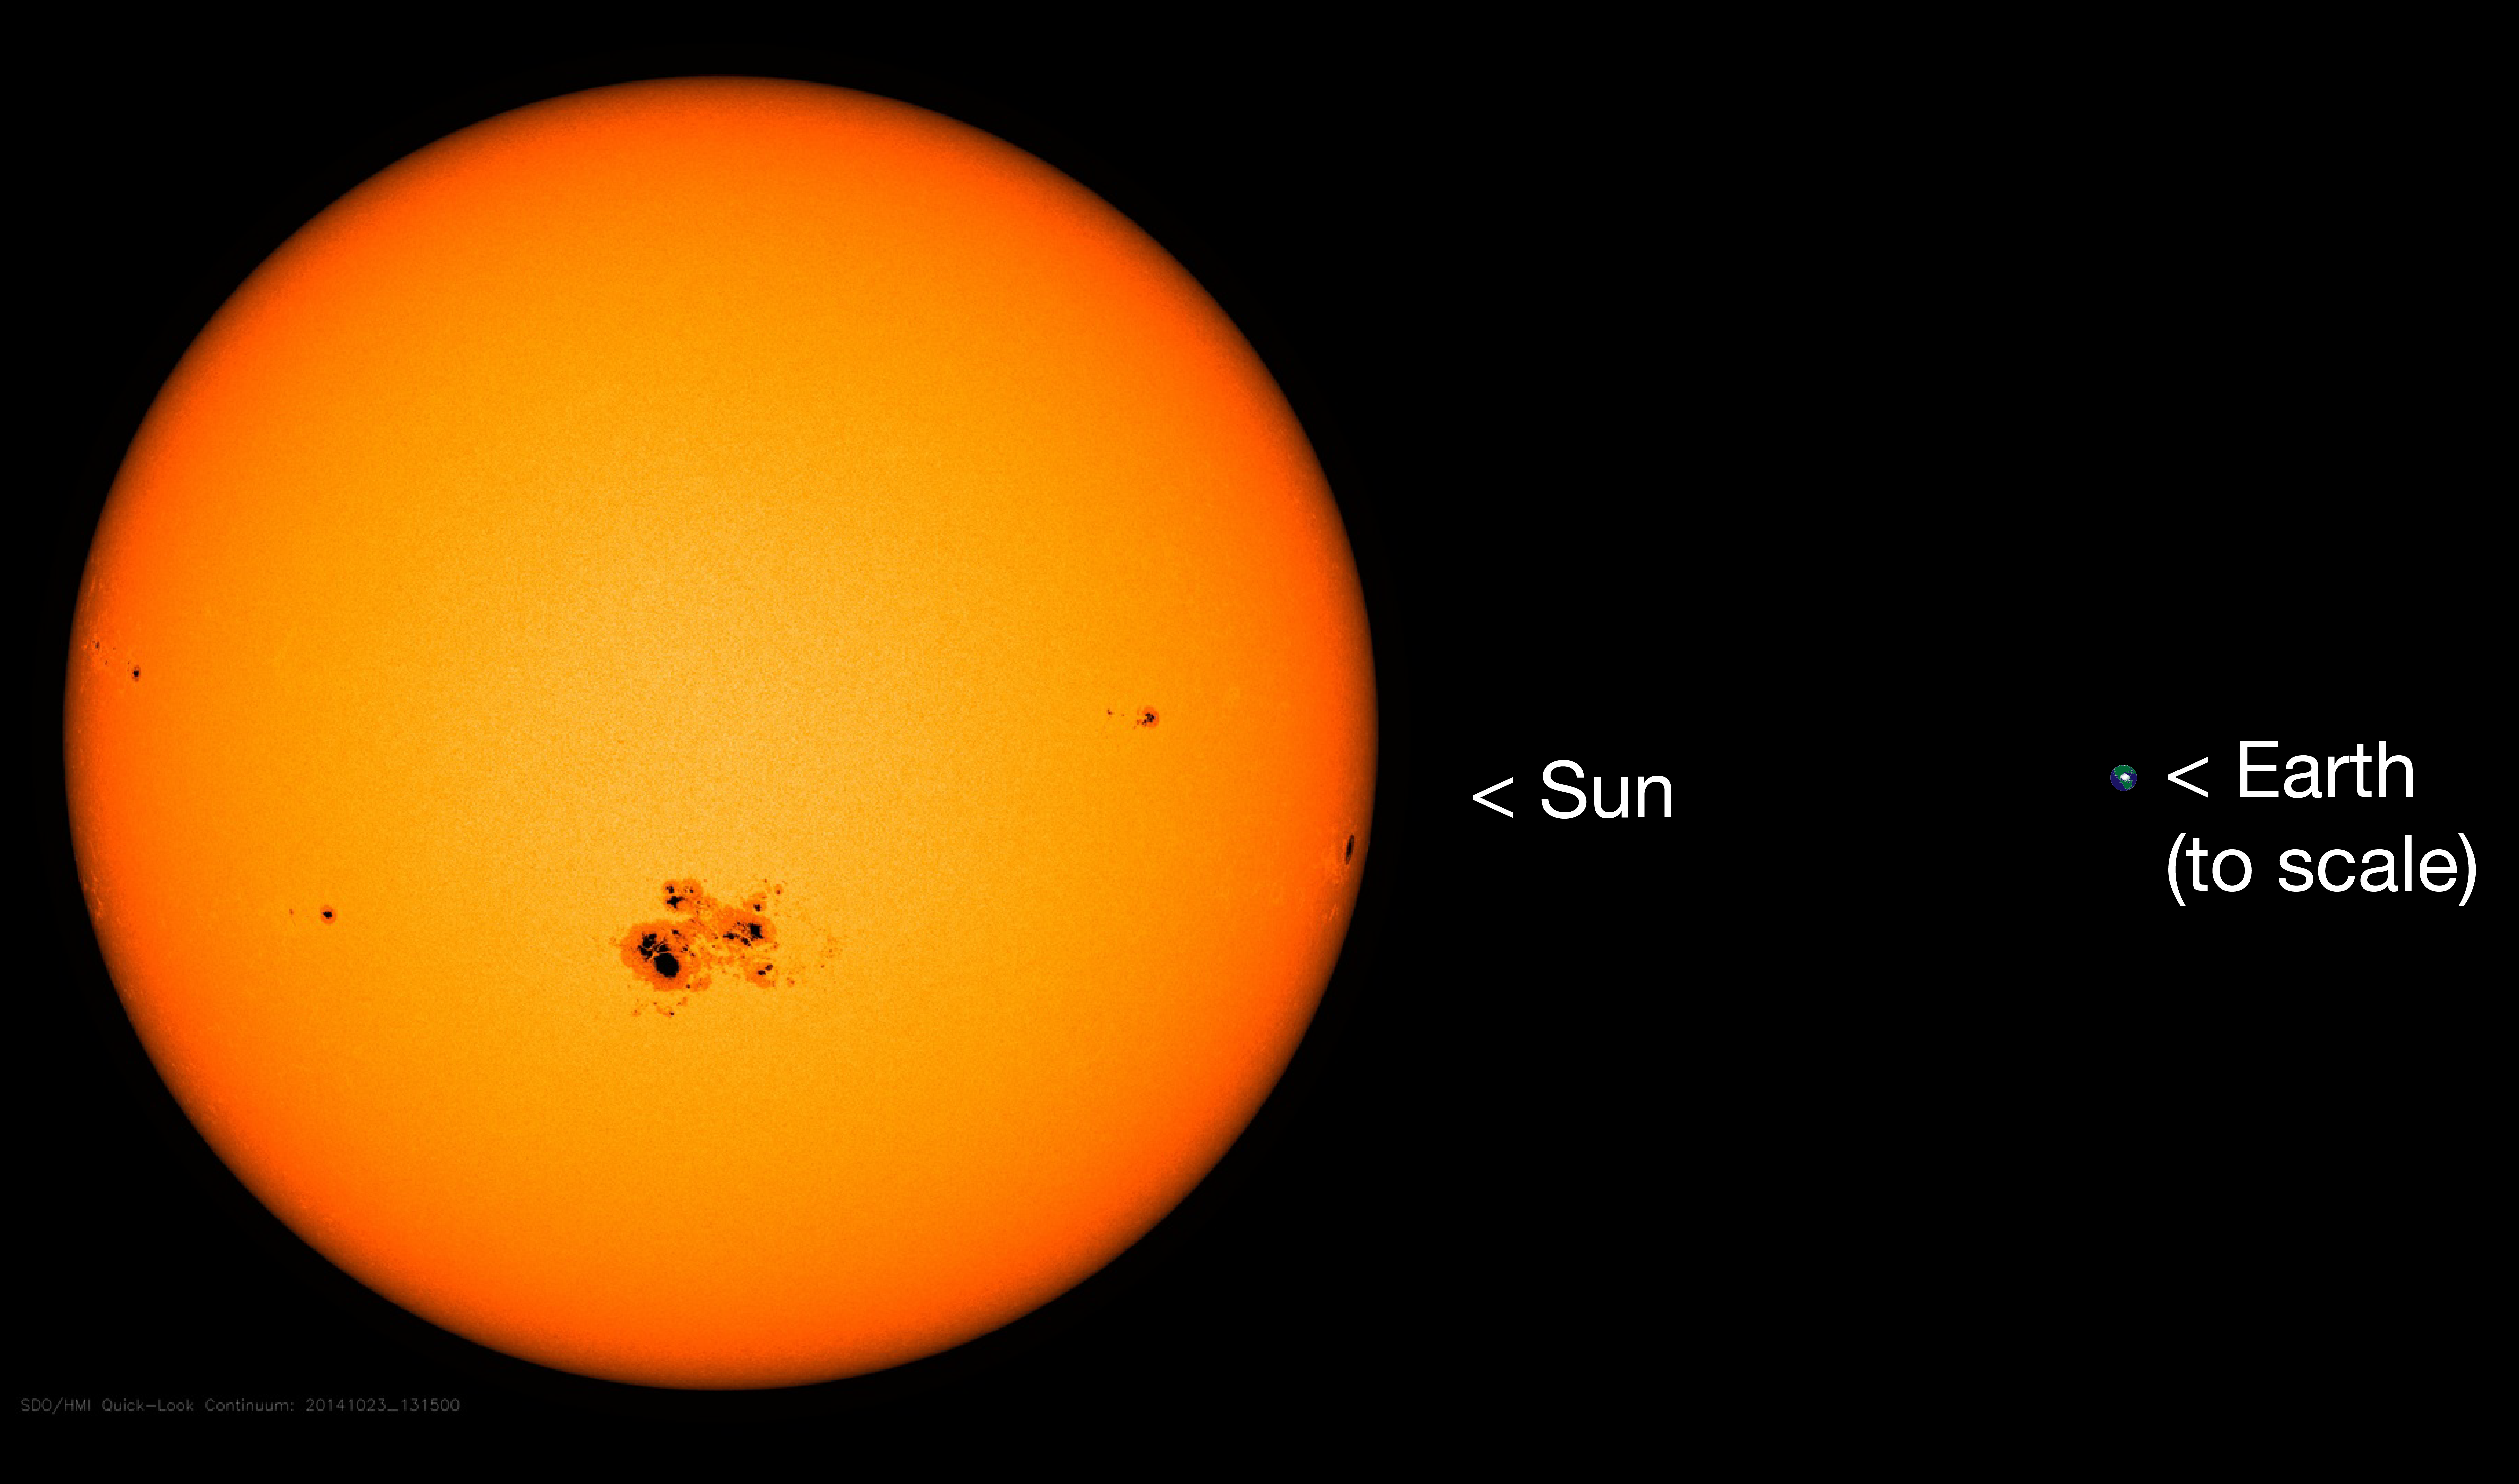
In other words, our model Earth is only a little over a millimeter in diameter on this scale, which means it is smaller than the tip of a ballpoint pen. If you repeat the procedure for all the other planets, you’ll find the scaled sizes shown in the figure below.
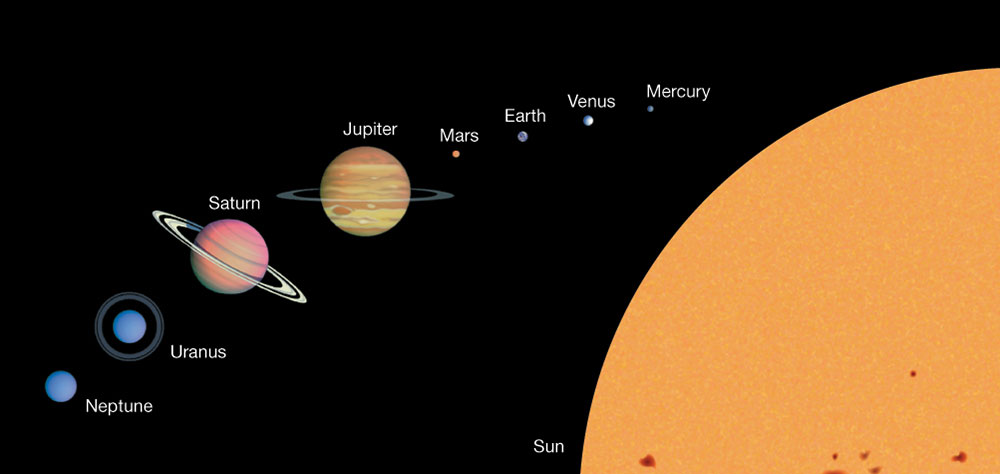
Notice that the planets are all much smaller than the Sun. For example, while the Sun is the size of a large grapefruit on this scale, the largest planet, Jupiter, is only about the size of a marble. Can you see Jupiter’s “Great Red Spot”? Notice that it’s bigger than Earth!
Now that we have the scaled sizes, we’d next like to know the scaled distances of objects from the Sun. We can use the same basic procedure that we used for sizes. For example, here’s the procedure for Earth.
Step 1: Look up Earth’s real distance from the Sun.
Earth’s distance from the Sun is about 150,000,000 km.
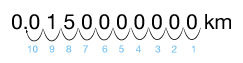
Step 2: Divide by the scale factor of 10 billion.
150,000,000 km ÷ 10,000,000,000 = 0.015 km.
Again, we simply need to move the decimal point 10 places to the left:
Step 3: We’ll again convert to meters.
.015 km × 1,000 m/km = 15 m
Note that we don’t need a Step 4 this time, because there is no reason to convert the 15 meters to any other unit.
Group Activity
Solar System to Scale
- Prepare your materials:
– Find or make objects that you can use to represent the Sun, Earth, and Jupiter on the 1-to-10 billion scale.
– Measure out a ribbon or string to represent Earth’s correct scaled distance of 15 meters from the model Sun.
– On a piece of paper, draw a dot 1 millimeter across to represent Earth, then draw a circle around it with a radius of 4 centimeters to represent the Moon’s orbit around Earth on this scale. - One student should hold the model Sun in an open area. Another student should hold the model Earth, and use the measured 15-meter ribbon or string to go the correct scaled distance from the Sun. How does the Earth—Moon distance compare to the Earth-Sun distance?
- Keeping the 15-meter ribbon or string taut, walk in a circle around the model Sun to represent Earth’s orbit. How long does the real Earth take to complete each orbit?
- Now, have the student holding Earth stay in place. Another student should hold the model Jupiter and use the ribbon to measure out the correct scaled distance to Jupiter.
- Come back together, and discuss how seeing part of our solar system to scale changes your perspective on space, space travel, and Earth’s place in the universe.
Teacher Notes: For this activity, students will need models of the Sun, Earth, and Jupiter. There are many ways to do this. E.g., though it won’t be exact, you can approximate the scale with a large grapefruit to represent the Sun, a small ball point (or 1 mm ball bearing) for Earth, and a marble for Jupiter. A 5-inch (12.7 cm) Styrofoam ball is also good for representing the Sun, as it is only a little smaller than the correct scaled diameter of 14 cm.
Because making Earth’s orbit requires a fair amount of space, this activity works best outside on a playground or field. You can choose whether to do it all as a class or to break students into smaller groups.
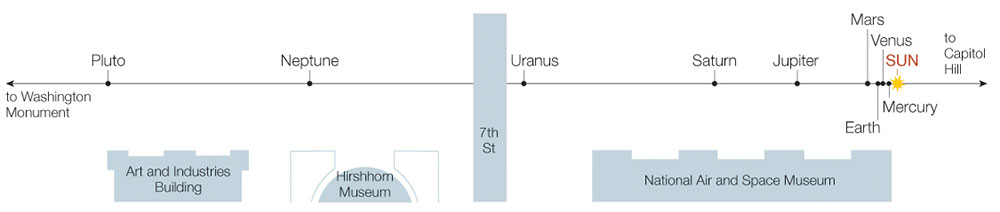
The map below shows the layout of the planets in the Voyage scale model solar system, which is located in Washington, DC. Spend a few minutes studying the sizes and distances of the planets on this scale, and be sure that you understand all the following key ideas:
- The planets are all very tiny compared to the distances between them.
- The four inner planets are grouped much more closely together than the four outer planets.
- The total distance from the Sun to Neptune on this scale is less than half a kilometer, which means you could walk it in just a few minutes.
- On this same scale, the Moon is only about 4 centimeters from Earth, which means you could fit the Moon’s entire orbit in the palm of your hand.
Wow Factor
That’s why they call it “space”!
Perhaps the most striking feature of our solar system when we view it to scale is its emptiness. If we placed the scale model Sun in the middle of an open area and then drew all the planet orbits around it on the 1-to-10 billion scale, we’d need an area almost a kilometer on a side—which is equivalent to about 300 football fields arranged in a grid. Spread over this large area, only the grapefruit-size Sun, the tiny planets, and a few moons would be big enough to see. The rest of it would look virtually empty. So now you know why the place where we find the real Sun and planets is called “space”!
Journal Entry
A Planetary Tour
Visit this link to take a virtual tour of the Voyage scale model solar system, and read through the short overviews provided for the Sun, each of the planets, the asteroid belt, and “Pluto and the comets.” In your journal, make an entry titled “Favorite Solar System Facts” and then write down one fact for each object (or category like “asteroids”) that you find particularly interesting. That is, your journal entry should look something like this:
Favorite Solar System Facts
The Sun: [write down the fact you find most interesting]
Mercury: [write down the fact you find most interesting]
…
This journal entry will take a little more time than most others, since it requires students to read through the planetary tour. Note that these facts will come in useful in Section 4.3, when we look more closely at how Earth compares to other worlds in our solar system.
Claim-Evidence-Reasoning Activity
Classifying Planets by Size and Distance
You have already explored planet classification briefly in an earlier Discussion. Now, let’s look at it more quantitatively. You will need to refer to the following table which gives the diameters and orbital distances of the eight planets.
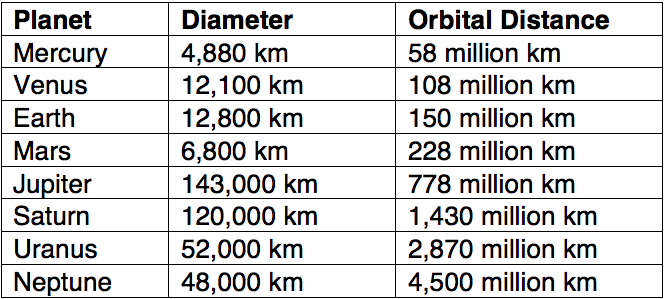
Step 1: Using either graph paper or computer software, make a graph using the above data as follows:
- Label the x-axis as “orbital distance (millions of km).” The axis should go from 0 to 5,000 (million km), with tick marks representing steps of 500 million kilometers.
- Label the y-axis “planet diameter (km).” The axis should go from 0 to 160,000 km, with tick marks representing steps of 20,000 km.
- Plot the data from the table above on your graph.
Step 2: Study your graph. How can you tell which dots correspond to which planets? Identify each dot with the correct planet.
Step 3: Based on your graph, use evidence and reasoning to either support or refute the following claim:
Claim: “Planets fall into two major groups: (1) small and close to the Sun and (2) large and far from the Sun.”
Step 4: Consider your graph along with what you learned when reading through the virtual tour of the Voyage scale model solar system, then use evidence and reasoning to either support or refute this next claim:
Claim: “The two major groups of planets are also distinguished by composition: (1) those that are small and close to the Sun are rocky in composition, and (2) those that are large and far from the Sun have hydrogen-rich compositions.
Students have previously (in the Discussion in Section 1.1.3) seen how we generally classify planets into two major groups: the four inner planets that are small and close to the Sun, and the four much larger outer planets. This activity asks them to look at this more quantitatively by making a graph, then interpreting the graph with the Claim-Evidence-Reasoning format that we first used in Section 1.2.2 and will use many times throughout this book. Key notes:
- Step 1: You can decide whether you wish to have students do the activity on graph paper or with computer software. Either way, be sure they understand how to label their graphs correctly. The resulting graph should look like this:
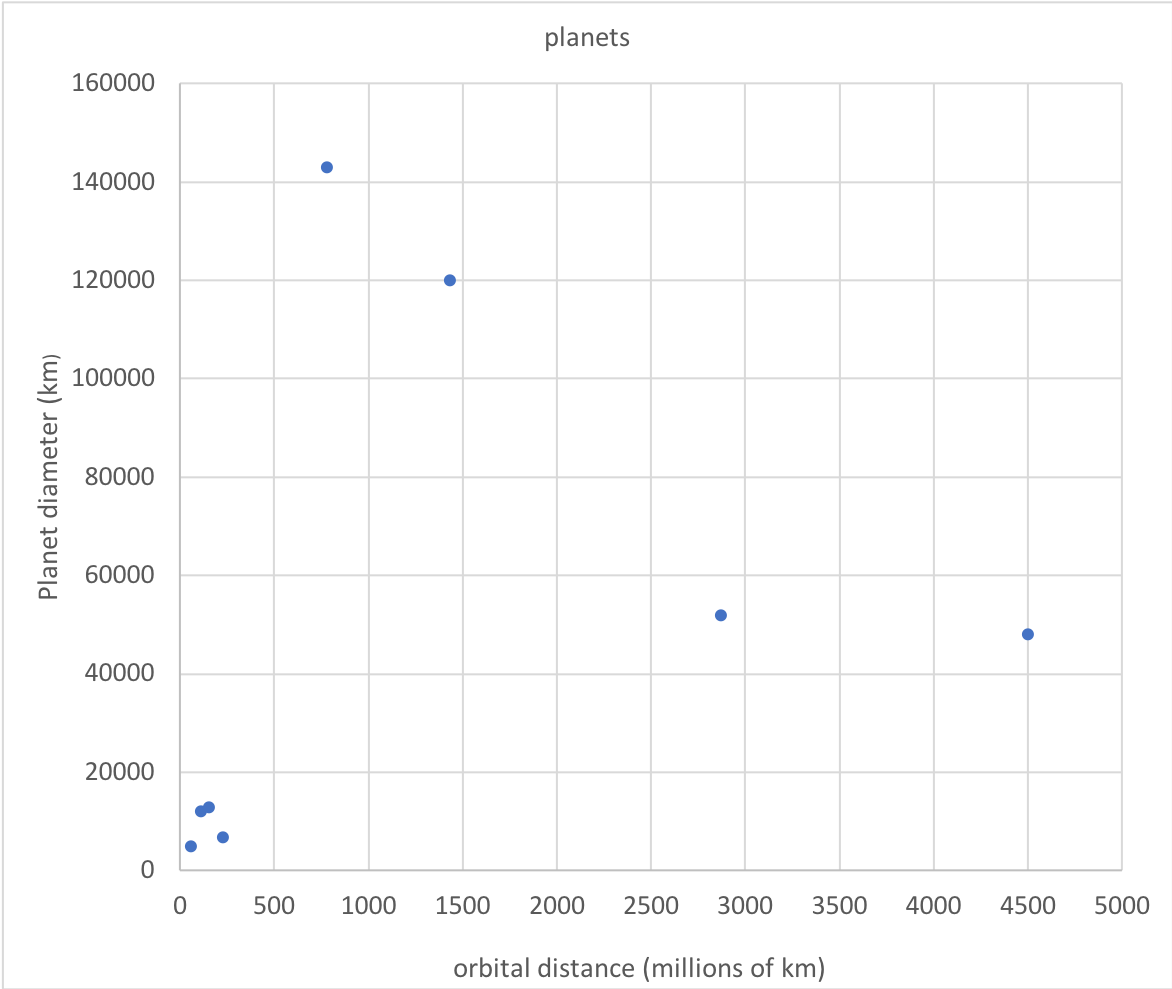
- Step 2: The easiest way to identify the dots is to recognize that they go in distance order, since the x-axis is labeled with distance. Therefore, the dot furthest to the left is Mercury, the next one is Venus, and so on. Note that many students might at first have difficulty recognizing this, but it should be easy for them to understand once they see it.
- Step 3: To support the claim, students should notice that the four inner planets are clustered tightly together on the graph, while the four outer planets are clearly in a different region of the graph. Note, however, that some students may legitimately argue that the outer planets are too spread out on the graph to represent a single group. As already discussed in the Discussion in Section 1.1.3, this is why some scientists consider Jupiter/Saturn and Uranus/Neptune to be subgroups of the four outer planets.
- Step 4: The data tables in the virtual tour should make clear that this claim is supported.
Note: We will discuss why the planets have this pattern in Section 4.3. In the meantime, for your own background, you may wish to watch this summary video created for the lead author’s college textbook. It should also help you answer questions that students may ask.
Quiz
Note: As always, after you finish the quiz, be sure you read the feedback that explains the correct answers, to make sure you understand the reasons for these answers.