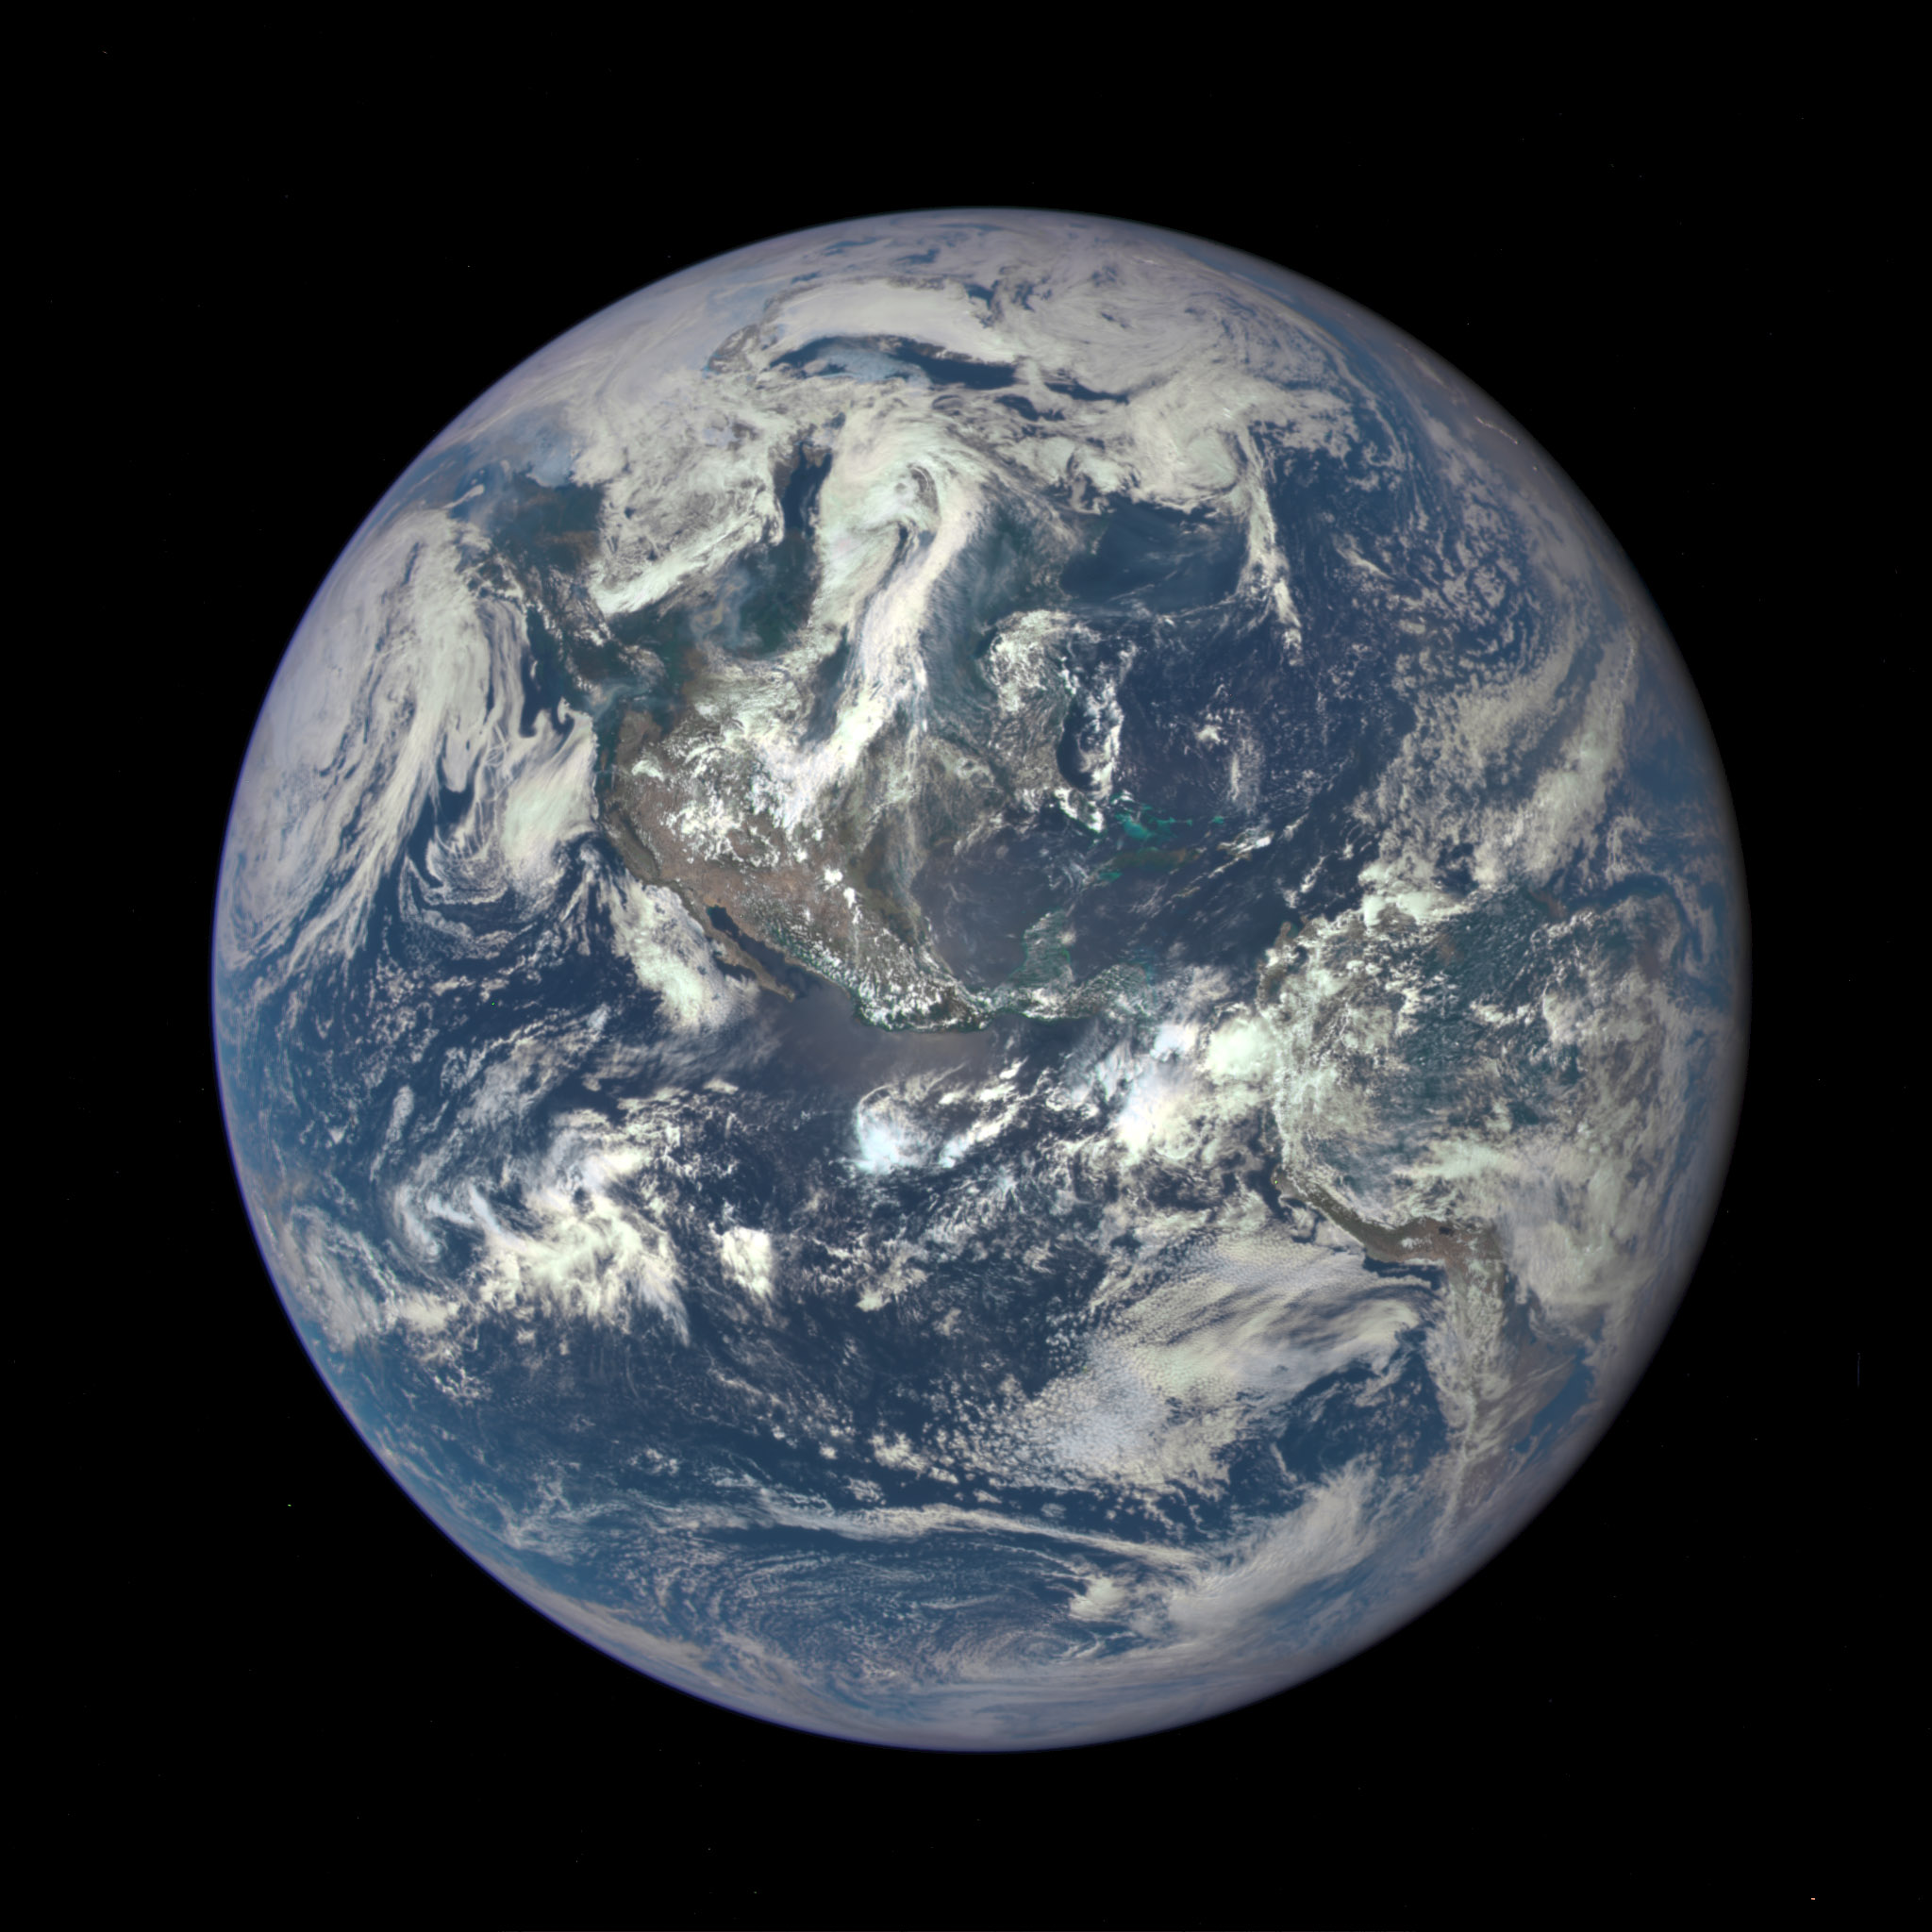
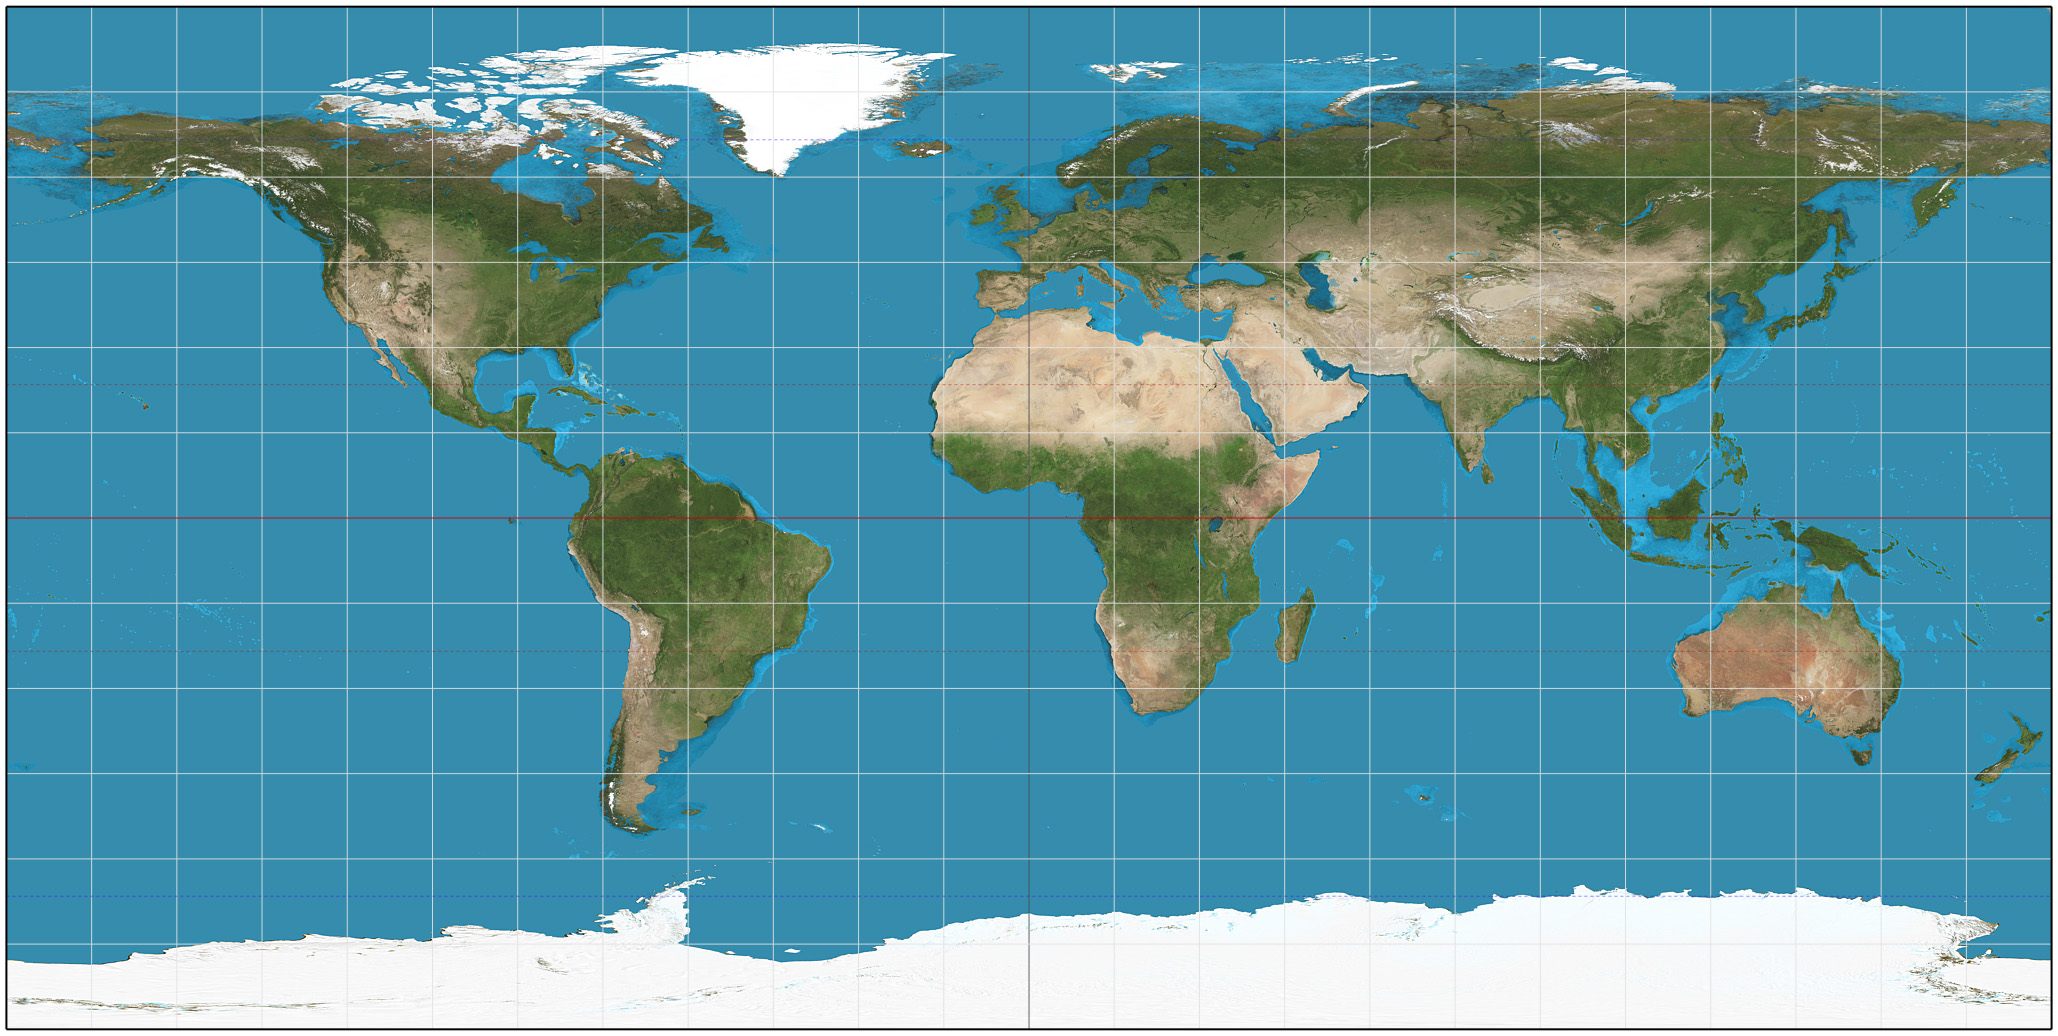
Figure 4.1 shows a single, high-resolution image from the Deep Space Climate Observatory, the same observatory from which you saw the video that opened this chapter. Study both the figure and the video, and think about the major features that you can see.
Activity
Examining Earth
Do the following in small groups.
- Clouds can make it a little difficult to see features beneath them. By comparing Figure 4.1 to a globe, trace the outlines of North and South America in Figure 4.1.
- Do you see any regions in Figure 4.1 that are obviously covered by ice? What other places on Earth are ice-covered?
- Suppose you threw darts randomly at the picture in Figure 4.1. What kind of surface feature would you hit most often?
- Based on the picture, how can you tell that Earth has air?
- The comparison with a globe should allow students to see the full outlines of North and South America in Figure 4.1.
- In Figure 4.1, Greenland is obviously ice covered. More generally, ice is most commonly found in polar regions.
- Oceans, because oceans cover most (about ¾) of Earth’s surface.
- The clouds tell us that Earth must have air, even though you can’t see air itself. Also note that, as we’ll discuss later, the presence of oceans also implies the existence of air, though this is something we know only with a deeper understanding of the role of air pressure.
If we consolidate the ideas discussed in the Activity above, you’ll realize that the images show four major features of our planet, three of which mark the surface and one that lies above the surface:
- surface feature 1: oceans
- surface feature 2: land
- surface feature 3: regions of land or ocean that are covered by ice
- above the surface: clouds
Of course, this is what we see only on the broadest scale. As we look more closely, we’ll discover many other features of our planet.
Viewing Earth: Globes and Maps
This subsection on globes and maps is designed to help students understand two key points:
- Compared to globes, flat maps of the world inevitably distort shapes and sizes of Earth’s features.
- Because of that distortion, you cannot plot shortest routes as straight lines on flat maps – you must instead follow great circle routes, which are easy to see on globes, but look strangely curved on flat maps.
Most students probably have not already learned these ideas previously, which is why this subsection is included here. However, if your students are already familiar with these two points, then you may skip this subsection.
Note: Many schools cover geography in other classes (besides science); if so, you might encourage teachers of those classes to cover this subsection, hopefully before your students reach this point in your course.
We use globes and maps to help us study our planet more closely. Globes are the most accurate representations, because they are the only representation that correctly shows our Earth as round. In contrast, flat maps always introduce some distortions, because it is not possible to make a flat map that perfectly represents a round object.
Activity
Flattening a Sphere
Try one of the following two options for exploring why flat maps always introduce distortions when we use them to represent round worlds.
Option 1: Using an inflatable Earth (that you will cut up).
Step 1: Inflate the inflatable Earth, so you can see that it is indeed round (or roundish, since inexpensive inflatable globes are usually not perfect).
Step 2: Use a scissor and carefully cut the globe from its north pole to its south pole, so that you can try to lay it flat. However, you will see that the globe cannot be laid flat with this single cut.
Step 3: Can you make additional cuts that will allow it to lay flat? Feel free to experiment.
Step 4: Discuss your results. Is there any way to lay the inflatable globe flat without distorting its shape?
Option 2: Using round, peelable fruit (for example, an orange, tangerine, or grapefruit).
Step 1: Each student (or pair of students) should get their own fruit. Wash your hands and the fruit before you begin, since you can eat the fruit when the activity is complete.
Step 2: Use a marker to mark the fruit with a north and south pole, equator, and rough outlines of Earth’s continents and oceans.
Step 3: Try to peel your fruit carefully in a way that allows you to lay the peel flat on a table.
Step 4: Compare your attempt to the attempts of other students. Did anyone successfully find a way to lay the peel flat? Is it possible to find a way to lay the peel completely flat without distorting its shape?
Step 5: Enjoy your fruit snack!
This activity should help students understand why it is not possible to make a flat map of Earth without introducing distortions of some type. You may choose to have students do one or both options. In deciding between the options, note that:
- If you have a budget for purchasing inflatable Earths, Option 1 is generally easier to do, because it is easier to cut up the inflatable Earth than to peel the fruit carefully. You can purchase these on Amazon or elsewhere by searching for “inflatable Earth globe”; if you buy a set of them (e.g., 6 or more), you can probably find them for under about $2 each. Of course, you should also keep in mind that this option involves waste in cutting up inflatable globes.
- You may find it useful to watch the beginning of this video, which shows a demonstration of cutting an inflatable Earth.
- Option 2 requires providing the fruit for students, but you may be able to do that with the help of your school cafeteria without a budgetary impact on you. One advantage of this option is that because each student will peel the fruit differently, they can compare and see that there is no strategy that will successfully allow the peel to be laid flat.
Given that flat maps of Earth always have distortions, you might wonder why we ever use them rather than always using globes. Think briefly about this, then discuss the following question with a classmate:
Discuss this question with a classmate, then click to open the answer and see if it agrees with what you came up with.
- Although a globe is always a better representation of Earth than a flat map, are there any advantages to using flat maps?
Despite their distortions, flat maps have at least three advantages over globes:
- A flat map allows us to view all of Earth’s surface at once. In contrast, a globe allows us to see only half of Earth at any one time, since the other half will be facing away from us.
- A flat map can be easily displayed on a wall or in a book or on a screen, while a globe cannot be.
- A flat map can be folded or rolled up, making it much easier to carry around than a globe.
Different Types of Flat Map
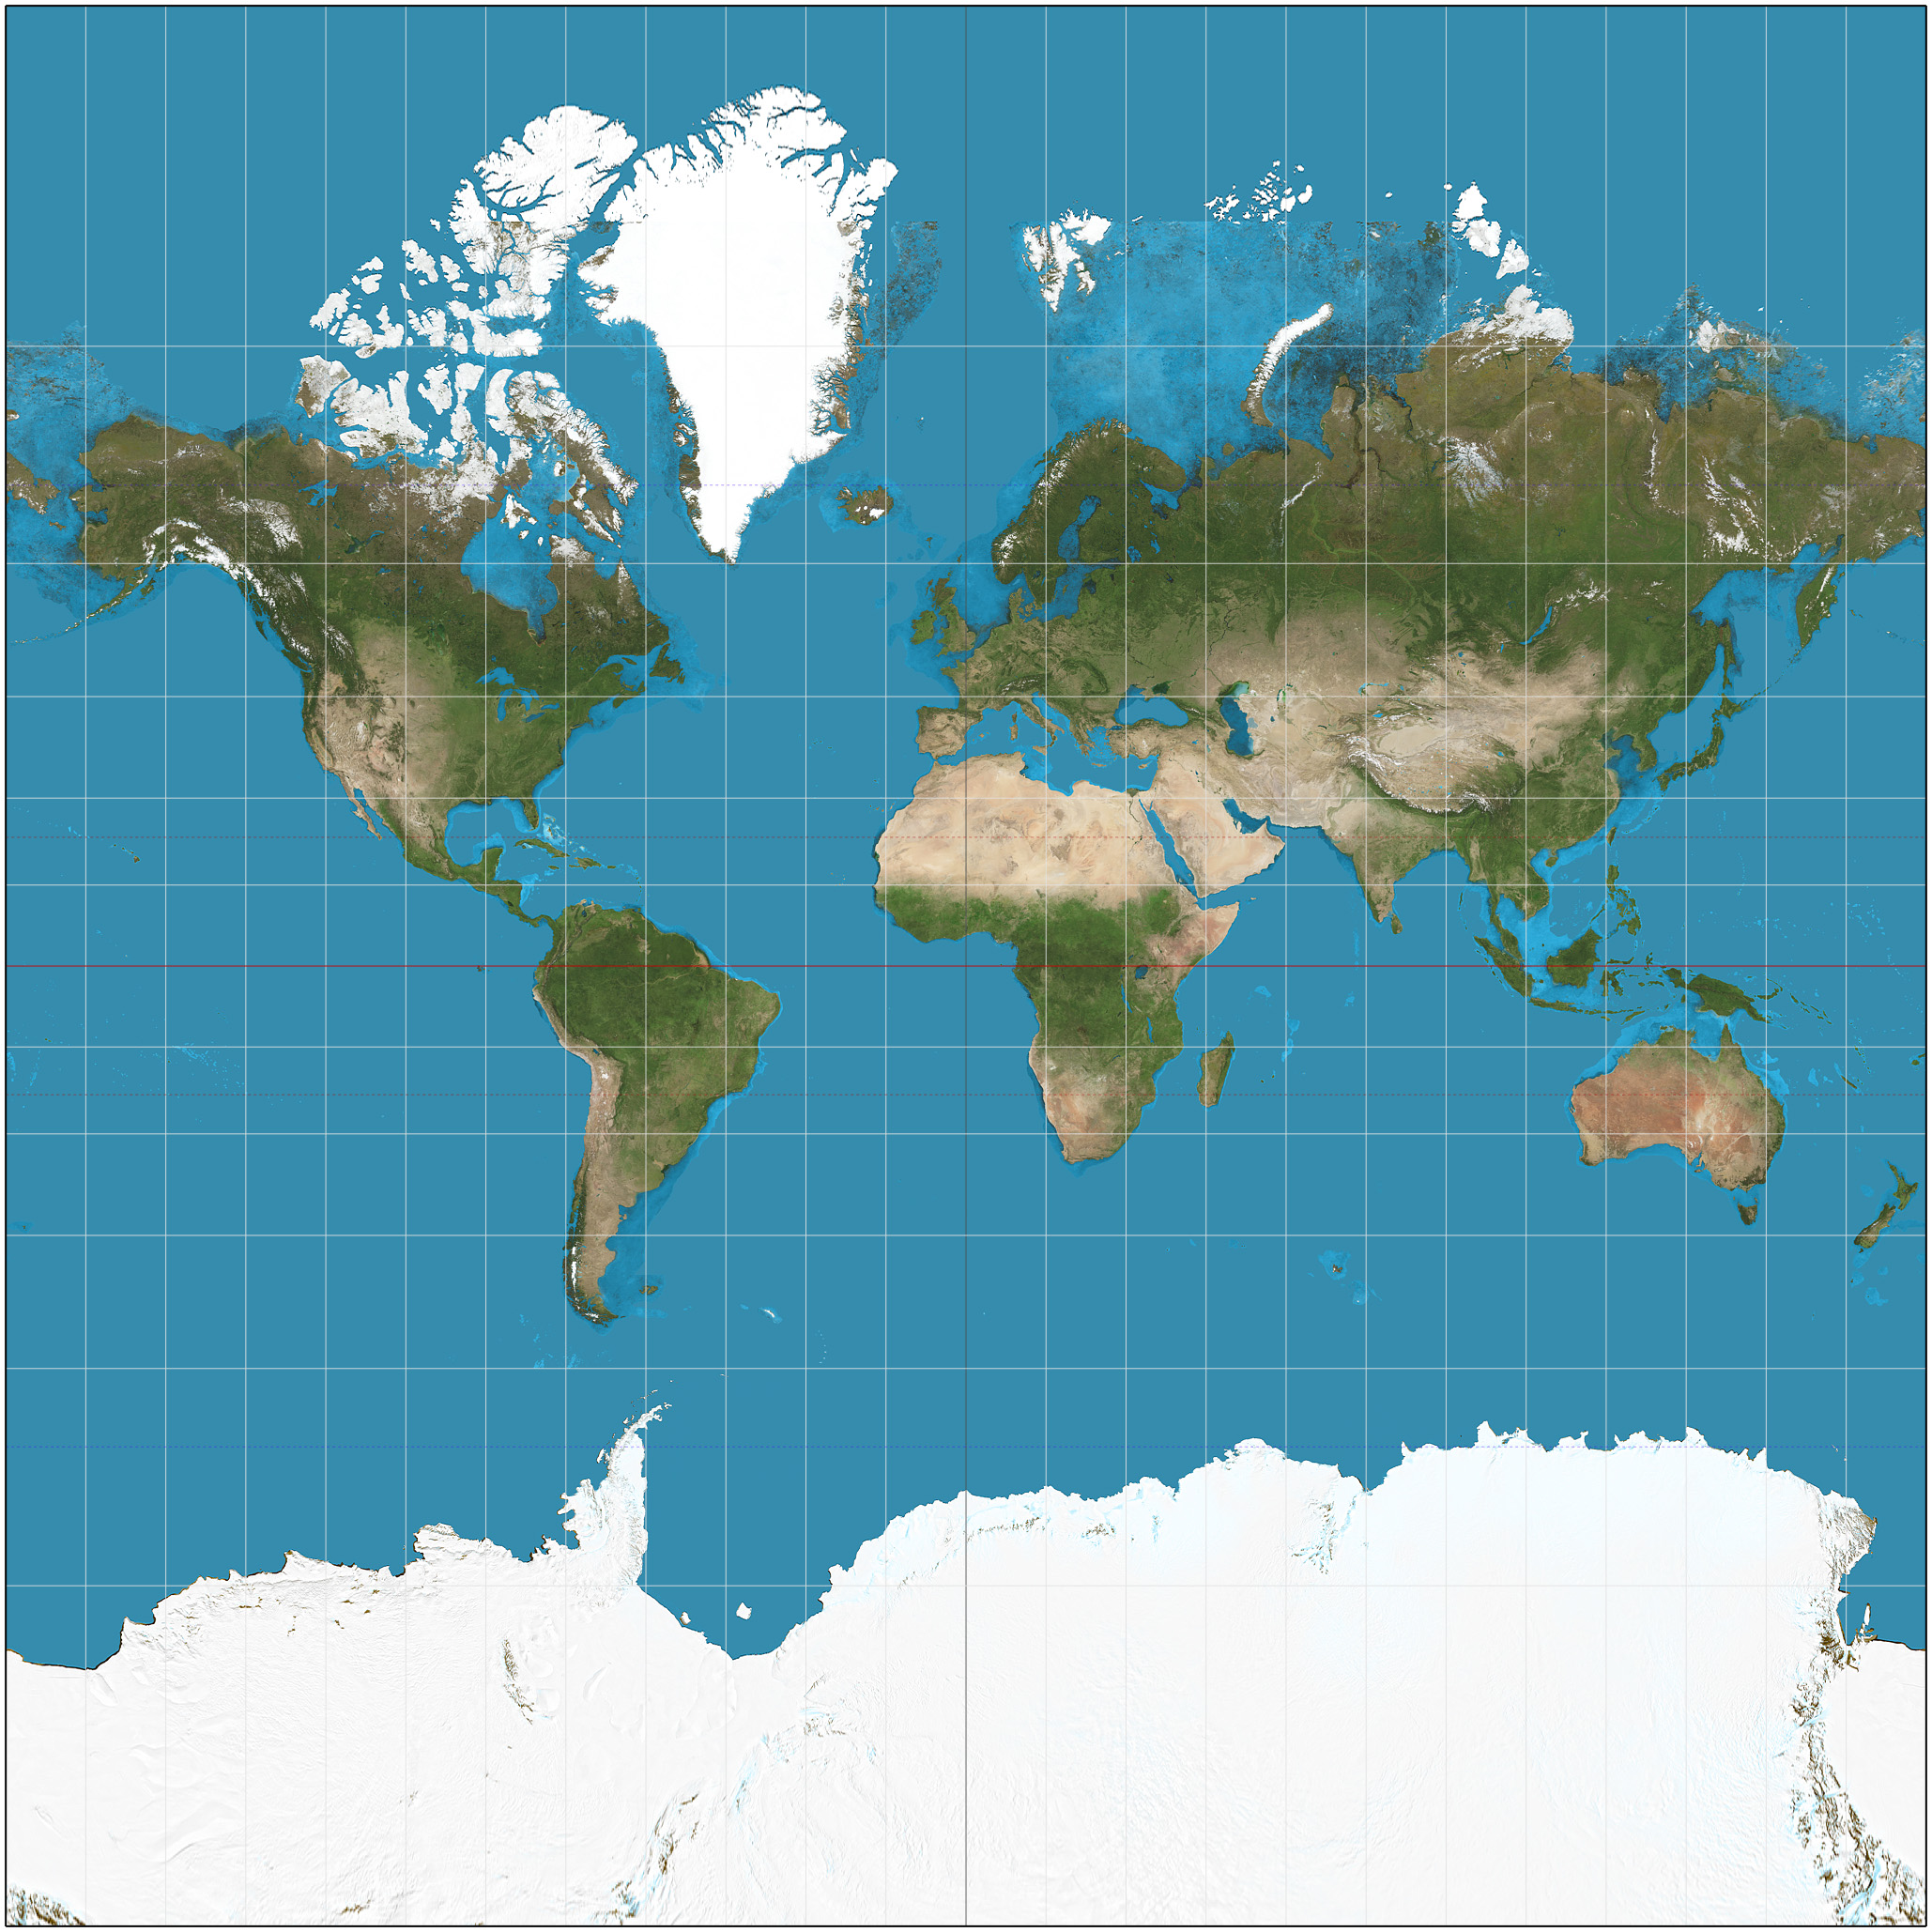
Flat maps can be made in different ways, but all involve some type of slicing of Earth’s surface, then stretching or compressing different areas to flatten them out. More technically, all flat maps are projections of the 3-dimensional round Earth onto a flat surface, in which each point on the globe has a corresponding point on the flat map. Video 4.2 shows this process in action for one of the most common types of wall map, called a Mercator projection (named for the person who invented it: Gerardus Mercator (1512-1594)). Watch the video, then discuss the questions that follow.
Discuss the following questions with a classmate, then click to open the answer and see if it agrees with what you came up with.
- How do lines of latitude change as the globe is mapped onto the Mercator projection?
Remember that lines of latitude are parallel to the equator, which means horizontal on the screen. As the video shows, lines of latitude remain parallel to one another in the Mercator projection, though the distances between them are stretched at higher latitudes (both north and south).
- How do lines of longitude change as the globe is mapped onto the Mercator projection?
Lines of longitude run from the north pole to the south pole. This means that on a globe, these lines all meet at the two poles. In contrast, lines of longitude appear parallel on the Mercator projection. To make this happen, the Mercator projection starts with the lines at their original spacing on the equator, then pulls them apart as it moves toward the poles. In other words, the Mercator projection stretches east-west distances as you go from the equator toward the poles.
- Do you notice a pattern in the distortion of the sizes of countries or continents on the Mercator projection compared to their true sizes on the globe?
Relative sizes are approximately accurate near the equator, but become increasingly exaggerated toward the poles. The animation below shows how true sizes compare to the exaggerated sizes on the Mercator projection.
Mercator Distortions
This animation shows how the exaggerated sizes in the Mercator projection (shown at the beginning) compare to their true sizes of land masses (shown at the end). Notice that the exaggeration is more extreme as you go farther from the equator. Credit: Created by Jakub Nowosad, used under Wikimedia Commons license.
The Mercator projection is just one of hundreds of different map projections that have been created. Each different projection has advantages and disadvantages. In the case of the Mercator projection:
- The main advantage of the Mercator projection comes when it is used for navigation. It is set up so that if you determine the direction (such as northeast or south-southwest) between two points on a Mercator map, you can travel between those points by setting a compass to that same direction.
- The main disadvantage of the Mercator projection is that it greatly distorts shapes and sizes as you move away from the equator. For example, while Greenland and Africa appear to be about the same size on the Mercator projection (Figure 4.3a), in reality Africa is about 14 times as large in area as Greenland (Figure 4.3b).
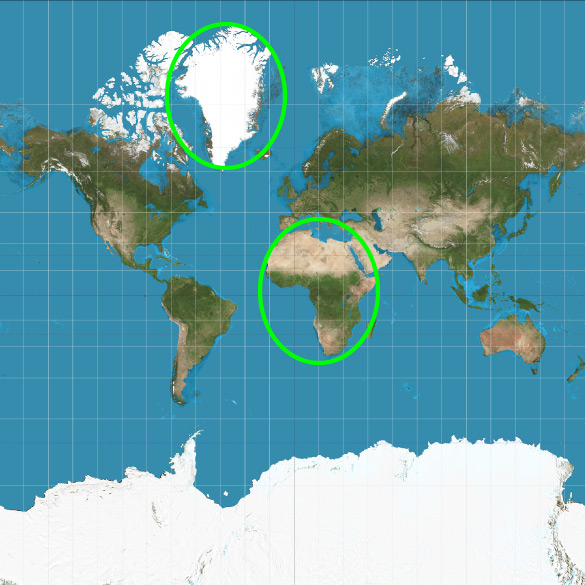
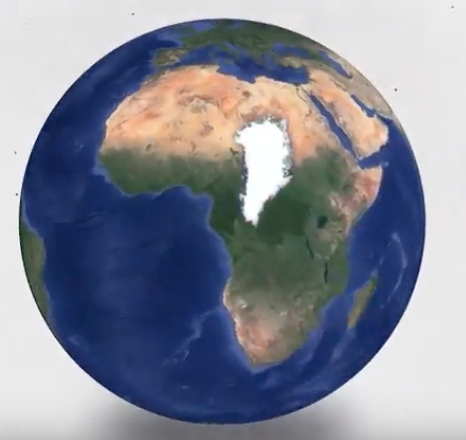
Figure 4.3 – This pair of diagrams shows how the Mercator projection makes Greenland look much larger than it is in reality.
We will use a variety of flat map projections in this book. Each has different advantages and disadvantages. For example, Figure 4.4 shows what is called an equirectangular projection. Notice that, because it is more compact than a Mercator projection as you look toward the poles, this projection has somewhat less distortion of sizes than a Mercator projection. Equirectangular projections have become particularly common for showing satellite data on flat maps.
Discussion
Mercator Vs. Equirectangular
Carefully compare the Mercator projection (Figures 4.2 and 4.3) and the equirectangular projection (Figure 4.4), then discuss the following questions with classmates:
- What difference between them explains why the Mercator projection is square and the equirectangular projection is a rectangle?
- How does this difference reduce the distortion of sizes in the equirectangular projection?
- Are sizes still distorted in the equirectangular projection? For example, is Greenland still too big compared to Africa?
- Why do you think equirectangular maps are now more commonly used than Mercator projections?
This brief discussion will help students learn how to compare different map projections. The basic answers are fairly simple, but there are some interesting subtleties that you may wish to discuss further with your students:
- Question 1: The difference is in how the latitude lines are spaced. The equirectangular projection has all latitude lines spaced equally, while the Mercator stretches out the distances between latitude lines as it goes toward the poles. This “stretching” is what makes the Mercator useful in navigation, as the amount of stretching was chosen (by Gerardus Mercator, 1512-1594) to make sure that straight lines would represent accurate compass headings between points on Earth. Note that this means that you cannot use an equirectangular map for navigational headings.
- Question 2: Because the equirectangular map is less stretched out, the sizes are less exaggerated toward the north and south.
- Question 3: As students should already have learned from Figure 4.3, Africa is in reality about 14 times as large in area as Greenland. You can clearly see that Greenland is still too large on the equirectangular projection, indicating that sizes are still distorted.
- Question 4: The most obvious advantages are the ones already noted in the paragraph before this discussion: The equirectangular map is more compact and has less size distortion. Another (and arguably more important) reason that the equirectangular projection has become so common is that it provides a simpler mathematical correspondence between points on the globe and points on the map, which means that global data sets from satellite observations can be more easily projected onto an equirectangular projection.
Take It To The Next Level
Map Projections
Coming Soon . . .
Finding the Shortest Distance
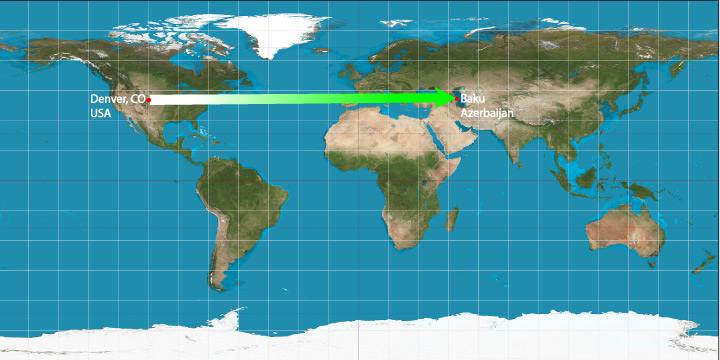
Besides their distortions, another drawback to flat maps is that they make it difficult to find the shortest path between two places on Earth. To see why, imagine that you are a pilot and you are planning a flight from Denver, USA, to Baku, Azerbaijan. You’ll obviously want to try to fly the shortest path between the two cities, because that will minimize travel time and fuel use.
Figure 4.5 shows what your flight path might look like if you plan it on a flat map. Denver and Baku both have the same latitude of about 40°N, so the shortest path appears to be a horizontal line drawn between them. But is it? Try the following activity to decide.
Claim-Evidence-Reasoning Activity
Shortest Flight Path, Part 1
Materials needed: globe, string, scissors, ruler.
Step 1: Locate the cities of Denver (USA) to Baku (Azerbaijan) on your globe.
Step 2: Notice that both cities are located at 40°N latitude, and that the path shown in Figure 4.4 is a path that remains at this latitude. Take a piece of string and lay it along the corresponding path on the globe; this means the string will follow the 40° latitude circle on the globe. (Note: it may help to use tape to hold the string in place.) Once you’ve done that, cut off the ends so that you have a piece of string that represents the distance from Denver to Baku along the 40°N latitude path. Measure the string and write down its length. Optional: Use the globe scale to calculate the real distance represented by your string.
Step 3: Take another piece of string and stretch it between the two cities, but this time try to find the shortest path between them. You may need to experiment with different paths. Once you’ve found the shortest path, notice exactly where it goes on the globe. Then measure the string for this path, and compare to the length you found in Step 2 for the path from the flat map. Optional: Use the globe scale and your string length to calculate the real shortest distance between the two cities.
Step 4: Use your results to construct an argument using evidence and reasoning to support or refute the following claim:
This CER activity asks students to use a globe to prove that the flat map path is not the shortest distance between the two cities. They should find that the shortest path (which is a great circle path) does indeed cross over southern Greenland, as shown after the activity in Figure 4.6.
- If you have enough globes, this activity works best if you have the students work in groups of three, so that one student holds the globe while the others work with the string and scissors. If you have fewer globes, you may need to use larger groups.
- Note: If you don’t have access to globes, it is possible to do this activity using Google Earth or other interactive globes. However, this is more difficult than using a physical globe, since it requires helping the students learn how to mark locations on the interactive globe and then to use a ruler tool to measure the distance between the locations.
- For the optional questions asking them to use the globe scale to compute the real distances, the answers are:
- Distance following a path along the 40° latitude circle is approximately 13,200 km.
- Distance along the shortest (great circle) path is approximately 11,000 km. (In other words, the flat map route is about 20% longer than the actual shortest route.)
- You might wish to point out that this is yet another way to prove that Earth really is round, since it would be possible (in principle) to fly both routes and confirm that only the globe (and not the flat map) gives an accurate representation of the distances.
Figure 4.6a shows what you should have found while doing the activity above. Notice that the shortest path is considerably shorter (by about 2,200 km) than the path that was horizontal on the flat map.
Figure 4.6b shows the same two paths on the flat map. Here, the shortest path looks much longer, but as you should now understand, this is just an artifact of the fact that any flat map distorts the real shape of our planet.
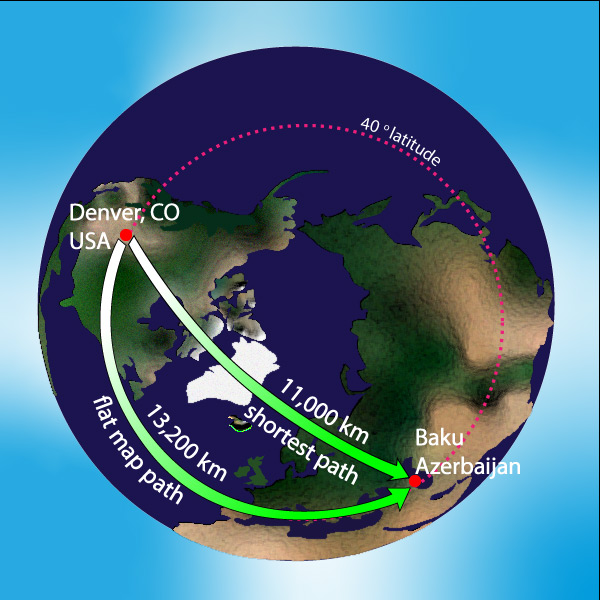
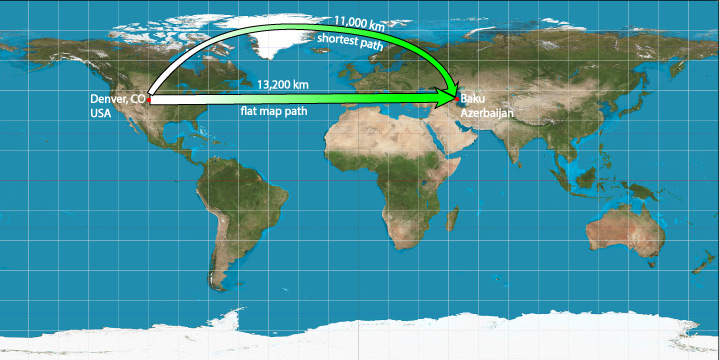
Figure 4.6 – If you want to find the shortest flight path between two cities, you need to consult a globe, not a flat map.
Is there any general rule that you can use to find the shortest path between two places on Earth? Do the next activity to find out.
Claim-Evidence-Reasoning Activity
Shortest Flight Path, Part 2
Materials needed: globe, string.
Step 1: Put your string back on the globe to show the shortest path between Denver and Baku (the path you found at the end of the prior activity and that is illustrated in Figure 4.6a).
Step 2:Get a second, longer piece of string — a piece that is long enough to go all the way around the globe. Lay it directly over the path from Denver to Baku, then stretch it the rest of the way around the globe, so that it is making a full circle. Now, imagine that you could cut the globe in half along the string path. What point would lie at the center of the circle made by the string?
Step 3: Repeat the process with a different pair of cities (that is, not Denver and Baku). That is, use your string to find the shortest path between the two cities, extend the path so it makes a full circle around the globe, and decide what point would be at the center of the circular string path.
Step 4: Continue to experiment with putting the piece of string across the shortest paths between different pairs of cities, and completing the full circular path around the globe. Use your results to construct an argument using evidence and reasoning to support or refute the following claim:
This Part 2 to the prior activity is designed to help students figure out that the shortest path on a globe is always a segment of a great circle (a circle with its center at the center of the Earth). Note, however, that we don’t introduce the term “great circle” until after the activity is completed, though some students may already be familiar with it.
- In Step 2, students will hopefully realize that the center of the circular piece of string is the center of the Earth. You may need to help guide them to this understanding.
- For Steps 3 and 4, be sure they choose pairs of cities with significant separations. No matter what pair they choose, they should always find that the shortest path is a great circle route.
Circles that have their center at the center of the Earth are called great circles . As you found in the activity, the shortest path between two places on Earth’s surface always follows along a great circle. To be sure you understand the concept, try the following questions.
Discuss these questions with a classmate, then click to open the answer and see if it agrees with what you came up with.
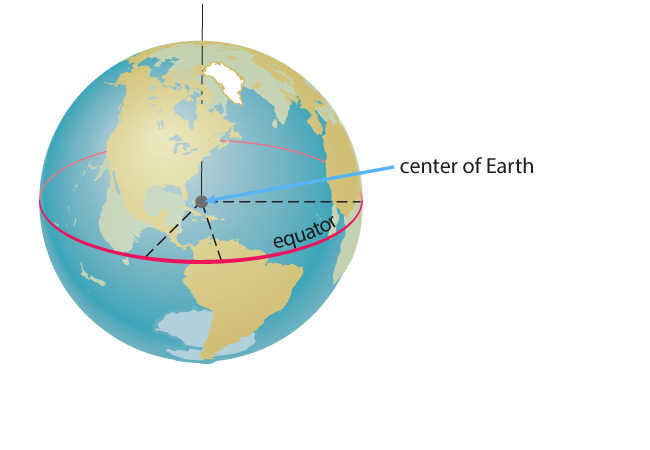
- Is the equator a great circle?
Yes. As shown in the following diagram, the equator is a circle and its center is at the center of the Earth.
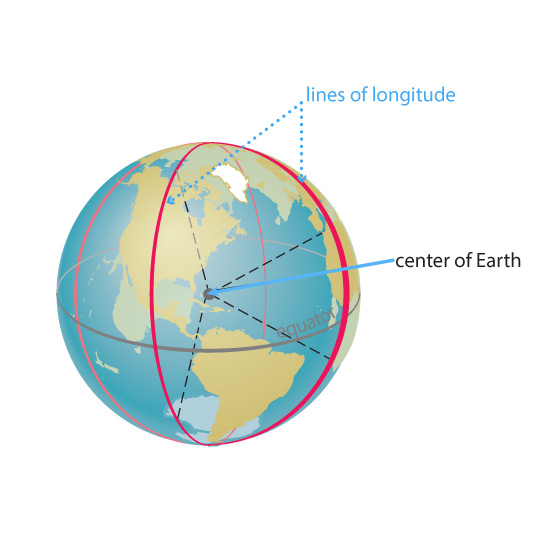
- Do lines of longitude follow great circles?
Yes. Recall that lines of longitude connect the North and South poles. As shown in the following diagram, all lines of longitude therefore represent half of a full circle with its center at the center of the Earth.
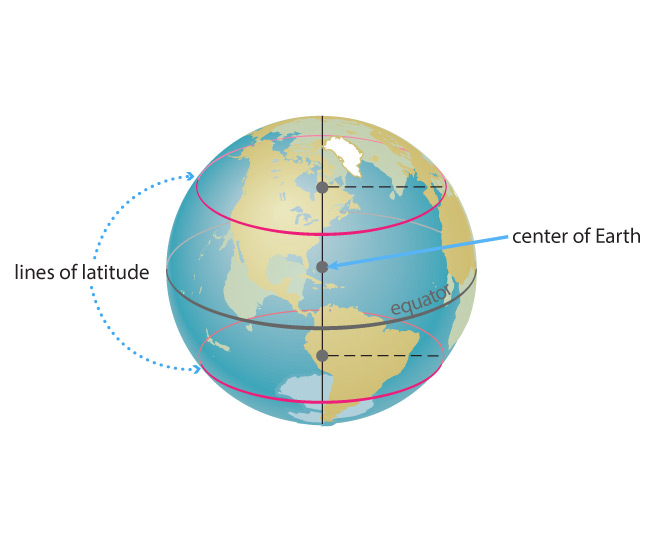
- Do lines of latitude (aside from the equator) follow great circles?
No. Recall that the equator is latitude 0°, and all other latitudes follow circles that are parallel to the equator. As shown in the following diagram, this means that the equator is the only circle of latitude that is a great circle. All other latitude circles have their centers along Earth’s axis, but not exactly at the center of the Earth.
- How do your answers explain why the shortest path between two cities is not generally a straight line on a flat map?
Because the shortest path is always a great circle route, which represents the “straightest possible” route along Earth’s surface, this path will generally be distorted into a non-straight shape when it is projected onto a flat map. (The exceptions are shortest paths that follow great circles — either the equator or lines of longitude — since these are straight on many flat projections.)
Geography Review
In principle, middle school students should already be familiar with basic world geography. However, surveys show that this is often not the case. We therefore include this subsection to make sure your students have a baseline knowledge of geography and geographical terms. You may skip this subsection if your students already are strong in geography.
Note: Again, if your school covers geography in another class, you might encourage teachers of that class to cover this subsection.
Now that you understand how we represent our planet with globes and maps, the next step in getting a “big picture” view of what Earth looks like involves studying its major features. Because doing this requires that we discuss features by name, let’s take a little time to review a few major features of Earth’s geography.
Continents and Oceans
Let’s start with the continents and oceans. Earth is usually said to have seven continents and five oceans:
- Continents: North America, South America, Europe, Asia, Africa, Australia, Antarctica
- Oceans: Pacific, Atlantic, Indian, Artic, Southern
Try the following quiz to see if you can identify all of these.
Geography Quiz 1 – Continents and Oceans
Open this link: https://online.seterra.com/en/vgp/3188. Check whether you can successfully identify 7 continents and 5 oceans.
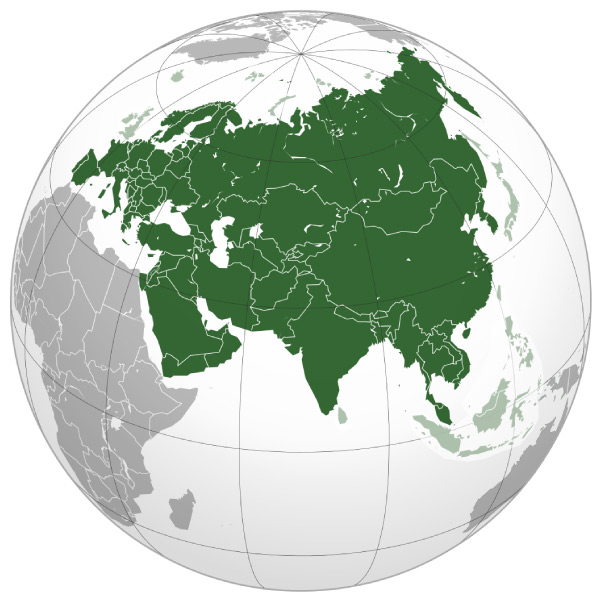
You’ve probably recognized that there is some ambiguity in how we define individual continents and oceans. For example, notice that there is no physical separation between Europe and Asia. For that reason, they are often considered to both be part of a single continent, called Eurasia (Figure 4.7). If we think in terms of Eurasia (rather Europe and Asia individually), then Earth has only 6 continents rather than 7.
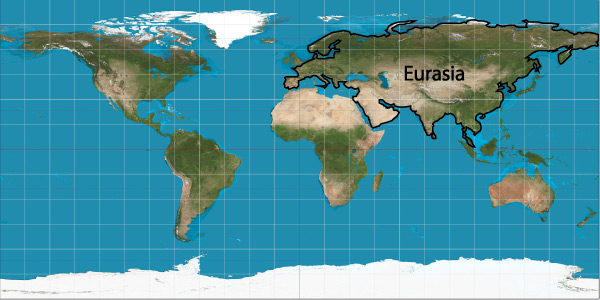
Figure 4.7 - Europe and Asia are both part of the same single land mass. For that reason, they are together often considered to represent the continent of Eurasia, rather than two separate continents Europe and Asia. In this case, Earth has 6 continents (rather than 7): Eurasia, North America, South America, Africa, Australia, Antarctica. Be sure you can identity all of their locations on the map.
Claim-Evidence-Reasoning Activity
Continents and Oceans
Work in small groups to explore a globe. Then use evidence and reasoning to support or refute the following claims.
Claim 1: It is reasonable to consider Africa and Eurasia as representing a single “Afro-Eurasia” continent, rather than 2 (or 3) separate continents.
Claim 2: It is also reasonable to consider North America and South America as a single continent, in which case Earth has only 4 continents: Americas, Afro-Eurasia, Australia, Antarctica.
Claim 3: It is reasonable to say that Earth has only a single ocean, rather than 5 separate oceans.
Claim 4: It is reasonable to categorize Australia and Antarctica as “island continents,” somewhat different in character from the other continents.
Claim 5: It is reasonable to say that aside from Australia and Antarctica, no other islands are large enough to also be considered continents.
Claim 6: There is no absolute answer to the question of how many continents and how many oceans are found on Earth.
Discuss: Could you have done this activity using flat maps rather than a globe? Why or why not?
This CER activity can be done either with a physical globe or an interactive digital globe; it should not be done with flat maps (because of the distortion; see discussion question at end of activity). Notes on the individual parts of this activity.
- Claim 1: This is very subjective, so different students may answer differently; the important point is for students to use evidence and reasoning effectively in making their case. On the “yes” side, students can point out that Africa and Eurasia are connected by the Sinai Peninsula (where Israel and Egypt meet), which means it is possible to travel by land throughout Africa and Eurasia. On the “no” side, they might argue that the connection is too tenuous. Some may even point out that the human-made Suez canal now makes a separation between the land masses, even if it did not exist naturally.
- Claim 2: In a similar way to the first claim, the “yes” argument will be based on the fact that North and South America are connected by Central America, while the “no” argument would be based on how relatively thin the connection is. Again, some students may also point to the separation created by the human-made Panama Canal.
- Claim 3: Students should see that the “5 oceans” are in fact all connected, so it would be difficult to argue against this claim.
- Claim 4: This one is very subjective. Students should notice that from a size standpoint, Australia and Antarctica do indeed look like “large islands,” making the “island continent” category reasonable. However, students might also argue that this distinction doesn’t make sense, because the Americas and Afro-Eurasia could also be considered very large islands. Again, since different viewpoints are defensible, the key is to make sure students explain the evidence and reasoning behind whether they support or refute the claim.
- Claim 5: This is another very subjective question. Students should notice that, on a globe, you can see that Australia and Antarctica are considerably larger than any other islands. That said, they should recognize that it might be possible to make a “continent” case for other moderately large islands, such as Greenland, New Guinea, Borneo, or Madagascar (which are the next four largest islands, respectively, after Antarctica and Australia).
- Claim 6: By this point, students should be able to clearly defend this claim, since it is true. Note that we’ll emphasize this idea in the Key Concept s box that comes shortly.
- Discussion Question: Students should recognize that because they needed to compare sizes of land masses around the world, flat maps would create too much distortion, making this activity doable only on a globe.
Other Bodies of Water
If you study a globe or map, you’ll find many regions of water labeled with names besides “ocean,” such as seas, gulfs, bays, lakes, and rivers. Let’s start by making sure you can find and recognize some of best-known of these regions.
Geography Quiz 2 – Seas, Gulfs, Bays, Lakes, Rivers
- Open this link: Quiz: Seas, Gulfs, Bays, Lakes, Rivers. Identify the following regions of water: Amazon River, Black Sea, Caribbean Sea, Caspian Sea, the Great Lakes, Gulf of Mexico, Hudson Bay, Lake Victoria, Mediterranean Sea, Mississippi River, Nile River, Persian Gulf, Red Sea.
- Using a globe or map, identify at least 3 other “seas” (don’t include ones that you already identified in question 1).
- Using a globe or map, identify at least 1 other “gulf,” 1 other “bay,” 1 other “lake,” and 1 other “river.”
As you’ve probably recognized from the quiz, there are no hard and fast rules that determine what kind of water region should get what kind of name. Nevertheless, here are a few guidelines you may have noticed:
- The term river is the easiest of these terms to define, since it refers to a long and fairly narrow channel of water that flows across the land. The main difficulty in deciding what counts as a “river” is that smaller “rivers” are usually instead called streams or creeks. Most rivers flow to the ocean, though some flow into lakes or into another river.
- The term lake is used only for inland bodies of water; lakes usually have water flowing into or out of them through streams or rivers. Most lakes contain fresh water rather than salt water, though there are some exceptions, such as the Great Salt Lake in Utah (USA). The main difficulty in deciding what counts as a “lake” lies in size, because a very small “lake” is generally called a pond instead of a lake.
- The term sea is most commonly used for regions of water that are connected to an ocean but that look somewhat separate because of the land masses around them. For example, the Mediterranean Sea is connected to the Atlantic Ocean, but only by a fairly narrow passage (called the Strait of Gibraltar) between the countries of Spain and Morocco. Unfortunately, while this is the most common way of defining a “sea,” this definition is not always applied in a consistent way. For example:
- Some regions that fit the common definition of “sea” are called something else; in quiz question 1 (above), you may have noticed that Hudson Bay, the Gulf of Mexico, and the Persian Gulf could all have equally well been called “seas.”
- Some inland bodies of water are called seas, even though they should more technically be called lakes. The Caspian Sea is an example, since it is landlocked on all sides.
- Sometimes the term “sea” is applied to the oceans. For example, “sailing the seas” can mean sailing on an ocean, and the “law of the sea” is the set of international rules that govern human activity on the oceans.
- The terms gulf and bay are really just alternative terms for a sea, though they often (but not always) are used for smaller regions that have the shape of indentations along a coastline. Notice, for example, that the Gulf of Mexico and the Caribbean Sea are not so different in size, even though one is called a gulf and the other a sea.
Discussion
Local Water
In small groups or as a class, identify the names of bodies of water that are located near you. Then discuss whether you think that these bodies are appropriately named. For example, if you live near a “bay,” decide whether the term is appropriate or if you think it should have been called a gulf or a sea; if you live near a “river,” do you agree that it should be called a river rather than a stream or creek?
This can be a very brief discussion. The key points are: (1) students should know the names of nearby bodies of water, so that you can discuss them further as the course progresses; (2) students should further build their understanding of the common definitions and ambiguities in the way we name bodies of water.
To summarize, we categorize bodies of water with many different names, but those names are not always used with perfectly consistent definitions. Moreover, nature often presents us with ambiguous cases, such as what counts as a lake versus what counts as a pond. As you continue to learn about science, you’ll find many other cases where our human attempts at classification run into limitations imposed by nature. Classification is still very useful, but it is the most useful when you also remember its ambiguities and limitations.
Key Concepts: Classification and Nature
We humans find it useful to classify natural objects into different categories (or classes) because it can help us understand general patterns and rules in nature. However, nature is not bound by our human classifications. As a result, the boundaries between different categories are often fuzzy, and real objects may sometimes be legitimately classified in more than one way.
Discussion
Planetary Classification
There are many other cases in which our attempts to classify things in science run into similar issues of fuzzy category boundaries. One well-known example concerns the definition of a “planet,” and in particular whether Pluto (and other similar worlds) should be considered a “planet” or a “dwarf planet.” How is the question of whether Pluto should be a “planet” or a “dwarf planet” similar to the question of whether a flowing body of water should be considered a river, stream, or creek? Do you think the official designation of Pluto as a “dwarf planet” makes sense? Why or why not? Can you think of other cases in science where classification is useful but still leads to some ambiguities or fuzzy category boundaries? Note: You may wish to review the definition of dwarf planets in Section 1.1.3.
This discussion is optional but can be interesting for students. Notes:
- In the case of Pluto, be sure your students review Chapter 1, where we discussed why Pluto is considered a dwarf planet. The similarity is that the “dwarf planet” designation relies largely on size: If Pluto were, say, as large as Earth, we’d very likely still consider it a “planet.” In that sense, deciding what is a planet versus a dwarf planet is rather like deciding what is a river and what is a stream.
Note: There’s a technical subtlety to this: According to the official definition adopted by the International Astronomical Union, another requirement of being a planet (besides being round and orbiting a star) is that an object have “cleared the neighborhood” around its orbit. Therefore, it is the fact that Pluto shares its orbital neighborhood with many other objects (the objects of the Kuiper belt) that officially precludes Pluto from being a planet. However, most scientists would argue that the “clearing the neighborhood” criterion was adopted only to give some logical basis to cutting off Pluto, Ceres, Eris, and other similar-size objects, and there is a real question as to what we would do if we someday discovered an object as large as Earth in the outer solar system. (Moreover, the “clearing the neighborhood” criterion is itself ambiguous, since there are at least some asteroids and comets that cross the orbital paths of all the planets in the solar system, including Earth.) - For other cases in science, your students may come up with a number of possibilities, so use judgment in deciding how far to let this discussion go. Examples might include hill versus mountain; fruit versus vegetable; and many more. One particularly interesting question that you might want to discuss concerns whether a virus should be considered “living” or “nonliving.”
Mountain Ranges
Some maps and globes represent the elevation of land (often called topography ) with different shading or relief . If you study such a map or globe, you will see that most mountains are not scattered randomly about the Earth. Instead, they are grouped together into long and relatively narrow mountain ranges.
There are dozens of named mountain ranges around the world. Try the next quiz to see if you can identify 6 of the best-known mountain ranges.
Geography Quiz 3 – Mountain Ranges
Open this link: Quiz: Mountain Ranges. Check whether you can successfully identify the following mountain ranges: the Alps, the Andes, the Appalachians, the Himalayas, the Rocky Mountains, the Urals.
Discussion
Local Mountains
In small groups or as a class, identify the names of the mountains that are located near you. Are they part of a mountain range? If so, which one? Then, based on what you have learned in the past or clues you may find on maps, briefly discuss how your nearby mountain range or isolated mountains may have formed.
This brief discussion has two main purposes: (1) to make sure students know the names of nearby mountains and whether they are part of a larger range; and (2) to help set the stage for later discussions of how mountains are made. A few notes:
- In some locations (e.g., Florida), you may not have any nearby mountains. In that case, you should still have students identify the nearest mountains, even if they are a fair distance away.
- There may be some ambiguity in what is called a “mountain.” For example, there are many places around the world where a small hill gets called a “mountain.” In such cases, try to have students discuss whether the term “mountain” is appropriate, and also look for the nearest more significant mountains.
- Because we will discuss the origin of mountains and mountain ranges later (in chapter 5), before holding this discussion you should research for yourself the origin of your nearby mountains. You can then steer the discussion about possible origins in a direction that will help prepare students for what they will learn later.
More to Know
There are tens of thousands of named places, regions, and features on our planet. It’s doubtful that there is any one person who knows them all, and even geography experts rarely know more than a couple thousand. Fortunately, if you need to find a named place, you can always find it by looking it up on a map.
That said, the more places you can name and locate, the easier you will find it to succeed in many different subjects, from Earth science to politics and international relations. You should therefore strive to learn as much geography as you can. To help get you started, try the following quiz that focuses on a few of the named places that we will be discussing in the rest of this book. After you complete the quiz, try the questions that follow.
Geography Quiz 4 – Build Your Knowledge
Open this link: Build Your Knowledge – Geography Quiz. Check whether you can successfully identify the following places or regions, chosen because they are places that will come up as you read the rest of this book: Alaska, the Arabian Peninsula, the Gobi desert, the Middle East, Hawaii, the Iberian Peninsula (Spain and Portugal), the Indian subcontinent, the Indonesian archipelago, Japan, the Mojave desert, New Zealand, Patagonia, the Sahara desert, Siberia, South Africa.
Discuss these questions with a classmate, then click to open the answers and see if they agree with what you came up with.
- Why do you think the Indian subcontinent is called a “subcontinent”?
The Indian subcontinent consists of the country of India and a few neighbors (including Pakistan and Bangladesh). It is called a “subcontinent” because it looks like it is a small continent that is attached to the rest of Eurasia; this is especially true when you notice that the Indian subcontinent is separated from the rest of Eurasia by the Himalayas, which are the tallest mountains in the world. In fact, as we’ll discuss in Chapter 5, the Indian subcontinent was once separate from the rest of Eurasia, and the Himalayas are so tall because they represent the collision of this subcontinent into Eurasia.
- Why do you think the Middle East is called “Middle”?
In this case, the term “Middle” comes from the fact that the Middle East is essentially in the “middle” of three continents: Africa, Europe, and Asia. It has therefore been very important in human history, because it has been a crossroads where people of many ethnicities, religions, and cultures have all met.
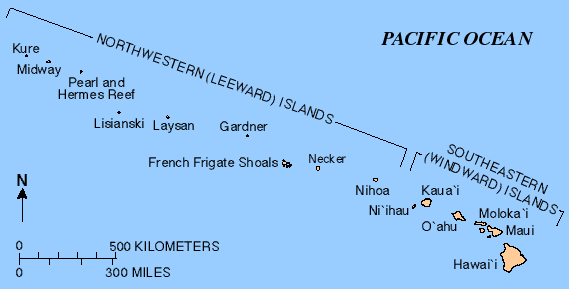
- In what sense is Hawaii a “chain” of islands?
As you can see on the map below, the Hawaiian islands stretch across a large length of the Pacific ocean much like a chain of beads. Notice that they extend quite far to the northwest beyond the seven “windward” islands that represent nearly all the population of the state of Hawaii.
- What is the Indonesian “archipelago”?
An archipelago is a group of many islands. The Indonesian archipelago is made up of more than 17,000 islands, most (but not all) of which belong to the country of Indonesia. It is the largest collection of islands in the world.
- Which of the places you identified in the quiz are states of the United States? Which are individual nations?
Alaska and Hawaii are states of the United States. Japan, Brazil, and South Africa are individual nations. Note: As already discussed, the Indian subcontinent is mostly but not entirely, the nation of India, and the Indonesian archipelago is mostly but not entirely the nation of Indonesia.
- In what countries does the Gobi desert lie? What about Patagonia?
The Gobi desert straddles China and Mongolia. Patagonia lies at the southern end of South America, straddling southern Chile and Argentina.
Journal Entry
Where Will You Go?
Choose at least three places around the world that you have heard of and that you would like to visit someday. These can be places of any type; that is, you can choose a city, a famous building, a natural wonder, or anything else. In your journal write down the names of the places and draw or paste a map showing where they are located. Then, for each one, write a few sentences about why you would like to visit it, and how you would have to travel to get there (for example, could you get there by car or bus or train, or would you need a ship or airplane flight?).
Optional: Open Google Earth (in the Chrome browser) and take virtual tours of the places you’ve chosen, then write a few sentences about what you learned from each tour.
This journal entry will hopefully inspire students to learn a little more geography as they think about the places they’d like to visit in the context of the geography we’ve reviewed in the rest of this section. The optional Google Earth tours can be a lot of fun.
Activity
Geography Game
Divide your class into teams of 4 or 5 students. Each team should have some kind of buzzer or whistle that you can use to announce that you think you know an answer. Your teacher will call out geography questions (or answers, if you are playing “Jeopardy style”), and whichever team hits their buzzer (or whistle) first then has 5 seconds to answer the question. If they get it correct, they get 1 point. If they get it incorrect, then the teacher will ask if anyone else wants to try (again selecting whoever buzzes first). The team with the most points is the winner.
This optional game will give your students a change to practice their geography skills. There are many possible formats for this game, and you can find some geography games online. However, for our purposes, we recommend a game in which you point at various places/features on a projected image of a globe or map, and ask students to name them. You should focus on the places/features that students have learned in this subsection, so that you will be reinforcing their knowledge of these.
Major Features of the Earth
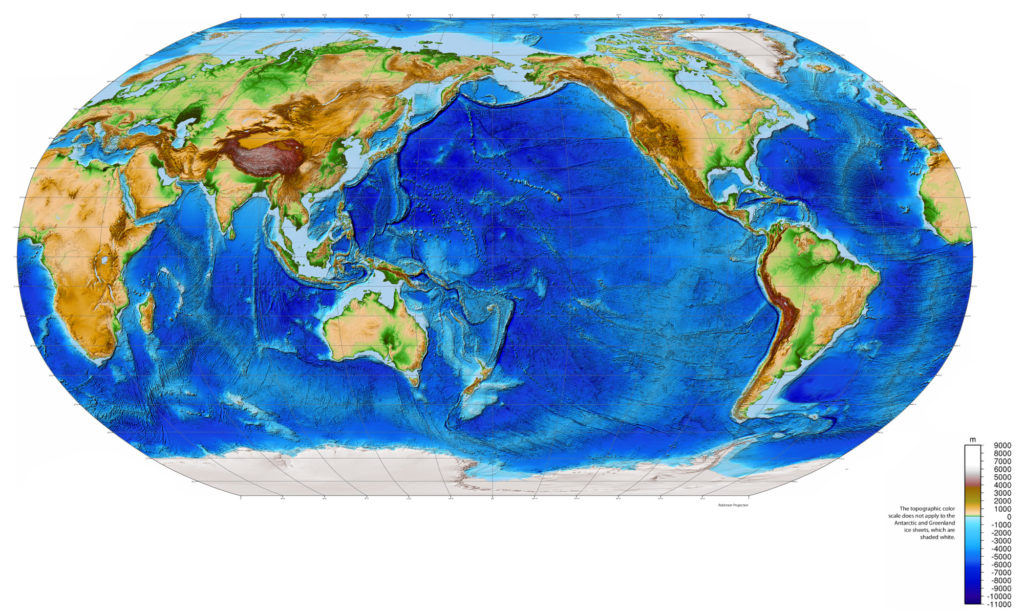
We are now ready to explore major features of our planet Earth. One of the best ways to begin is to view a map that shows Earth’s topography , as on a relief globe or color-coded elevation map. The main challenge is deciding how to show the oceans and ice sheets. Should we view their surfaces, or the underlying seafloor or bedrock? There is no single “best” way to do this, but Slideshow 4.8 shows a common approach:
- For the oceans, the seafloor depth is represented with color-coded blues.
- For land, elevation is represented with color-coded shades that start from green near sea level and go to tan, brown, red, and then white for the tallest mountain peaks.
- The Greenland and Antarctic ice sheets are simply shown in white; that is, ice elevations are not represented.

Slide 1 - This global relief map shows both seafloor depths and land elevation in an equirectangular projection. Credit: National Oceanic and Atmospheric Administration (NOAA).


Slideshow 4.8 – These maps and globes show seafloor depth with shaded blues and land elevations with other colors.
(The colors do not apply to the Greenland and Antarctic ice sheets, which are simply shown in white.) They all show the same
data, but use different map styles. Depending on what you are focusing on, some map styles will be more useful than others.
You should spend some time exploring the maps in the slide show. The try the following activity to make sure you understand how to interpret them.
Activity
Understanding the Global Relief Map
Work in pairs or small groups to answer the following questions as you study the maps in Slideshow 4.8. You may need to choose different maps for different questions. In some cases it will be helpful to zoom in to see details more clearly. You may also need to review any geographical names that you are not familiar with.
- How can you tell the difference on these maps between an island and an underwater seamount (a mountain rising up from the ocean floor that does not reach the ocean surface)?
- Find the world’s tallest mountains.
- Find the mid-Atlantic ridge, which is a long chain of underwater volcanoes in the Atlantic Ocean.
- Find the Peru-Chile trench , which is a region where the ocean is extremely deep near the coast of South America.
- A continental shelf is a region of relatively shallow ocean that extends out from the edge of a continent. Identify a region of continental shelf that runs along the coast of South America.
- Find California’s Central Valley, which is a long valley that is surrounded by mountain ranges (the “coastal range” to its west and the Sierra Nevada to its east). Hint: California (USA) is on the west coast of North America.
- Find the East African rift valley, a long narrow valley that looks almost like it is splitting the African continent apart. Hint: It connects to the Red Sea.
- Optional: Find all the features above (from questions 2 through 7) in Google Earth. Do you see any advantages (or disadvantages) to studying the features on the Google Earth globe compared to the maps in the Slide Show?
This activity will help ensure that your students understand how to read the relief maps, which is very important to looking for patterns as we’ll discuss in the next subsection. Note that this activity also introduces students to a few common geographical terms, including seamount, trench, continental shelf, and rift valley.
- Question 1: This first question should be the easiest. Students simply need to recognize that if the color is a shade of blue, then the seamount is underwater. Islands have colors corresponding to the land colors used on the map.
- The remaining questions require students to identify features visible on the relief maps. In principle, students who have completed the geography review in the prior subsection should be able to answer all of these questions. However, if students are still weak in their geographical knowledge (e.g., recognizing the different continents and oceans, or the Red Sea for question 7), you should encourage them to look at a globe and find the features for themselves, rather than pointing them out, since that will help reinforce their geographical knowledge. You can click here to see the features that students are identifying in this activity.
- Question 8 is for students who have already been using Google Earth. You should encourage students to find the features by exploring the interactive planet, rather than by typing the names into the search box (which makes it too easy). Students should recognize that the main advantages of Google Earth over the flat maps are that they can explore the features in much more detail. A potential disadvantage is that as you zoom in, you can lose sight of the bigger picture of how these features fit into the global system.
Note: If you are using Google Earth, you may wish to project it in the front of the classroom and help students find all the features.
We started this section (Section 4.1.1) with the question “What does Earth looks like from the outside?” At this point, we’ve answered this question in three basic ways:
- In Figure 4.1, we’ve seen what Earth looks like as viewed from space, where we see the ocean surface and clouds, as well as the land as it really appears.
- In Figure 4.4 (and other figures that use the same map), we’ve seen what Earth’s surface would look like in approximately true colors without any clouds.
- In Slide Show 4.8, we’ve seen an elevation map of Earth, including seafloor depth.
For most purposes, these views answer our basic question of what Earth looks like from the outside. Before we move on, however, it’s worth examining these views in a little more detail, because they reveal patterns that will be important to us as we continue our work.
Geographical Patterns
One of the primary goals of Earth science is to understand how and why our planet has come to look like it does. A first step in reaching this goal is to recognize that the geographical features of our planet are not random, but instead reveal certain patterns that science must seek to explain.
You may have already begun to recognize some patterns as you’ve studied. To help you see some of the most important patterns, try the following questions. You can in principle answer them by carefully studying any globe or map that shows relief clearly, but it will be easiest if you refer to the map below (repeated from Slide Show 4.8), which allows you to see the entire Earth at once and is centered on the Pacific Ocean.
While we suggest below that students work on these questions in pairs, you can alternatively have students work in bigger groups or even as an entire class. But we urge you to spend some time on them, since seeing these patterns for themselves will greatly help students understand the big picture of Earth science and what it is all about. Note: Be sure to keep the focus on the patterns; students should not feel any need to memorize the names of the geographical locations, though some may want to learn them or may already know them.
Discuss the following questions with a classmate. Then click to open the answers to see if they agree with what you came up with.
- Are islands distributed randomly around the world, or do you see some pattern?
Islands are not distributed randomly. Instead, most islands are grouped into archipelagos that take the shapes of long chains or vast island arcs . Figure 4.9 labels some of the most prominent groupings of islands that are easy to see on this map. Note that some of them are connected to each other, but have distinct names because of how they were recognized in history.
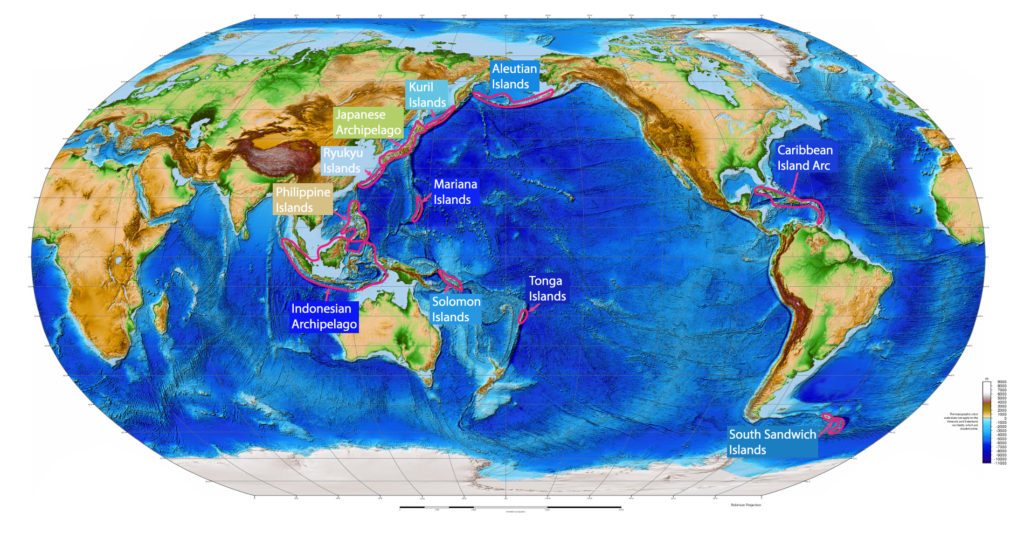
Figure 4.9 – A few major island chains and arcs are labeled on this global relief map. Credit: NOAA, Pamela R. Grothe. - Now look on the continents. Are mountains distributed randomly, or do you see some pattern?
Most mountains are clustered into mountain ranges. Moreover, when you look at the global map, you’ll notice that many of the world’s major mountain ranges are grouped together into two vast mountain belts (Figure 4.10).
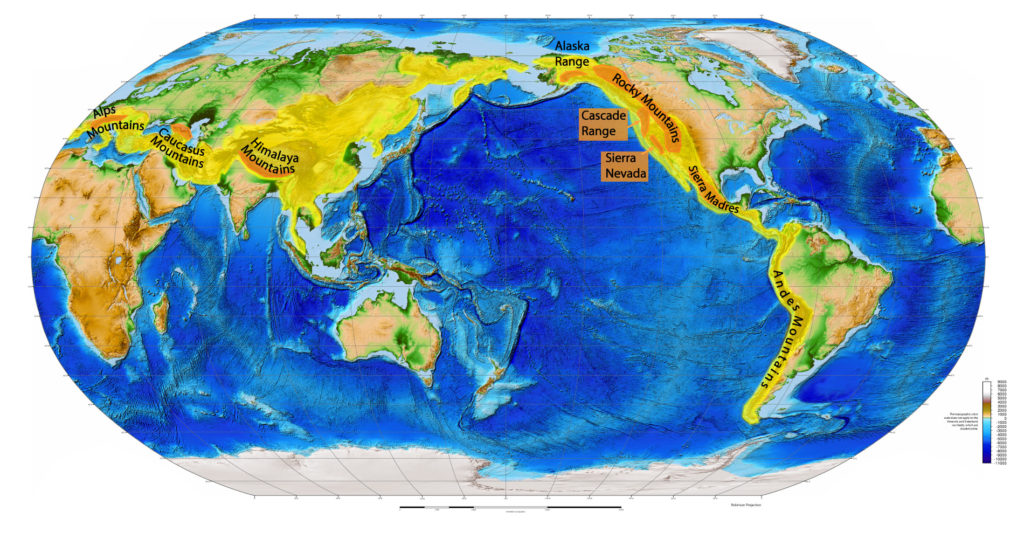
Figure 4.10 – Many of the world’s most prominent mountain ranges are grouped into the two vast mountain belts shown in yellow. One belt is in the Americas and one in Eurasia. Some of the mountain ranges that make up each belt are labeled. Credit: NOAA, Pamela R. Grothe. - Find several of the deepest ocean trenches. Do you notice any connection to the patterns you’ve already identified for islands and mountains?
Figure 4.11 labels some of the major trenches and also shows the island groups and mountain ranges that we’ve already identified. Notice that there is a clear connection: all of the trenches are associated either with an island arc or, in the case of the Peru-Chile trench, with the Andes mountain range.
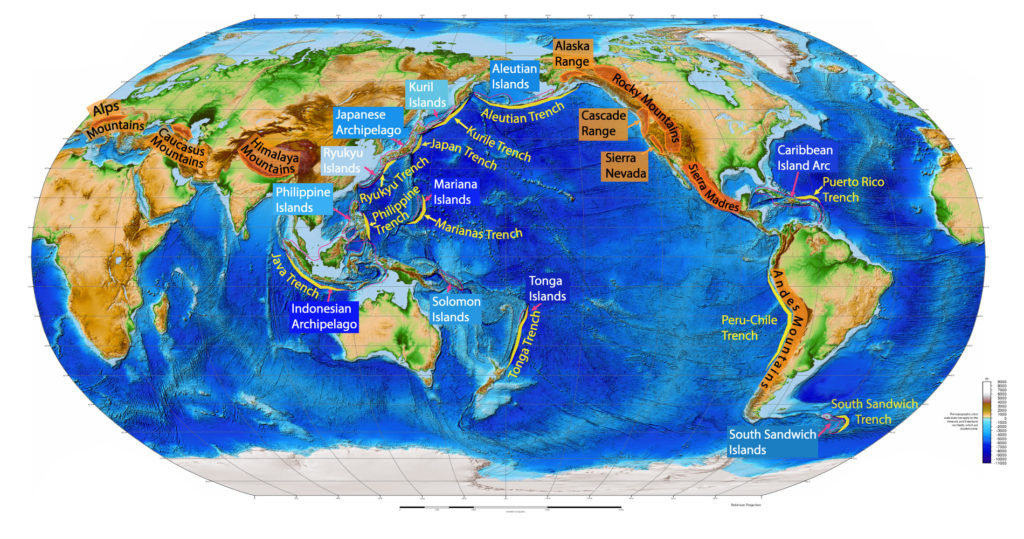
Figure 4.11 – This map shows the same features identified in Figures 4.9 and 4.10, but now adds labels for some of the world’s deepest ocean trenches. Notice the clear correspondence of trenches with island arcs (for example, the Aleutian Trench and Aleutian islands, or the Puerto Rico trench and Caribbean islands) or a coastal mountain range (the Peru-Chile trench and the Andes mountain range). Credit: NOAA, Pamela R. Grothe. - Find the mid-Atlantic ridge, which you already identified in an earlier activity. Now look for other similar ocean ridges. Do you see any connection between them?
All of the oceans have ridges of underwater mountains running through them. While you can see this on the maps you’ve been studying above, it’s even easier to see in Figure 4.12, which is a hand-painted map made from the work of Marie Tharp (1920-2006), who was the first person to carefully map the ocean floor. Note that the ridges are connected: If you start at the top of the mid-Atlantic ridge and trace along it, you can connect to points along all the other major ridges. This makes the global mid-ocean ridge system the longest connected chain of mountains in the world, stretching a total length of nearly 65,000 kilometers.
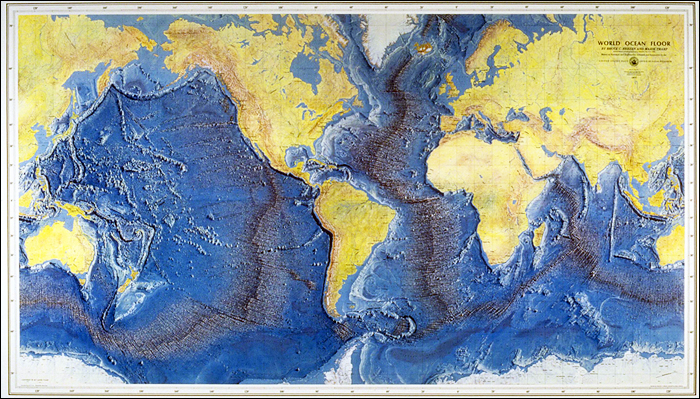
Figure 4.12 – This hand-painted map makes it easier to see the global ocean ridge system, which stretches a total length of nearly 65,000 kilometers. Credit: Painting by Henirich Berann based on the work of Marie Tharp and Bruce Heezen.
To summarize, when we study Earth as a whole, we see many patterns that beg for explanation. So far, we’ve explored just a few patterns of geography, but as we study our planet more deeply, we’ll see many other patterns, such as patterns of earthquakes and volcanoes, patterns of weather and climate, and patterns of life and ecosystems. In the coming chapters, you will see how scientists have used these patterns as clues that have enabled us to gain a deep understanding of how our planet works. As you will learn, this understanding has been crucial to the development of our modern civilization, and also holds important lessons for our future survival and prosperity.
Key Concepts: Patterns and Earth Science
Careful study of our planet reveals numerous patterns that are clearly not random. These patterns must therefore hold clues to how our planet works and how it has developed through time. Earth science seeks to understand and explain these patterns and the lessons they hold for our future.
Activity
Marie Tharp
The discussion about ocean ridges (above) notes that the first scientific mapping of the ocean floors was conducted by a woman named Marie Tharp. She did this work at a time when women had very few opportunities in science, and her work proved crucial to developing the theory of plate tectonics, through which we now understand the patterns we see around the world. Working in small groups, do the following:
- Do a web search for articles about Tharp and her work. Each member of the group should read one article carefully. Be sure that each person reads a different article.
- Then, as a group, discuss the following questions:
- How did Marie Tharp come to be a geologist?
- When did she begin doing her mapping work, and how did she do it?
- Why were her discoveries so important to scientific understanding about how the Earth works?
- Do you think the fact that she was a woman made it more difficult for her to do her work? Do you see any evidence that she faced discrimination?
- Do you think she was given appropriate credit for her work? Why or why not?
This is a web research activity that focuses on an important but under-recognized woman scientist. Notes:
- If you can work with a colleague teaching social studies, you might suggest having this activity done in that class, where the teacher could put it into a more general context of women’s rights and discrimination.
- Students should be able to engage in discussion on all the questions based on what they read, but of course this makes it important that they find good sources and read carefully. It’s worth noting that her discoveries were initially dismissed as “girl talk.”
- If you or your students want to learn much more about Marie Tharp, see the book Soundings: The Story of the Remarkable Woman Who Mapped the Ocean Floor, by Hali Felt (Henry Holt, 2012).