What comes to mind when you hear about a change in the weather? What comes to mind when you hear about a change in the climate? If you think about these questions, you’ll realize that although the two words are closely related, there is an important difference in their meanings:
- Weather refers to the ever-varying combination of such things as winds, clouds, temperature, and pressure that makes some days hotter or cooler, clearer or cloudier, or calmer or stormier than others.
- Climate refers to the average of weather over many years. For example, we say that a desert has a warm, dry climate, even though it may sometimes rain or snow.
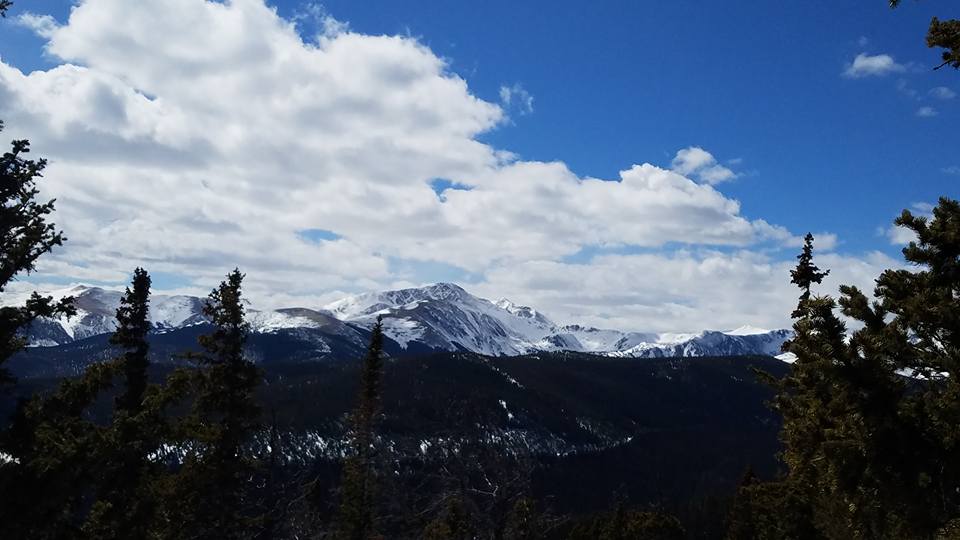
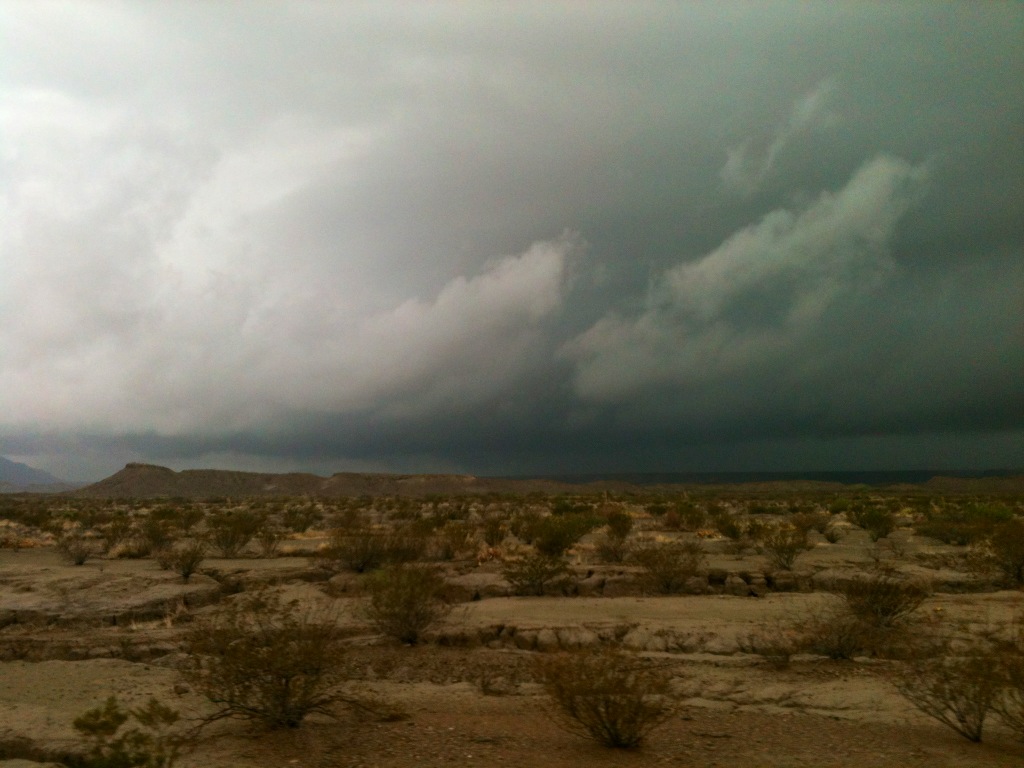
Figure 6.3.1–1 shows a simple example of this distinction. The weather is cloudy and rainy on the day the photo was taken, but the landscape shows that you are looking at a desert. In other words, the weather in this location will differ from day to day, but on average the region is dry enough to be a desert.
In this section, we’ll briefly discuss the different types of weather and climate that you might find around the world. We’ll then study climate and weather in more detail in the sections that follow.
By the way, while we won’t use the term much in this book, the scientific field that deals with weather and climate is often called meteorology , which is why weather forecasters are often known as meteorologists.
Discussion
Weather or Climate?
Work in pairs or small groups. Each of the following sentences contains one or more blanks that can be filled in either with the word weather or climate. Decide which word belongs in each blank, and explain why.
- Today’s _________ is much sunnier and more pleasant than it was yesterday.
- Our spring season often has extreme ________ events such as tornados.
- “Global warming” refers to the fact that Earth’s overall ________ is changing in a way that makes average temperatures warmer.
- Evaporative cooling devices (sometimes called “swamp coolers”) work better in places that have a dry ________.
- We took a trip to a place where it rains so much that it is considered to have a rainforest ________, but every day of our trip we had sunny ________.
- Come up with at least two more sentences of your own that illustrate the difference between the terms weather and climate.
This brief discussion will help ensure that your students understand the distinction between the terms weather and climate.
- You can do this one in a variety of ways, but we suggest having students first pair up to discuss each question, then come together as a class to be sure everyone understands the correct answers.
- Answers: (1) weather. (2) weather. (3) climate. (4) climate. (5) climate, weather.
Discussion
Weather and Climate Predictability
Pick a future date that is at least 6 months away, then consider the following two questions:
- Can you predict what your local weather will be on that date?
- Can you predict what your local climate will be on that date?
Based on your answers, discuss what this tells you about the predictability of weather compared to that of climate.
We recommend doing this discussion as a class, as it will help set the stage for our discussions of weather prediction in Section 6.3.3 and of climate change in Chapter 7 by introducing students to the important idea that climate is more predictable than weather.
- At this point in the text, we only expect students to understand the basic answer, which is that the weather is impossible to predict 6 months out, but the climate is very predictable, because it remains nearly the same from year to year. Note that even with climate change, the change is occurring over many years and is difficult to notice in just a few years.
- If you wish to get into a little more detail, you can help students recognize that the basic reason is straightforward: climate is a long-term average of weather, and it is always easier to predict averages than individual events. Note that we’ll discuss this idea further toward the end of Section 6.3.3.
- If you want to go into more detail on this idea, see the Chapter 7 CER Activity “How can global warming be so simple when climate is so complex?,” which uses coin tossing to show why averages are more predictable than individual events. We placed the activity in Chapter 7 because of its importance to understanding climate change, but you could easily use it here (or in Section 6.3.3) instead.
Connections—Etymology
Meteors and Meteorology
Somewhat strangely, meteors and meteorology have very little to do with each other. The science of meteorology focuses on weather and climate, while meteors (sometimes called “shooting stars”) are simply flashes of light created by space pebbles or rocks burning up in the atmosphere (see this I was Wondering box). Meteors generally have no effect on weather or climate, except in the extremely rare cases in Earth’s history when a “meteor” was large enough to cause a major impact. (Recall from Section 5.4.2 that a major impact is linked to the extinction of the dinosaurs.)
Why, then, do meteors and meteorology sound so similar? The answer is in their etymological roots. Both words come from the Greek word meteoron, which basically translates to “of the atmosphere.” You can now see how the words ended up so similar despite their very different meanings:
- For meteor: We see meteors as flashes of light is in our atmosphere, which is why their name indicates they are “of the atmosphere.” Keep in mind that they got this name in ancient times, when people did not yet know that they are caused by pebbles or rocks from space.
- For meteorology, recall that the suffix ology means “the study of,” so meteorology is literally the study of the atmosphere.
Describing Weather
Think about the kinds of words you might use to describe today’s weather , or what you might hear if you listen to a television weather report. Some of the words might be subjective, like “pleasant” or “terrible.” But a full weather report usually includes words to describe each of the following:
- temperature, which we usually measure in degrees Celsius or Fahrenheit
- wind, which we can describe by its speed and direction
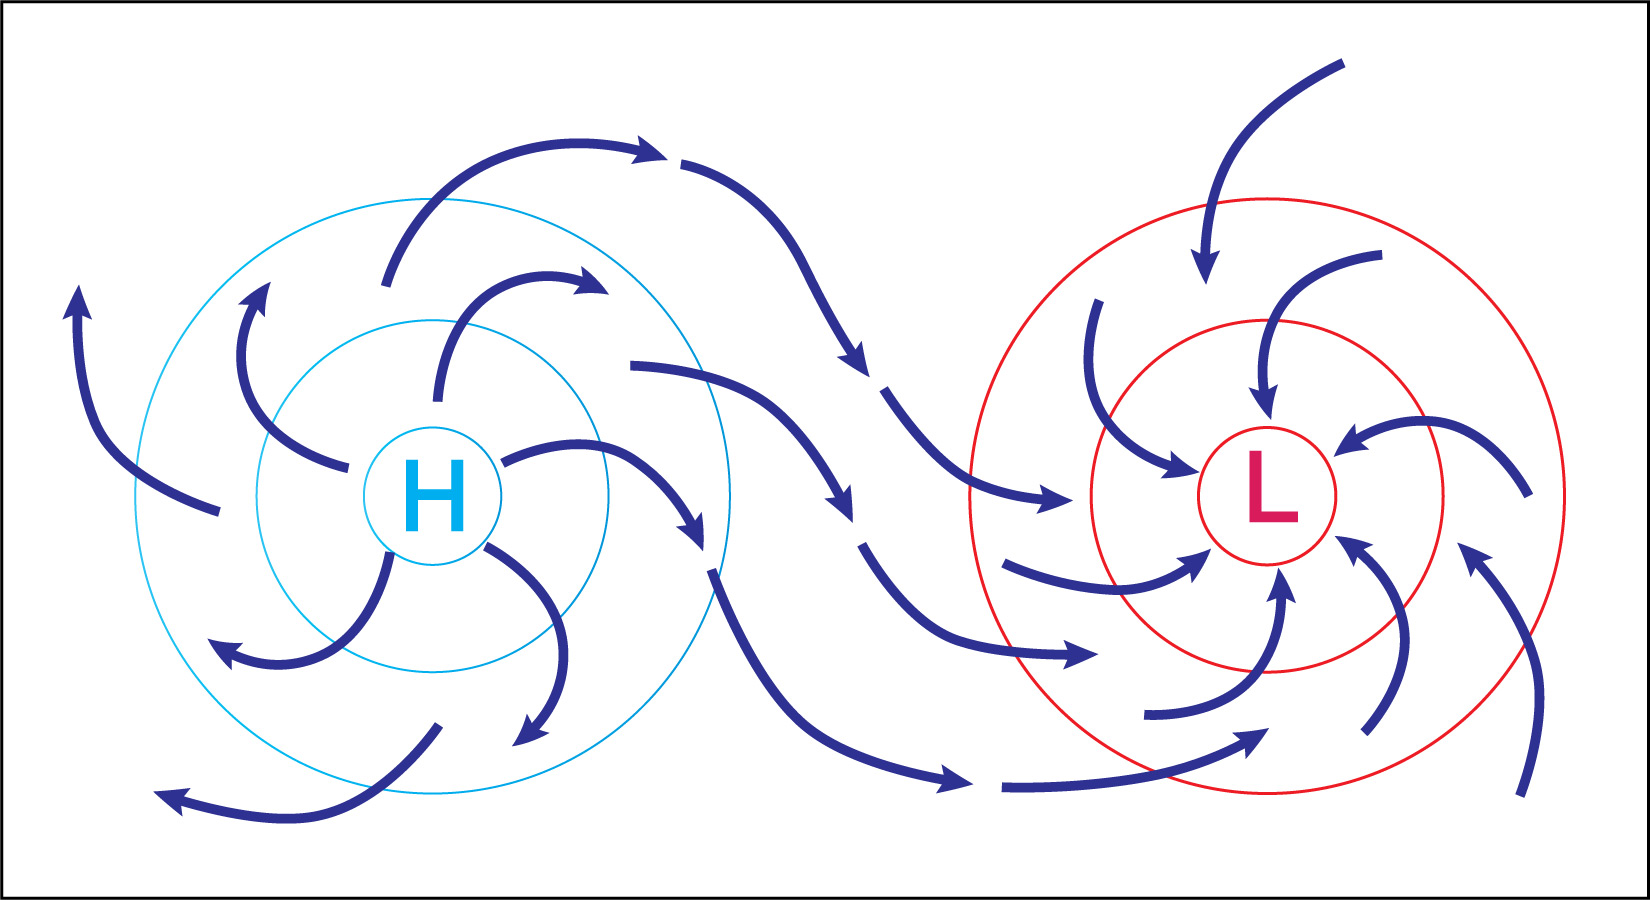
- atmospheric pressure , so that you know whether your local conditions represent high or low pressure compared to their average (review the discussion in Section 6.2.1) and whether the local pressure is rising or falling
- cloudiness, such as how much of the sky is cloud-covered and the types of clouds we see
- humidity , which we commonly use to describe how wet or dry the air feels
- precipitation , by which we mean any water (such as rain or snow) that is falling from the sky
Your life experience has probably given you a good intuitive understanding of each of these concepts. For science, however, we need to be more precise. You’re already familiar with temperature measurement and how winds flow from high to low pressure regions (see Figure 6.2.1–9). We have not yet discussed cloud types, humidity, or precipitation in much detail, so let’s look a little more deeply at each of these.
Clouds can take on an infinite variety of shapes and sizes, which is why our imaginations can run wild as we look up at clouds in the sky. But how do clouds relate to weather?
First, recall that clouds are made of either tiny droplets of liquid water or tiny crystals of ice, and that clouds are visible because of the way these droplets or crystals reflect light (see Figure 6.1.1–15). This tells us one obvious relationship to weather, in that clouds are the source of precipitation like rain or snow.
However, not all clouds lead to precipitation. For example, thin, high clouds are common on sunny days. In fact, generally speaking, only thick, dark clouds are associated with storms.
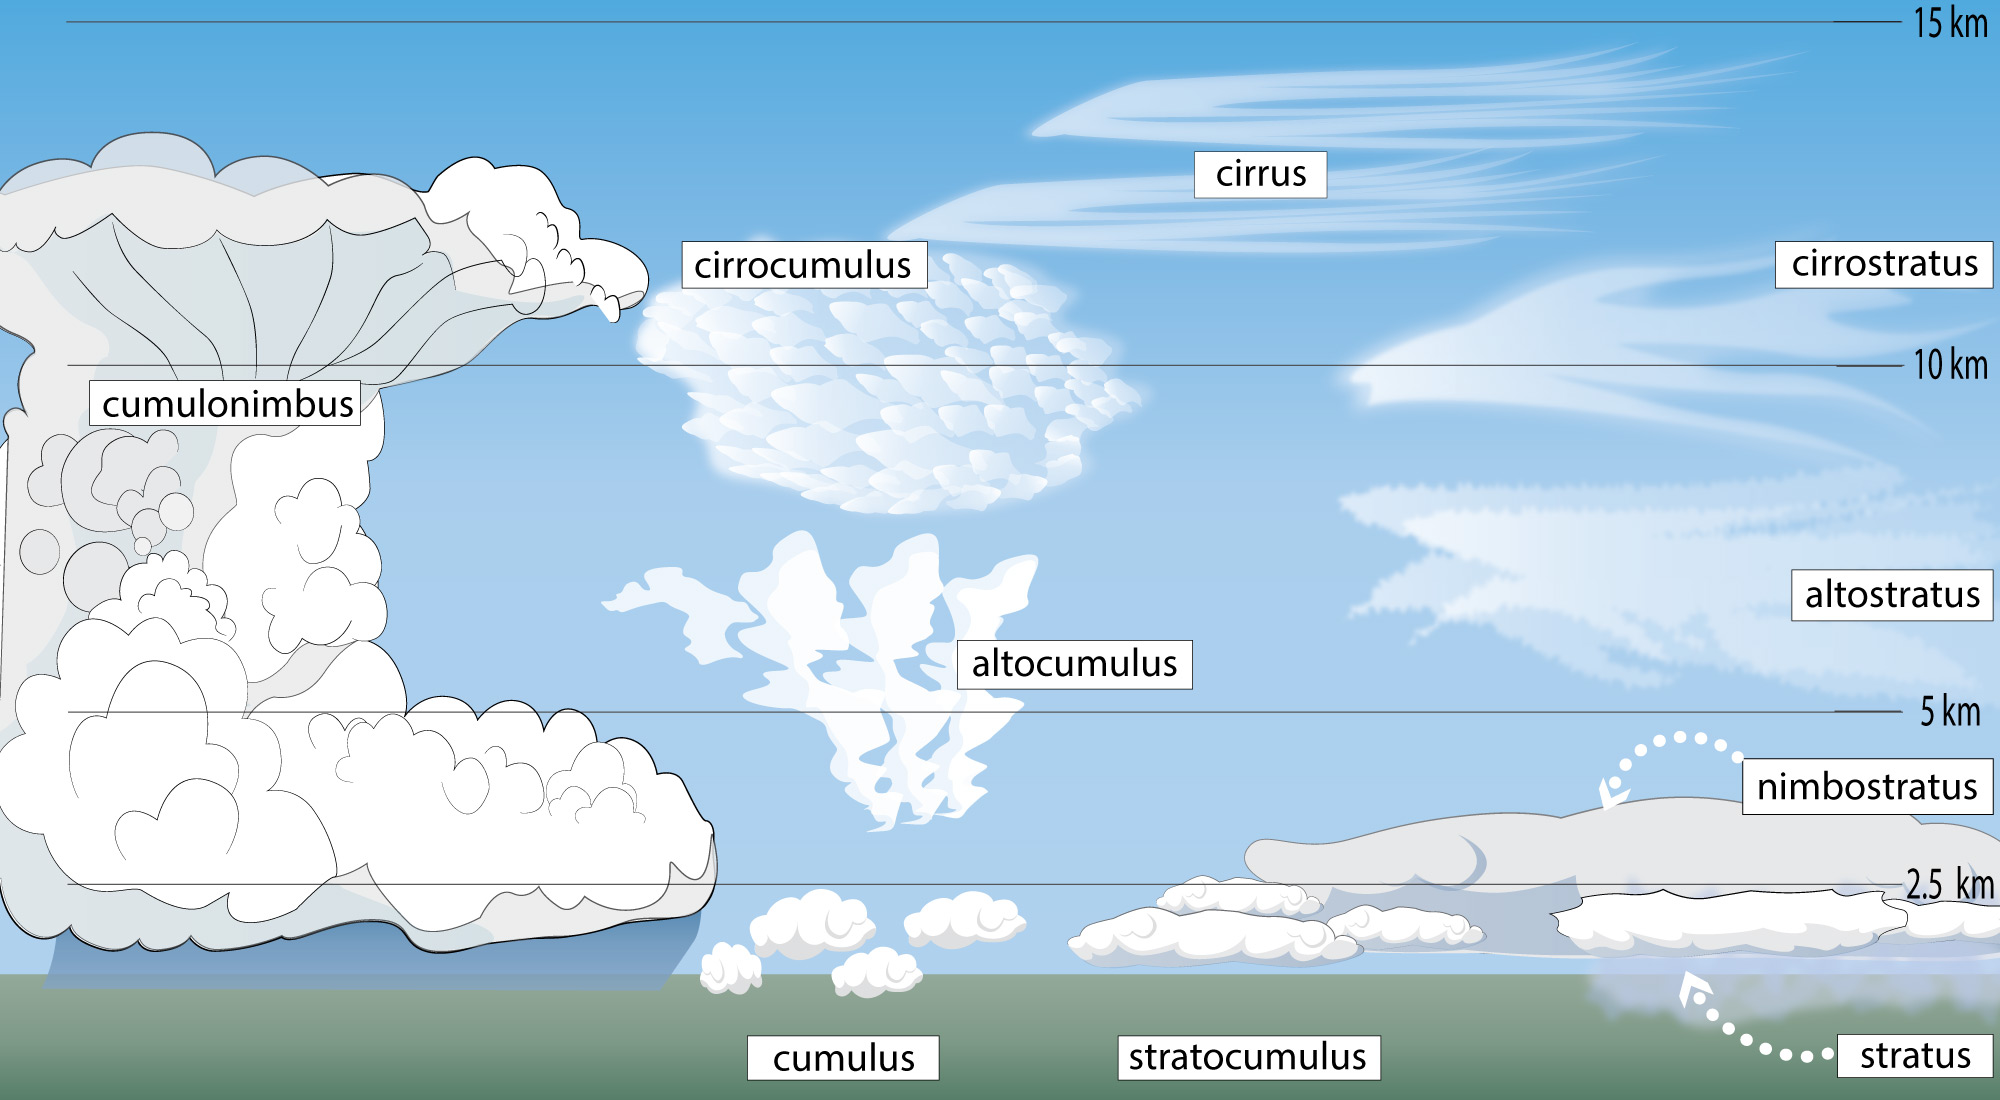
Figure 6.3.1–2 shows several common types of clouds, along with their names (you do not need to memorize these names), and Slide Show 6.3.1–2 shows photos of some of these clouds. Notice that different types of clouds are found at different altitudes, and some span a much wider range of altitudes than others.
 Slide 1 - Cirrus clouds form at high altitudes (above 9 kilometers) and are characterized by their light, whispy texture. They tend to form in the atmosphere ahead of storms, and to foreshadow a change in weather. Credit: PiccoloNamek, oatsy40.


Slideshow 6.3.1-2
Activity
Identifying Clouds
Each day for a period of at least a week, go outside and, using Figure 6.3.1–2 and Slideshow 6.3.1-2 as a guide, identify the types of clouds that you see. Can you draw any conclusions about the types of weather associated with different cloud types? Continue observing clouds in subsequent weeks to evaluate whether how your ideas about clouds and weather seem correct or need revision.
This activity should help students realize that clouds come in many different types, and that the types they see on any particular day are linked to the weather. You can do this activity in small groups or as a class, and it can be done either by going outside or looking out window. It needs only a few minutes each day. Notes:
- Be sure students study the Etymology box below to help them make sense of the cloud names.
- We emphasize that while it is useful for middle school students to be familiar with the names of a few basic cloud types, we strongly recommend against expecting students to memorize these names. Of course, some enthusiastic students may choose to do so on their own.
Connections—Etymology
Clouds
The names of the clouds shown in Figure 6.3.1–2 are only a few of many different names given to clouds. In most cases, however, cloud names are based on their altitude and appearance, and are formed from just the following five roots:
cirro — which means a curly appearance (the Latin root means “curl of hair”) but more generally refers to high-altitude clouds.
alto — which generally refers to mid-altitude clouds, even though the root comes from the Latin altus, meaning “high.”
strato — which refers to clouds with a layered (stratified) appearance.
cumulo — which refers to clouds with a clumpy or “piled up” shape, which you can remember by thinking of the word accumulate, which
is how something becomes piled up.
nimbo — which comes from the Latin nimbus, meaning “dark cloud,” but is used to refer to clouds that produce rain or snow.
Although it is not necessary for you to memorize cloud names unless you plan to become a meteorologist, knowing these five roots will usually allow you to “decode” a cloud name. For example, notice in Figure 6.3.1–2 that cumulus clouds have a piled up appearance, altocumulus are cumulus clouds found at mid-altitudes, and cumulonimbus are cumulus clouds that are producing rain.
Humidity
The basic concept of humidity is very simple. As we discussed earlier in the chapter, humidity describes the amount of water vapor that is in the air in a particular place at a particular time. To understand the concept of humidity more deeply, we have to think about why water vapor is in the atmosphere. The answer is essentially as follows :
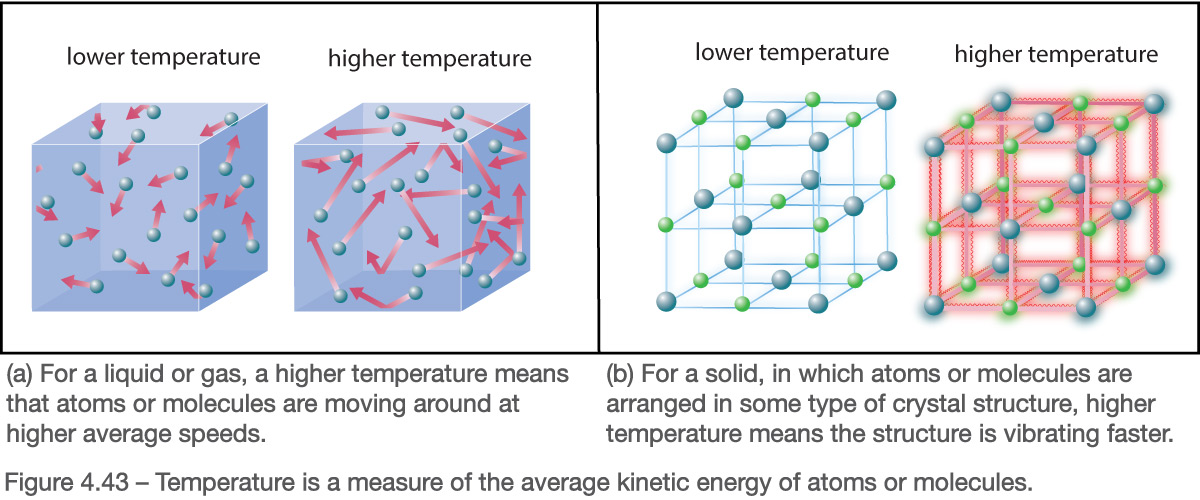
- Remember that temperature is a measure of the average kinetic energy of atoms or molecules in a substance (see Figure 4.43).
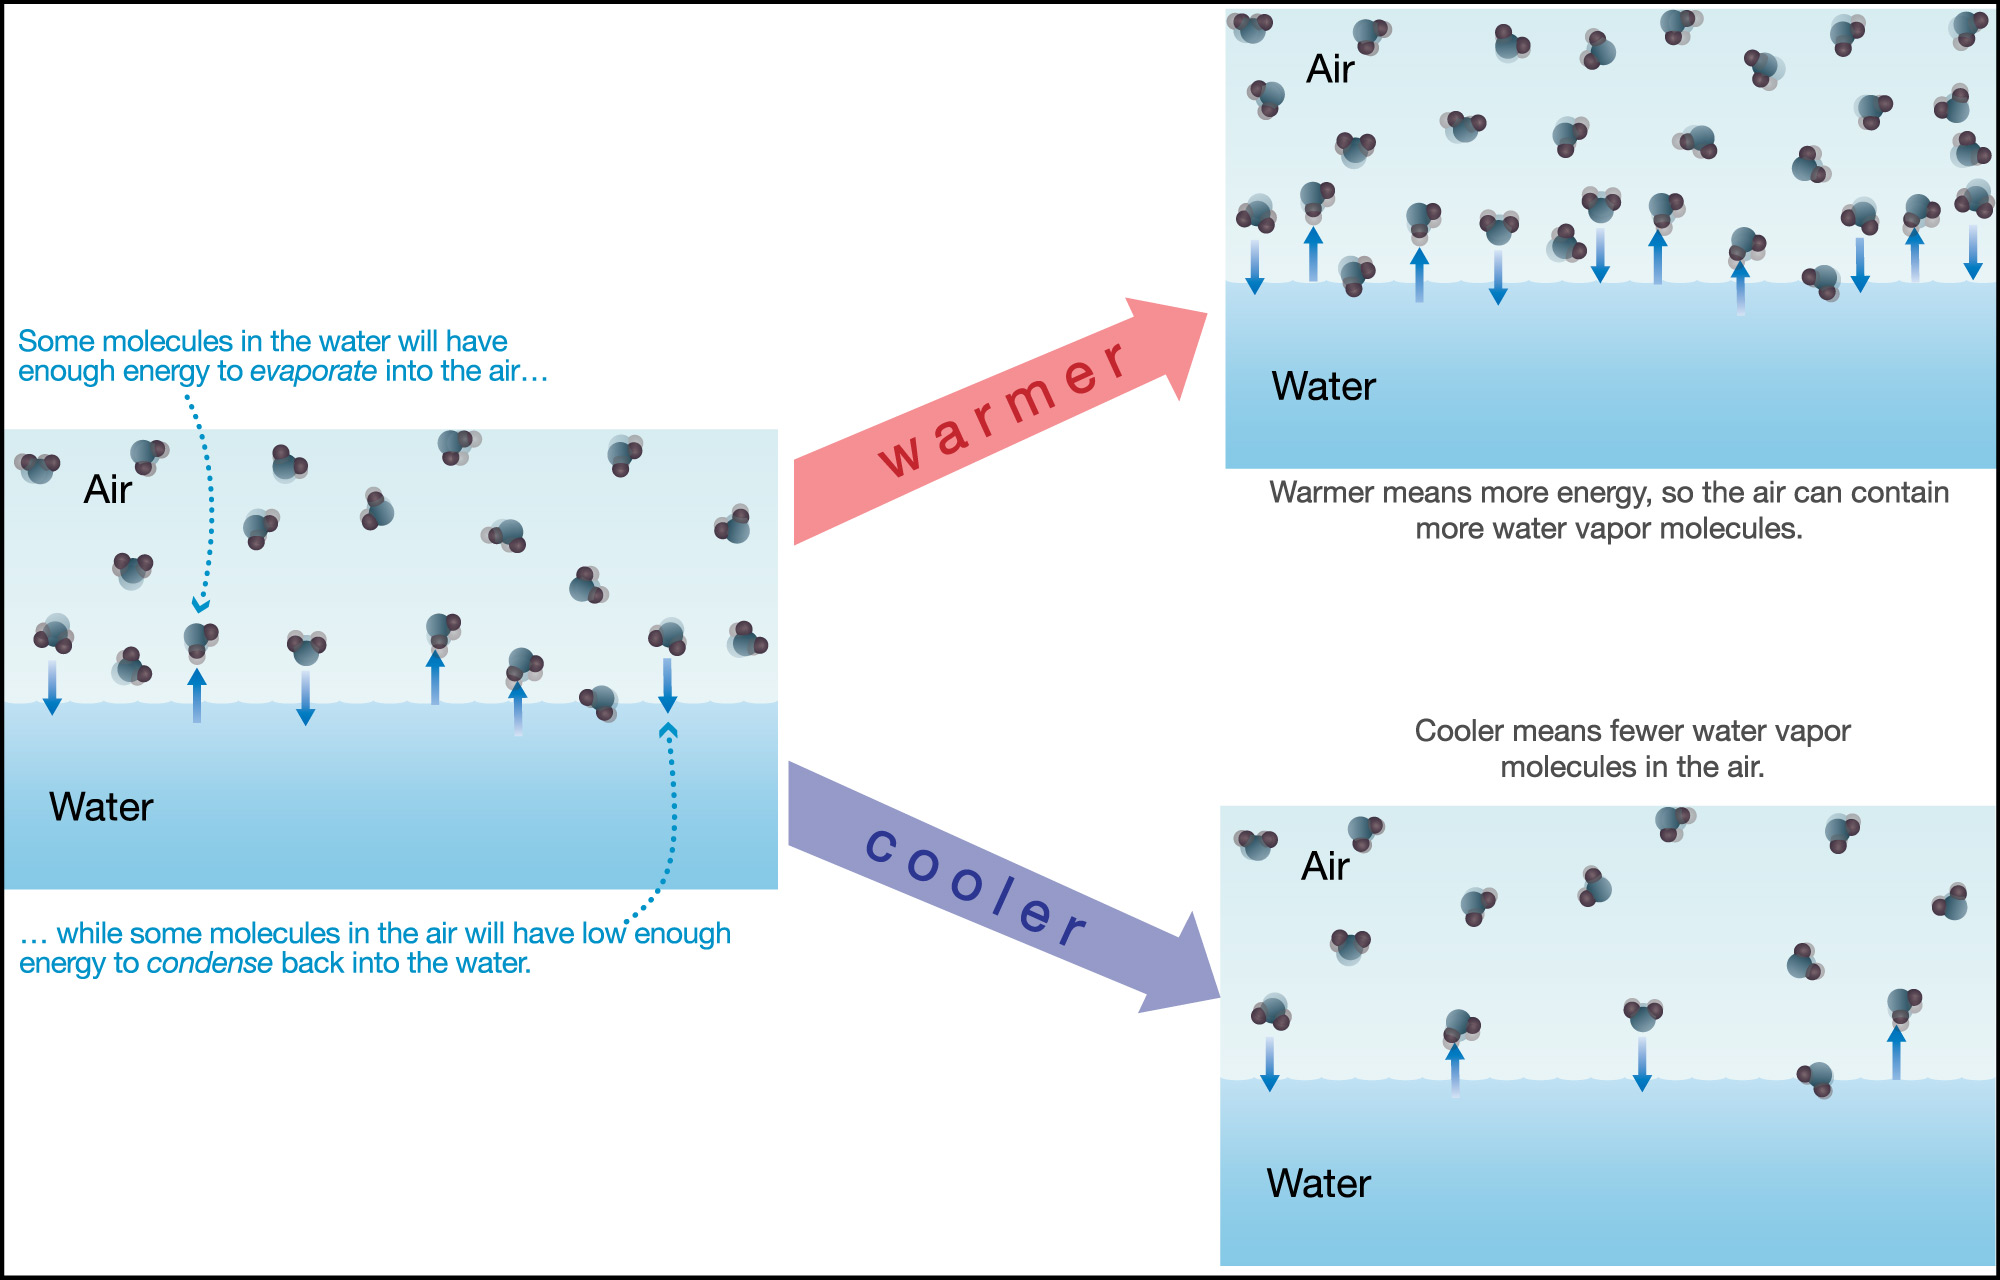
- This means that for liquid water at any temperature, there will always be at least a few water molecules near the surface that will have enough energy to break free and become gas (water vapor) molecules in the atmosphere. The warmer the temperature, the more molecules that will have enough energy to break free.
This is the process we call evaporation , which essentially means “turning into a vapor” (and vapor is another word for gas) . - At the same time, some water vapor molecules in the air will have low enough energy to return back to the water surface.
This is the process of condensation , in which gas molecules return to the liquid state. - The maximum number of water vapor molecules that can be in the air at any one time depends on the temperature: When it is warmer, the air can hold more water vapor.
Figure 6.3.1–3 illustrates these ideas. Note that even though warmer air can hold more water vapor, whether or not it does depends on how much water is available.
One way to quantify humidity is by stating exactly how much water vapor is in the air . However, in the context of weather, it is much more common to talk about the relative humidity , which tells us the percentage of maximum possible amount of water vapor that is in the air at a particular temperature. You can understand this concept as follows:
- As discussed above, the maximum possible amount of water vapor depends on temperature: Warmer air can hold more water vapor.
- If the air actually holds this maximum amount, we say that the air is saturated with water vapor and that the relative humidity is 100%.
If you try to add more water vapor to saturated air, it won’t stay as vapor. Instead, it will condense into droplets of liquid water (or, if the temperature is low enough, into crystals of ice). - In most cases, the air will contain less than the maximum possible amount of water vapor, and relative humidity tells us how close it is to the maximum. For example, a relative humidity of 25% means the air contains only 25% of the maximum amount of water vapor that it could hold.
The fact that relative humidity depends on temperature leads directly to the processes that form clouds and dew . Use the following questions to explore these ideas.
Discuss the following questions with a classmate. Then click to open the answers to see if they agree with what you came up with.
1. Suppose that your local air temperature is 20°C (68°F) and the relative humidity is 75%, and the air then suddenly became warmer (without any change in the total amount of water vapor in the air). Would the relative humidity go up, go down, or stay the same? Explain why.
Warming the air would make the relative humidity go down. The reason is that warmer air is capable of holding more water vapor. Therefore, when the temperature goes up but the total amount of water vapor remains the same, the air is holding a smaller percentage of its maximum possible water vapor. This smaller percentage means a lower relative humidity.
2. Now, suppose instead that the air suddenly became cooler. What would happen to the relative humidity in that case?
Cooling the air would make the relative humidity go up. This is simply the opposite of what happens with warming. To summarize: As long as the actual amount of water vapor is unchanged, warming the air makes the relative humidity go down and cooling the air makes the relative humidity go up.
3. In general, what would you expect to happen to the temperature and relative humidity of air that is rising upward from the ground?
Rising air generally becomes cooler and more humid. It becomes cooler because temperature generally falls with altitude in the troposphere (see Figure 6.1.1–16), and from question 2 you know that cooling will give the air a higher relative humidity.
4. Your answer to question 3 implies that at some altitude, the air is likely to reach a relative humidity of 100%. What will happen as the air rises beyond that altitude?
Clouds will form. Here’s why: The air will continue to cool as it rises higher, which means the maximum amount of water vapor it can hold will continue to drop. Therefore, once the relative humidity has already reached 100%, the further drop in temperature means that some of the water vapor must condense into droplets or ice crystals, thereby forming clouds.
5. Why does dew tend to form when it is cool in the morning rather than when it is warmer during the day?
As long as the total amount of water vapor in the air stays fairly constant, the relative humidity will be higher when it is cooler and lower when it is warmer. If the cool morning air is cool enough for the relative humidity to reach 100%, then dew will form.
There’s one more idea we need to discuss about humidity, which is the way it makes us feel. In particular, you are probably aware that a hot, humid day tends to be much more uncomfortable than a hot, dry day. Interestingly, the reason is not because of the water vapor itself, which we can’t really feel. Instead, the reason has to do with what we call evaporative cooling , in which the fact that evaporating molecules are carrying away energy leads to cooling of the surface where they were previously located . This is how sweating works: Our bodies sweat when we are hot, because the evaporating water (sweat) cools us down. The next two questions explore how higher humidity therefore makes us less comfortable.
Continue from the previous question set, discussing these with a classmate. Then click to open the answers to see if they agree with what you came up with.
6. How would you expect the relative humidity to affect the rate at which your sweat can evaporate on a hot day? That is, would higher humidity make your sweat evaporate faster or slower, and why?
Higher relative humidity means your sweat evaporates more slowly. The reason is that as air gets closer to being saturated (relative humidity of 100%), it is more difficult for additional water to evaporate, which slows the evaporation process.
7. How does the change you found in question 6 explain why a hot, humid day is less comfortable than a drier day of the same temperature?
Hint: Think about the above discussion of how sweating cools your body through evaporative cooling .
The slower rate of evaporation makes evaporative cooling less effective at higher relative humidity. Therefore, your sweat doesn’t cool you as much on a more humid day, leading you to sweat even more, which makes you feel sticky and uncomfortable.
If you’ve successfully answered the above questions, then you now understand why hot, humid days can be so uncomfortable. The same concepts of relative humidity and evaporative cooling explain many other phenomena that you are familiar with, including why blowing on hot soup cools it faster, how fans can keep us cool in summer, and why you may get chilled when you get out of a shower or swimming pool. Use the following activity and discussion to understand these ideas in more detail.
Claim-Evidence-Reasoning Activity
Evaporative Cooling Part 1: Blowing on Hot Soup
You know that blowing on hot soup or any hot drink makes it cool faster. But what would happen if you blew hot air on it? This activity will explore this question.
- You will need two bowls, two thermometers, and a blow dryer for this experiment.
- Your experimental set-up should something like this photo. Note: Use wide bowls, so there is plenty of surface area for the blow dryer to blow on.

- Make and write down a prediction before you begin: Suppose you have two bowls of hot soup or hot water. If you “blow” on one with hot air from a blow dryer and leave the other alone, which bowl will cool faster?
- Now conduct the experiment as follows (and see photo above):
- Step 1 – Pour equal amounts of hot soup or hot water into each of the two bowls, using the thermometers to make sure that the liquid has the same temperature in both bowls. Note: The exact starting temperature does not matter, as long as it is significantly higher than room temperature. For example, it is fine to use hot tap water.
- Step 2 – Use the blow dryer to blow hot air on one bowl while you let the other bowl cool on its own. Note: Set the blow dryer for hot air but low power, because higher power may splash water out of the bowl, which you don’t want.
- Step 3 – Observe how the temperatures in the two bowls change over a period of a few minutes.
- Was your prediction right or wrong? Are you surprised?
- Based on the results of your experiment and what you’ve learned in this section, use evidence and reasoning to support or refute the following claim. If you refute the claim, then provide a better explanation for why the cooling occurs.
Claim: Blowing on hot soup lowers its temperature because you are blowing cool air.
We strongly encourage you to do this activity, which uses a very simple and short experiment — and one that will surprise most of your students — to address the common misconception that blowing on hot soup cools it with cool air. Notes:
- (1): You might wish to make a class tabulation of how many students make each prediction. You might even hold a brief debate between the students who choose each of the two bowls (as the one to cool faster), which will add motivation for carrying out the actual experiment.
- (2) The experiment is very easy to do; just be sure that students start it correctly and use the blow dryer in a way that blows plenty of air without splashing the liquid out of the bowl. Students should see a noticeable drop in the temperature of the bowl with the blow dryer in just 3 to 5 minutes.
- (3): You may wish to review the class predictions, so that students see how many of them predicted correctly. The results will obviously vary with different groups, but we’ve found that most people (whether students or adults) guess wrong, thinking that blowing hot air will slow the cooling process.
- (4) Students should be able to use their results and what they’ve learned to refute the claim. That is, it is not blowing cool air that cools the liquid. Rather, it is evaporative cooling: The blow dryer kept exposing more liquid at the surface, thereby enhancing evaporation, which meant more evaporative cooling.
Note: You might also want to point out that even blowing by mouth means fairly warm air, since the air that you exhale has your body temperature. Again, it is not the blown air that is cooling the liquid, but the fact that it is “stirring” the liquid in a way that makes for more evaporative cooling. - Fyi: You or your students may wonder why blowing on hot food also works to cool it down, given that the food is not liquid. The answer is a combination of two factors: (1) Most food contains at least some moisture than can evaporate, so even for food that is not liquid, there is still some evaporative cooling, and blowing on it enhances this. (2) The other thing that cools the food is the fact that its heat is carried away by the air (through conduction and convection). When the food is hot, it creates a thin layer of heated air around it, which slows this heat transfer. By blowing on it, you blow away this heated air, allowing cooler room temperature air to flow in and carry away heat more rapidly.
Discussion/Activity
Evaporative Cooling Part 2: Swimming Pools and Fans
The following questions will help you understand two more cases in which evaporative cooling is important. (Note: that’s a hint!)
- Let’s start by considering what happens when you get out of a shower or swimming pool.
a. You’ll likely feel a bit of a chill when you are dripping wet, even if the air around you is fairly warm. Can you explain why?
b. Will you be more chilled on dry day or a more humid day (assuming the same air temperature in both cases)? Why? - You’ve probably used a fan to cool yourself off on a hot day. Let’s think about why.
a. A fan of any type (hand-held or mechanical with a spinning blade) simply moves air around. Does this movement make the air
cooler? Note: If you are unsure, do the optional experiments in question 3.
b. What does your body do to try to keep cool on a hot day?
c. Based on your answers to parts (a) and (b), and what you’ve learned already, explain the real reason why fans cool you down
on hot days. - Try the following experiments to confirm and reinforce what you’ve learned about how fans work.
- Experiment 1: Turn on a small, electric fan in a large room or outside. Measure the air temperature away from the fan and in front of the fan. How do the two temperatures compare, and why? Note: Be sure that no extra heat (such as sunlight) is affecting your measurements, and that your thermometers are dry.
- Experiment 2: Find an open box that can fit your electric fan. Place the fan in the box, and turn it on so that it is blowing air outward. Put one thermometer in the box and one outside the box, and compare their measurements. Explain your results.
- Experiment 3: Wrap two thermometers with paper towels, but leave one dry while you wet the second one. Put both wrapped thermometers in front of the fan and let it blow on them for a couple minutes. Then unwrap them and compare their temperature measurements. Explain your results. (Hint: Review the above box “I was wondering… How is relative humidity measured?”, since the wet and dry thermometers in this experiment essentially make the device (a psychrometer ) discussed in that box.)
This discussion continues the theme of the prior activity, though you can in principle hold this discussion even if you did not do that activity. Notes:
- (1a): As students may recognize from the hint, it’s evaporative cooling. As the water evaporates from your skin, the evaporation process carries away heat, so you get chilled.
- (1b): You’ll be less chilled on the more humid day, for essentially the same reason that you stay sweatier on humid days: The higher humidity slows the evaporation process. When your sweat, this inhibits your cooling, making you less comfortable. The higher humidity also slows the evaporation of water dripping from you after a shower or swim, and since this evaporation is what causes the chill, you’ll be less chilled.
- (2a) As students can verify if they do the experiments in question 3, the fan does not lower the air temperature; it simply moves air around. It may be helpful to point out that the fan essentially creates a small wind, and winds can blow both cool and warm air.
On a deeper level, you could remind students that the air temperature is the average kinetic energy of the molecules in the air. These molecular motions are much faster than the “wind” from the fan: In fact, typical molecular speeds at room temperature are about 500 meters per second, which is more than 1,800 kilometers per hour (about 1,120 miles per hour). Therefore, the wind from the fan has a negligible effect on the air temperature. PLUS: even if the fan was adding substantial kinetic energy, this added energy would make the air warmer, not cooler. - (2b): You sweat, so that the evaporation of your sweat cools you through evaporative cooling.
- (2c) This brings us to the real reason a fan works: By blowing air at you, it allows more of your sweat to evaporate, which enhances your body’s evaporative cooling.
In case you are curious, here is a slightly deeper explanation. When you are hot and sweating, this creates a thin, local layer of more humid air just above your skin. Therefore, the air being blown by the fan will be drier than this air, which means it will enhance evaporation as it blows over you. - (3) These simple experiments are worth doing if you have a small electric fan, and each can be done fairly quickly. Notes on the results:
- Experiment 1: The air temperature should be the same in both cases, for the reasons discussed in question 2a.
- Experiment 2: The air in the box will become hotter than the surrounding room air. The reason is the waste heat from the electric fan.
Note: When learning how fans work, some students my wonder why we couldn’t counteract global warming by using giant fans to enhance evaporative cooling. This Experiment provides one answer: The fans require power that generates waste heat, which would offset any cooling they provide. A further answer is that they won’t affect the global water balance, which depends only on the global average temperature. - Experiment 3: The thermometer wrapped in the wet towel will read lower, because it has been cooled by evaporative cooling. As noted in the activity, students should recognize that this experiment is essentially making a psychrometer.
Discussion
Dry Skin and Chapped Lips
You’ve also probably noticed that you are more likely to have dry skin and chapped lips when the relative humidity is lower, especially in the winter. Discuss the following questions to understand why.
- For any particular temperature, explain why you would expect to have drier skin and more chapped lips when the relative humidity is lower.
- Now think about a winter day. If you walk into a heated room, how would you expect the indoor relative humidity to compare to the outdoor relative humidity? Why?
- Use your answer to question 2 to explain why you might end up with dry skin and chapped lips on cold days, even if the relative humidity (outdoors) is fairly high.
This should be a fairly brief discussion, as the ideas should all be fairly easy for students to figure out if they understand the concept of relative humidity.
- (1) A low relative humidity means it will be easier for water to evaporate. Therefore, at any particular temperature, your skin and lips will lose more moisture on a drier day, making your skin dry and your lips chapped.
- (2) Assuming the heated room simply contains outdoor air that has been heated up (no added moisture), then the indoor relatively humidity will be much lower. The reason is that the actual water vapor content of the air (its “absolute humidity”) will be the same both inside and outside. However, because the warmer indoor air can hold a larger maximum amount of water vapor (that is, it has a higher saturation point), its relative humidity will be much lower.
- (3) Outside, your skin and lips might feel fine. But the much lower indoor relative humidity will make them dry and chapped when you come inside. Note: This is why many people use humidifiers in the winter.
Types of Precipitation
Remember again that clouds are made of droplets or ice crystals. These droplets or crystals are held aloft by air pressure and winds, but they can fall to the ground if they grow large enough. As we’ve discussed, any form of water that falls toward the ground is called precipitation . The most common forms of precipitation are rain and snow, but they are not the only forms. Precipitation can also fall in the forms that are usually called sleet and hail, and you may also be familiar with freezing rain. Let’s briefly discuss the circumstances under which we may experience each of these forms of precipitation.
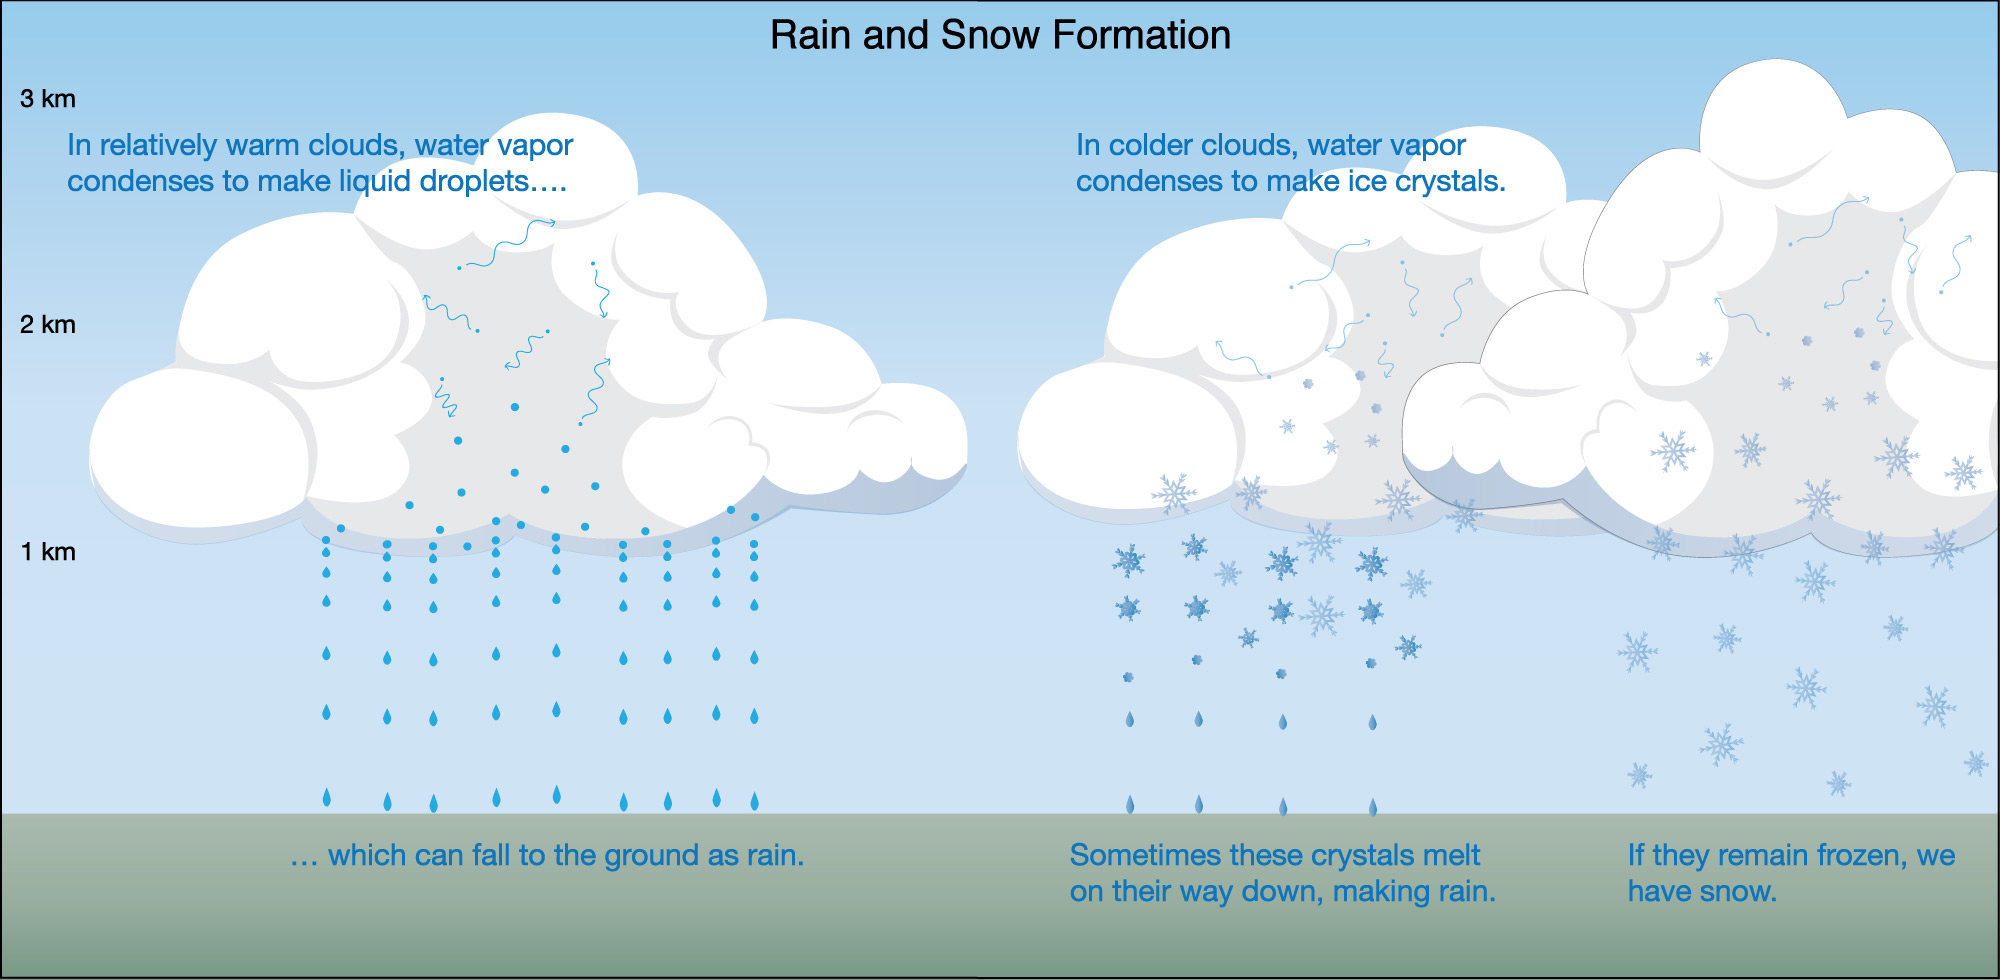
We’ll start with the most familiar: rain and snow. Figure 6.3.1–4 summarizes how rain and snow are formed:
- Snow forms when water vapor condenses to make ice crystals in clouds. If these crystals fall all the way to the ground, then it is snowing.
- Rain can form in either of two ways: (1) Rain can form when water vapor condenses to make liquid droplets in clouds. (2) Rain may start out as snow, but if the snow melts into liquid before it reaches the ground, then we will see it raining rather than snowing.
Sleet and freezing rain are variations on these themes that occur in winter storms (Figure 6.3.1–5a). The difference between them and ordinary snow is that they fall through a layer of relatively warm air that lies between the ground and the clouds.
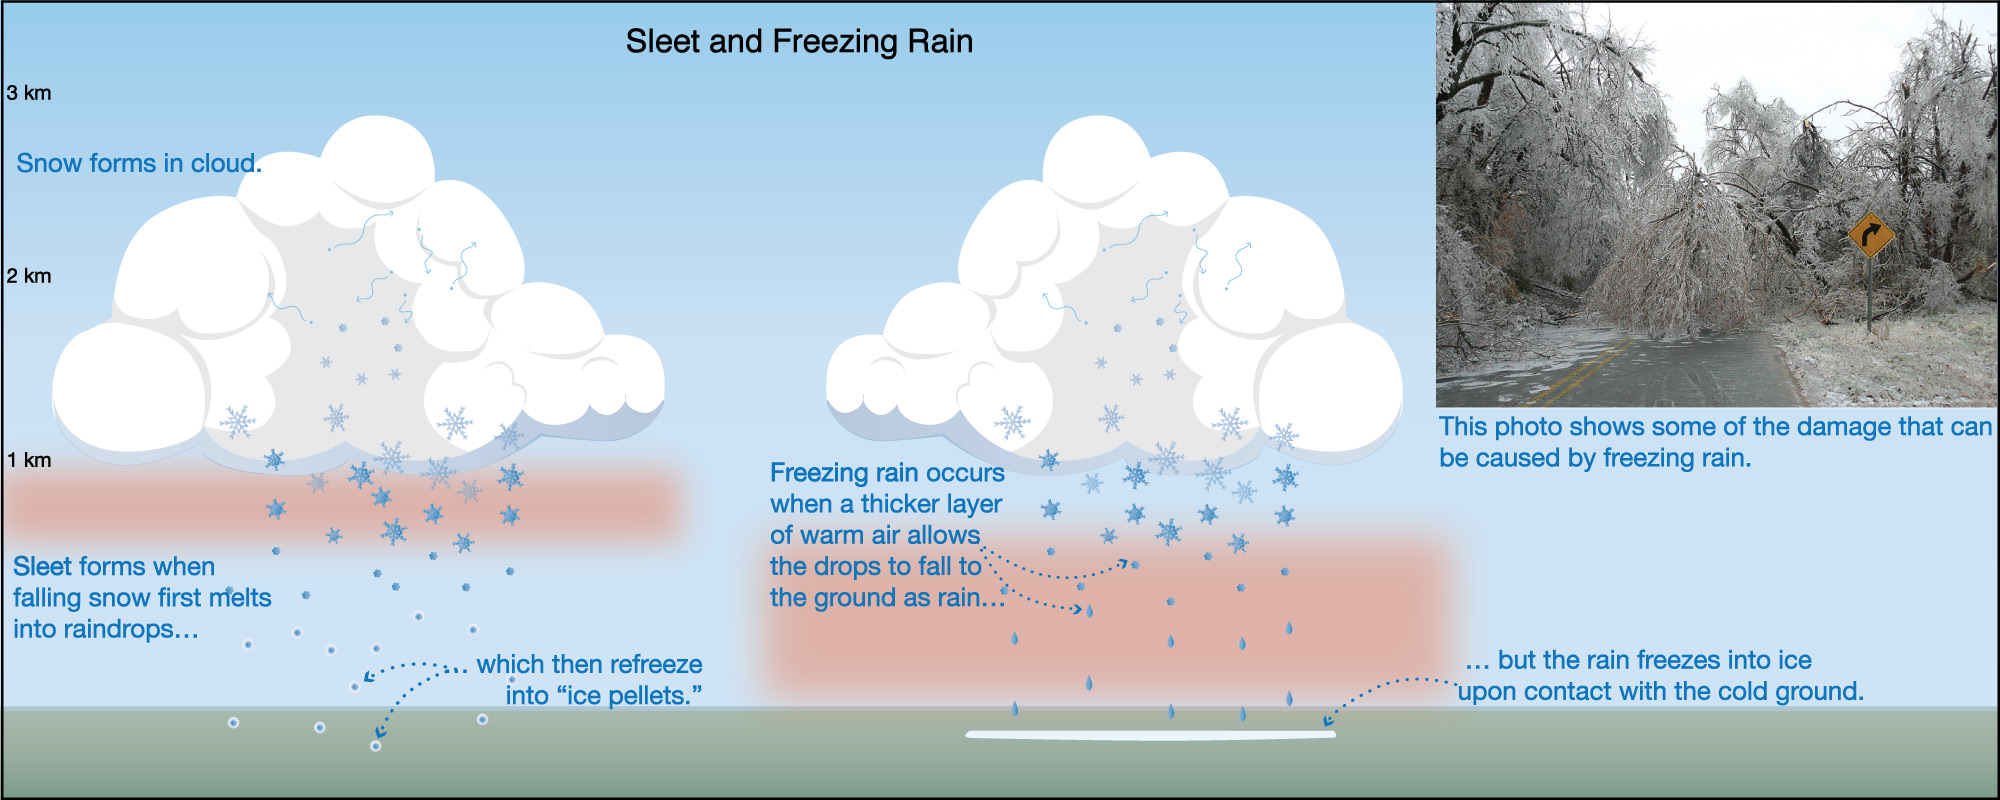
- Sleet is essentially small “ice pellets” that fall to the ground. Sleet usually starts out as snowflakes in clouds. But as it falls through a warm air layer, the snow melts into raindrops, then refreezes to make the “ice pellets” before hitting the ground.
- Freezing rain forms similarly to sleet in that it starts out as snow and melts into raindrops as it falls through a warm air layer. In this case, however, the raindrops remain as rain until they hit the cold ground (or the cold surfaces of other objects), at which point they freeze on contact. Freezing rain tends to be especially dangerous, because it coats the ground and other objects with a layer of slippery ice (Figure 6.3.1–5b).
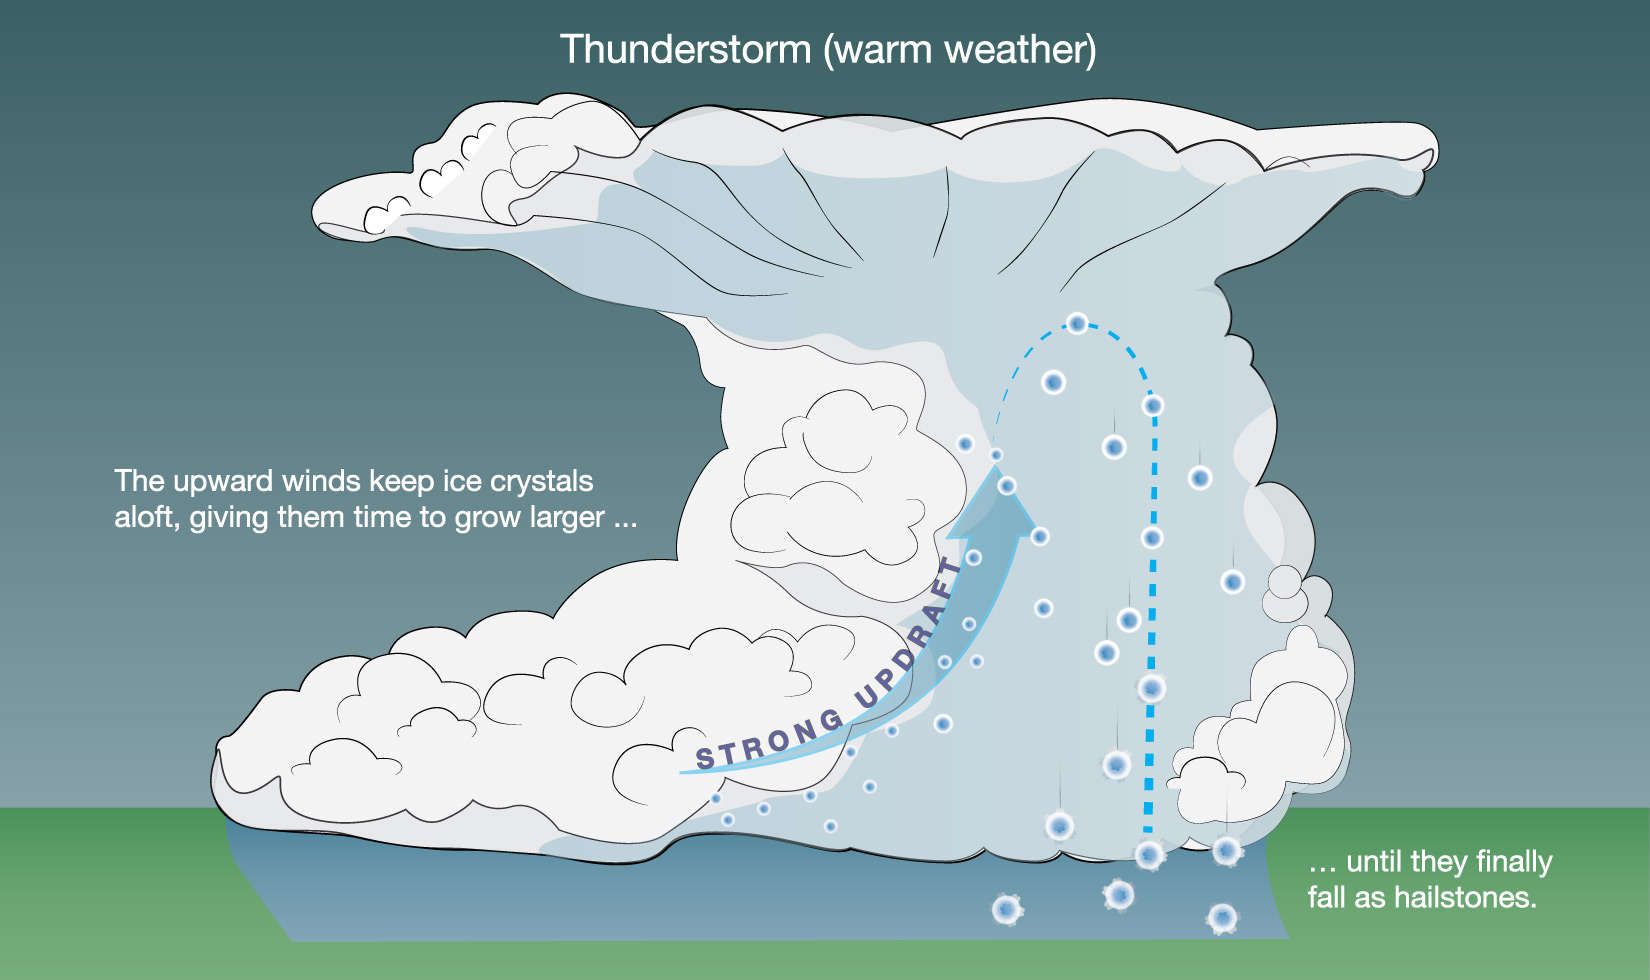
Hail may look similar to the ice pebbles of sleet (Figure 6.3.1–6), but it is made quite differently. Hail forms only in thunderstorms, which generally occur in warm weather. Note that while most hailstones are fairly small (like the ice pebbles of sleet), some extreme thunderstorms can produce much larger ones.
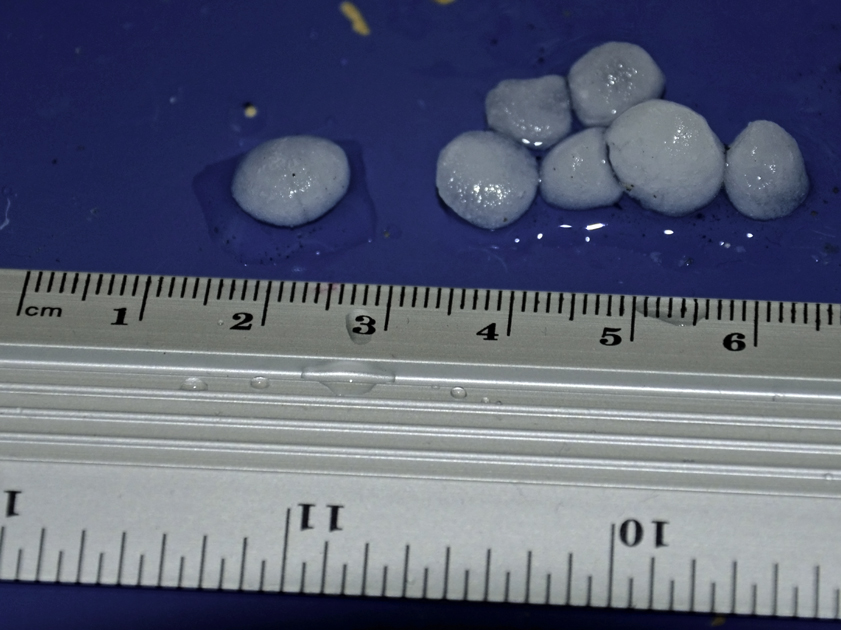
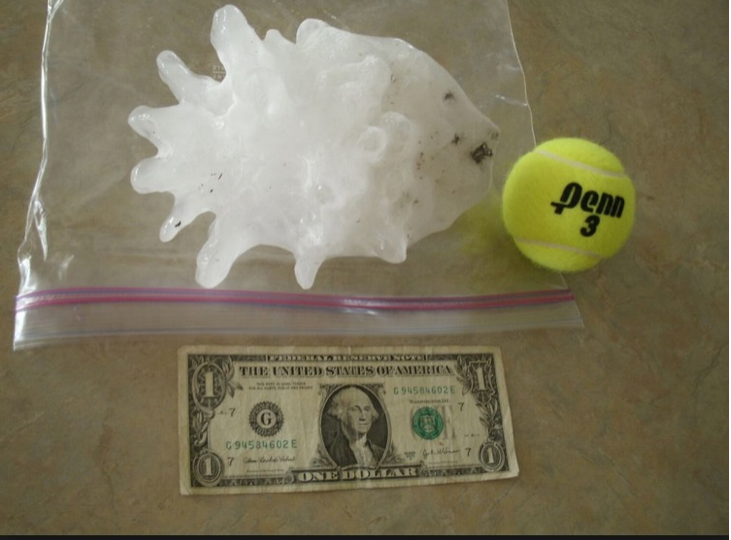
Figure 6.3.1–6 – Hail may look similar to the ice pebbles of sleet, but it forms very differently, being made in thunderstorms that generally occur in warm weather. These photos show that hailstones come in a wide range of sizes.
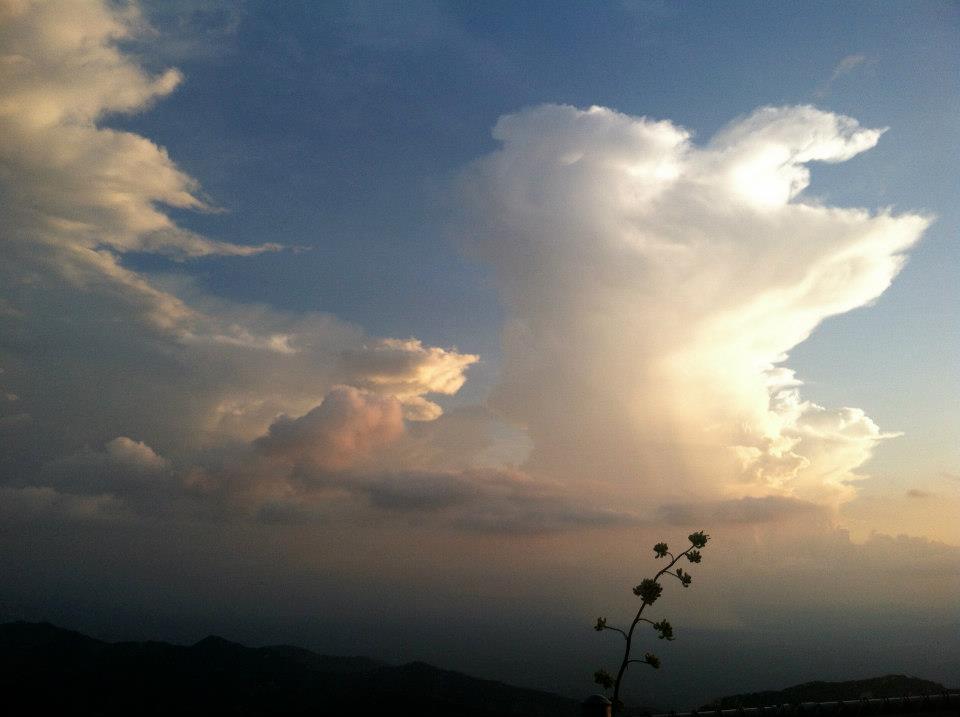
To understand how hail forms, we need to understand the thunderstorms that make them. Thunderstorms form when warm surface temperatures and cool upper atmosphere temperatures promote strong convection , so that the warm air rises rapidly upward. Because the air at high altitude is very cold, the water vapor in the rising air condenses to make clouds of ice crystals. The strong convection can make thunderclouds quite tall and thick, with tops that sometimes reach the stratosphere , where they flatten out to make an anvil shape (Figure 6.3.1–7).
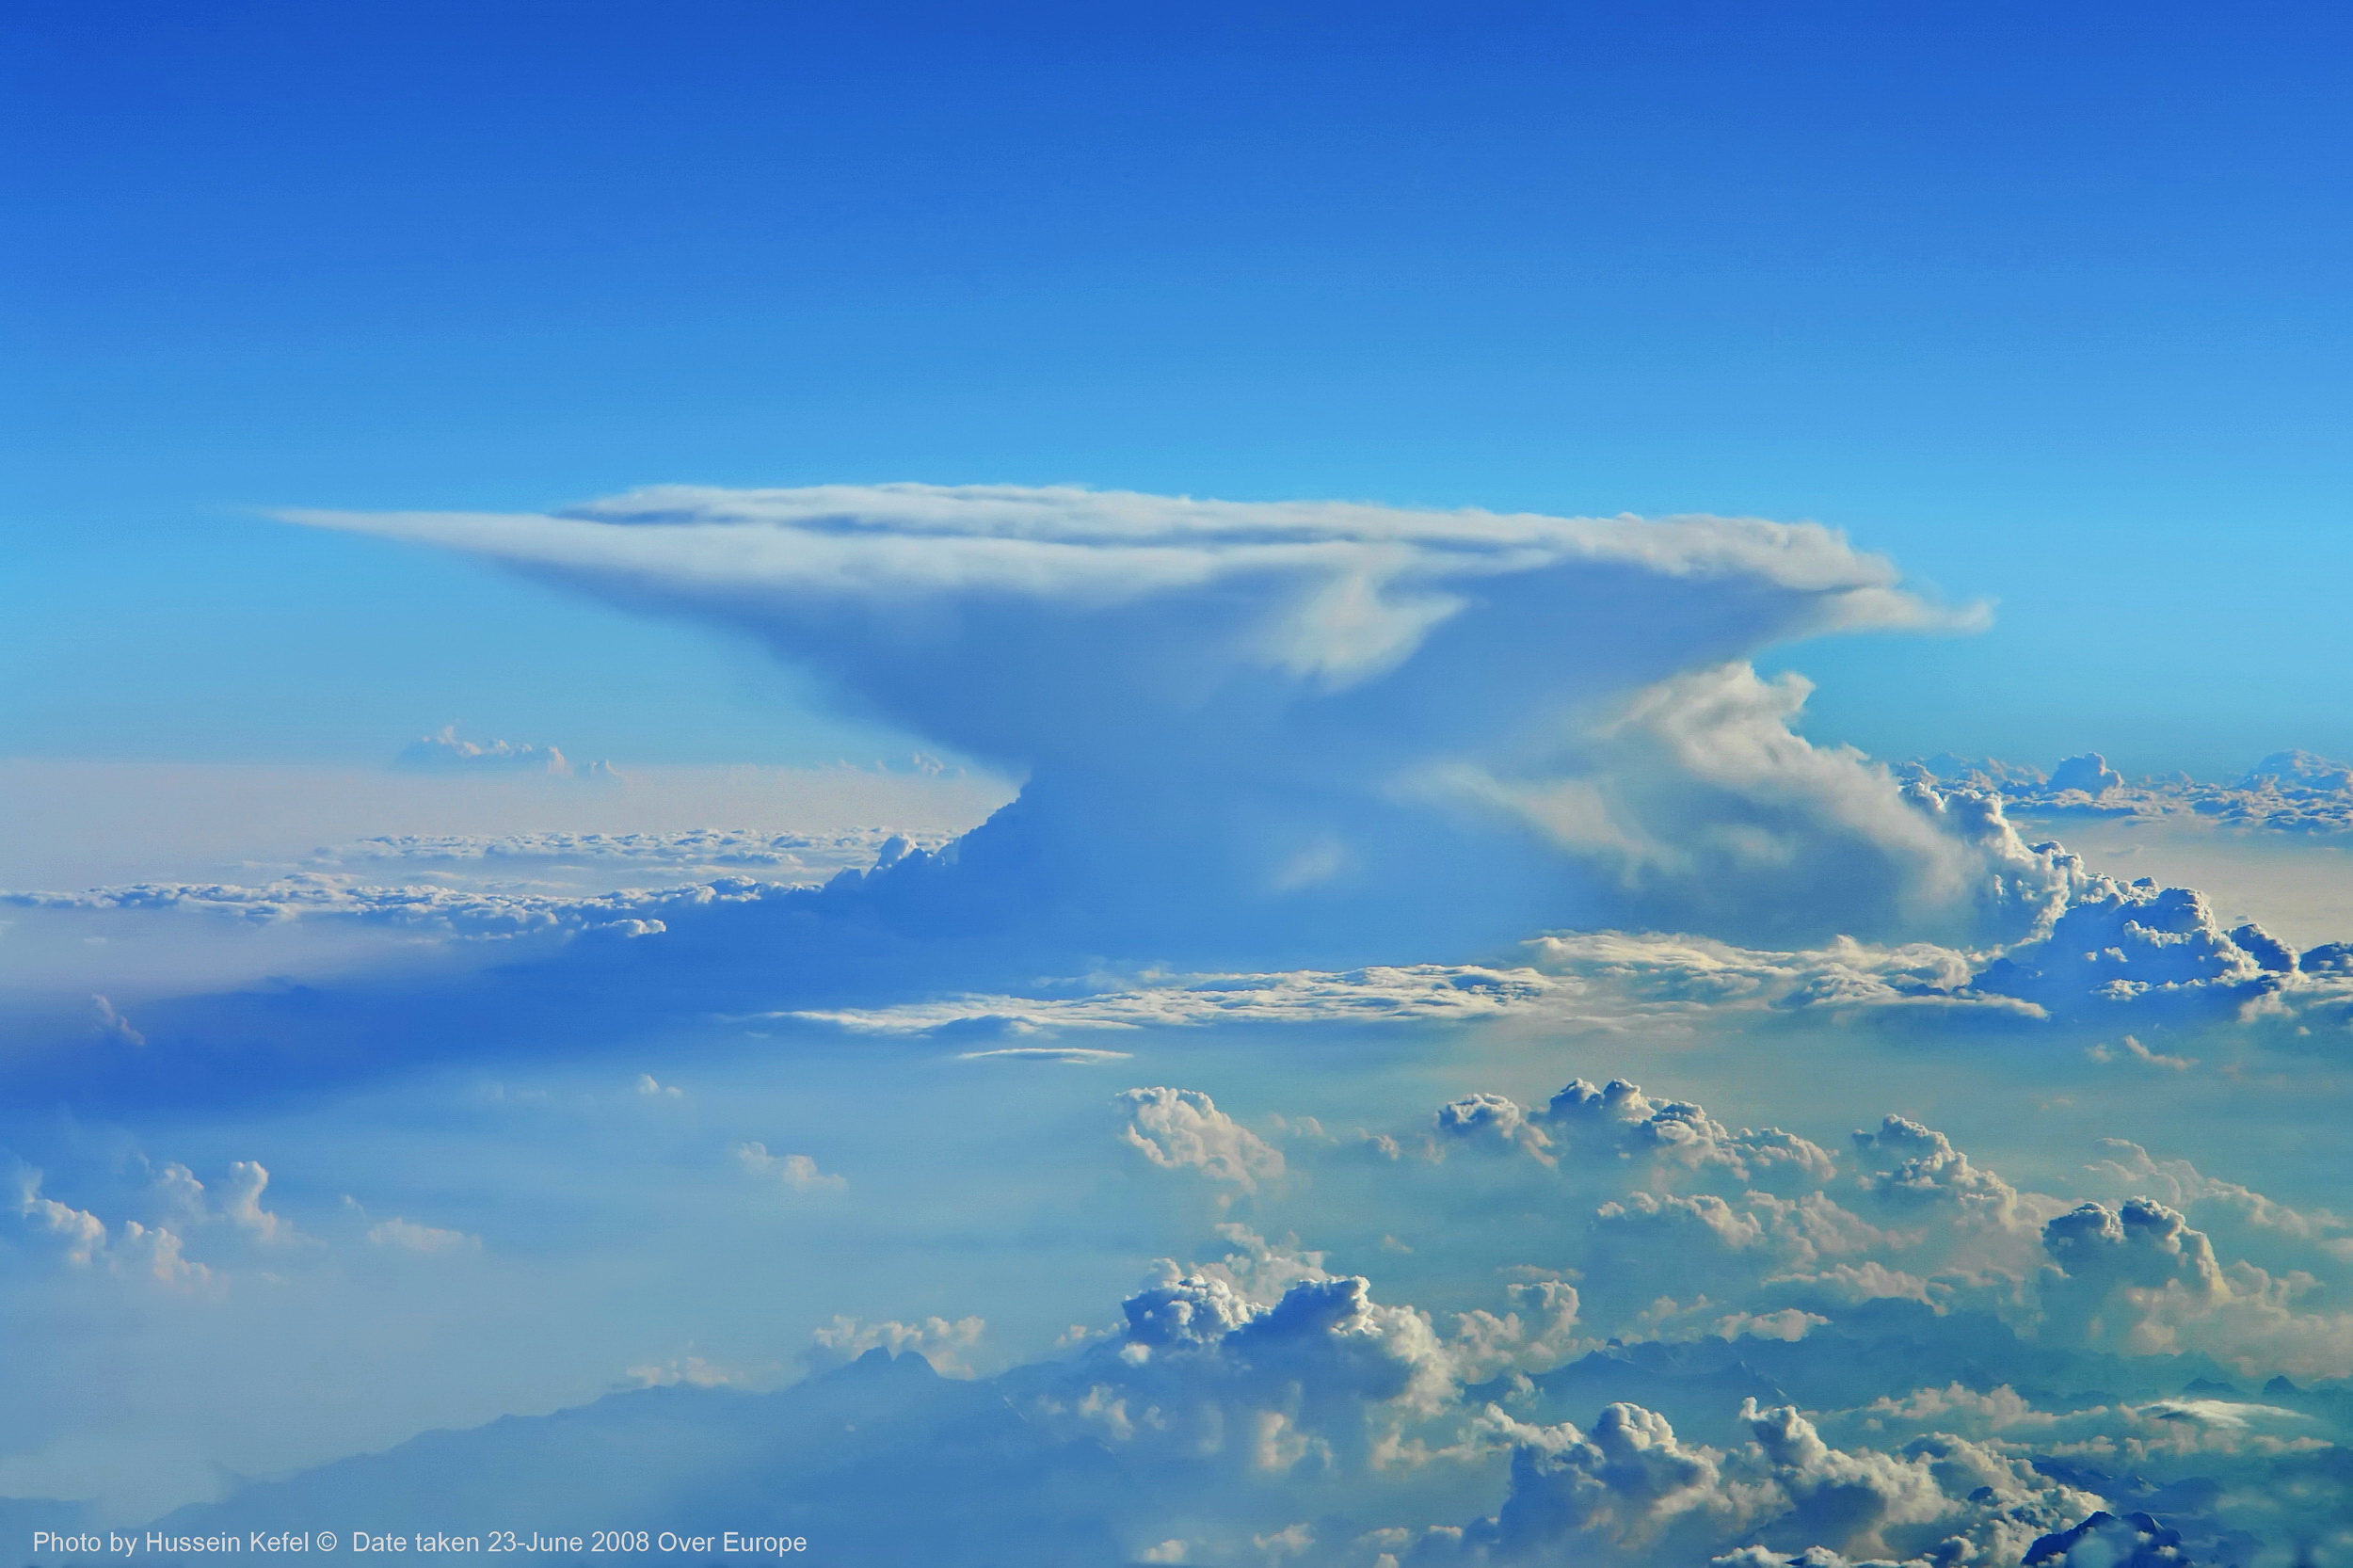
Figure 6.3.1–7 – The strong convection in thunderstorms often allows their cloudtops to extend all the way to the stratosphere ,
where the layered air makes their tops flatten out. This flattening gives thunderclouds their characteristic anvil shape, seen here
in a view from an airplane. Credit: Hussein Kefel.
Thunderstorms can produce either rain or hail as follows:
- If the ice crystals in the clouds fall while still fairly small, they will melt on their way down, making rain.
- However, the strong convection that makes thunderstorms also gives them strong, upward winds that can keep the ice crystals aloft. If they stay aloft long enough, the crystals can keep growing larger, becoming hailstones that are large enough to stay solid when they finally fall to the ground (Figure 6.3.1–8).
Discussion
Local Precipitation
Consider each of the forms of precipitation we have discussed: rain, snow, sleet, hail, and freezing rain. Which of these are common in your local area? Discuss how they affect your area, both in terms of positives (such as providing drinking water) and negatives (such as damage or danger).
This brief discussion is intended to help students connect the above discussion to their life experiences in your local area. We recommend holding this discussion as a class, so that students will hear a variety of perspectives on how precipitation affects you locally.
Extreme Weather
The weather is always changing, but most of the time we are able to live with it fairly easily. On occasion, though, the weather can become severe enough to count as what we often call extreme weather , meaning weather that can cause substantial damage or loss of life.
We’ve already seen examples of some extreme weather events, and you are probably familiar with many others. Study slide Show 6.3.1–9 to review some of the many different types of extreme weather that can occur on Earth.
 Slide 1 - Thunderstorms and their associated lightning strikes tend to occur in warm weather. Strong convection drives warm air upward, where its water vapor condenses to make thick clouds. Thunderstorms often feature heavy rain and/or hail. Credit: NOAA.


Slide Show 6.3.1–9 – These slides show a few of the many types of extreme weather events.
The fact that extreme weather events can cause so much damage explains why scientists spend a great deal of time studying them. For most types of extreme weather, scientists now have a fairly detailed understanding of how and why the events occur. Prediction of these events is still difficult, however, a topic we’ll discuss further in Section 6.3.3. For now, it’s worth noting just a couple of important issues about extreme weather events.
First, while some events like thunderstorms or tornados may seem fairly small and local, they usually occur over a large region. In other words, if you are experiencing thunderstorms, it is likely that similar storms are occurring over a fairly large region around you.
Second, it’s important to realize that the same types of storms sometimes have different names. One common example is with the tropical storms that form over low pressure regions in tropical oceans (that is, near the equator):
- A tropical storm first forms as what is called a “tropical depression” (the word “depression” is used because it is over a low-pressure area).
- It officially becomes a tropical storm when it has sustained wind speeds above 62 kilometers per hour (39 miles per hour).
- If sustained winds reach 119 kilometers per hour (74 miles per hour), then we call it a hurricane if it is in the North Atlantic or Northeast Pacific Ocean, a typhoon if it is in the Northwest Pacific, and a cyclone if it is in the South Pacific or Indian Ocean. In other words, hurricanes, typhoons, and cyclones are all the same type of storm.
Discussion
Extreme Weather
After viewing all of the slides in Slide Show 6.3.1–9, discuss the following questions in small groups or as a class.
- For each of the different types of extreme weather events shown in the slide set: Does this type of event ever occur in your local region? If so, are there certain times of year when it is more likely? If not, why not?
- Make a list of as many other types of extreme weather as you can think of, and for each one discuss whether and when it is likely in your local region.
- Are there any major extreme weather events going on in your region right now? Are there any occurring elsewhere in the world? Briefly discuss the effects of these ongoing events.
- Have any extreme weather events impacted your region in the past couple of years? If so, discuss the effects they have had.
- If you were a local official in charge of disaster preparedness for your area, what kinds of extreme weather events would you be most concerned about? What kinds of actions would you recommend to help make sure people are prepared if and when such events occur?
This can be a brief discussion, aiming to make sure students understand major types of extreme weather. Notes:
- (1) Answers will obviously vary with location. Try to be sure students realize, for example, that hurricanes pose danger near the coast but not deep inland, and that they tend to occur in summer and fall when temperatures are warmer (because the heat provides the energy that drives the storms), not in winter and spring.
- (2) Students may think of many other extreme weather names. Try to help students identify those that are important locally. For example, near the Rocky Mountains, the strong winds known as “Chinook” winds would deserve a mention, and in California you might discuss the relatively common Santa Ana winds.
- (3) and (4) will both depend on current and recent weather conditions.
- (5) If you wish, this question can be extended to have students develop a concrete preparation plan for some type of extreme weather event.
Activity
Extreme Weather Presentation
Choose one form of extreme weather that sometimes occurs in your local region and learn more about it. (A good place to start is with the “Severe Weather 101” web page maintained by the National Severe Storms Laboratory, which discusses many common types of extreme weather.) Based on what you learn in your research, create a brief presentation about this type of extreme weather and how it can affect your local community. You may choose the form of your presentation, such as a poster, a video, a slide show, or a group skit. Be creative, but be scientifically accurate.
This activity gives students a chance to explore a type of severe weather in greater depth. As usual for these types of presentation activity, look for creativity in the student presentations, but also be sure they are clear on the science.
Describing Climate
Remember that climate refers to the average of weather over many years. Generally speaking, we can look at climate in two ways:
- When we speak of the global climate, we are talking about a general average for the whole world.
- When we speak of local or regional climate, we are talking about how the climate in that particular place compares to that of other places around the world.
In the rest of this chapter, we will focus on local and regional climates. (We’ll focus on global climate and how it is changing in Chapter 7.) Because this means comparing a particular place’s climate to the rest of the world, a description of climate generally focuses on the three major factors:
- Temperature: How do average temperatures in the region compare to averages around the world?
- Humidity and precipitation: Is the region generally wet or dry compared to averages around the world?
- Seasonal variation: How does the regional climate vary with the seasons?
Slide Show 6.3.1–10 gives a few examples of these ideas. Use the slide show and the discussion that follows to help you start thinking about ways in which you might describe climate. Then, in the next section, we’ll discuss climate patterns in a little more detail.


Slide Show 6.3.1–10 – These slides show three major factors that we use to characterize local or regional climates.
Discussion
Local Climate Description
Briefly discuss each of the following questions about your local climate.
- Averaged over the whole year, would you say that temperatures in your local region are generally warmer, cooler, or about the same as the average around the world?
- How would characterize your local region in terms of humidity and precipitation? Is your region more prone to flooding or to drought ?
- Describe the seasonal patterns that you experience in your local region.
This discussion will help prepare students for the next section in which we’ll discuss various climate zones around the world. Answers will obviously vary depending on where you live, but try to help guide the discussion so that students come up with an accurate description of the local climate.
- (1) If you wanted to be strictly quantitative, students could in principle look up the local year-round, average temperature (averaged over both day and night) and compare it to the global average temperature (year-round, day/night, over entire world), which is about 15°C (59°F). Note that students may engage in some interesting debate about what “average around the world” might be. However, we suggest that you don’t do this, and instead encourage students to engage in discussion about their general sense of how your region compares. We hope this discussion will get them to start thinking about such things as how much they should factor in nighttime vs. daytime, winter vs. summer, and how much to consider regions (such as Arctic and Antarctic) where very few people live.
- (2 and 3) Similar to above, we suggest you keep the discussion qualitative, so that students think about the local climate in a descriptive sense.