By now, you should understand why scientists are convinced that global warming is happening and that it is being caused by humans. But you also know that Earth can warm and cool naturally. For example, in Section 5.2.2 we discussed the evidence showing that Earth has been cycling in and out of ice ages for about the past 2 million years. Therefore, if we want to understand the danger posed by global warming, we need to know how the current, human-caused warming compares to what has occurred naturally in the past.
The 800,000-Year Climate Record
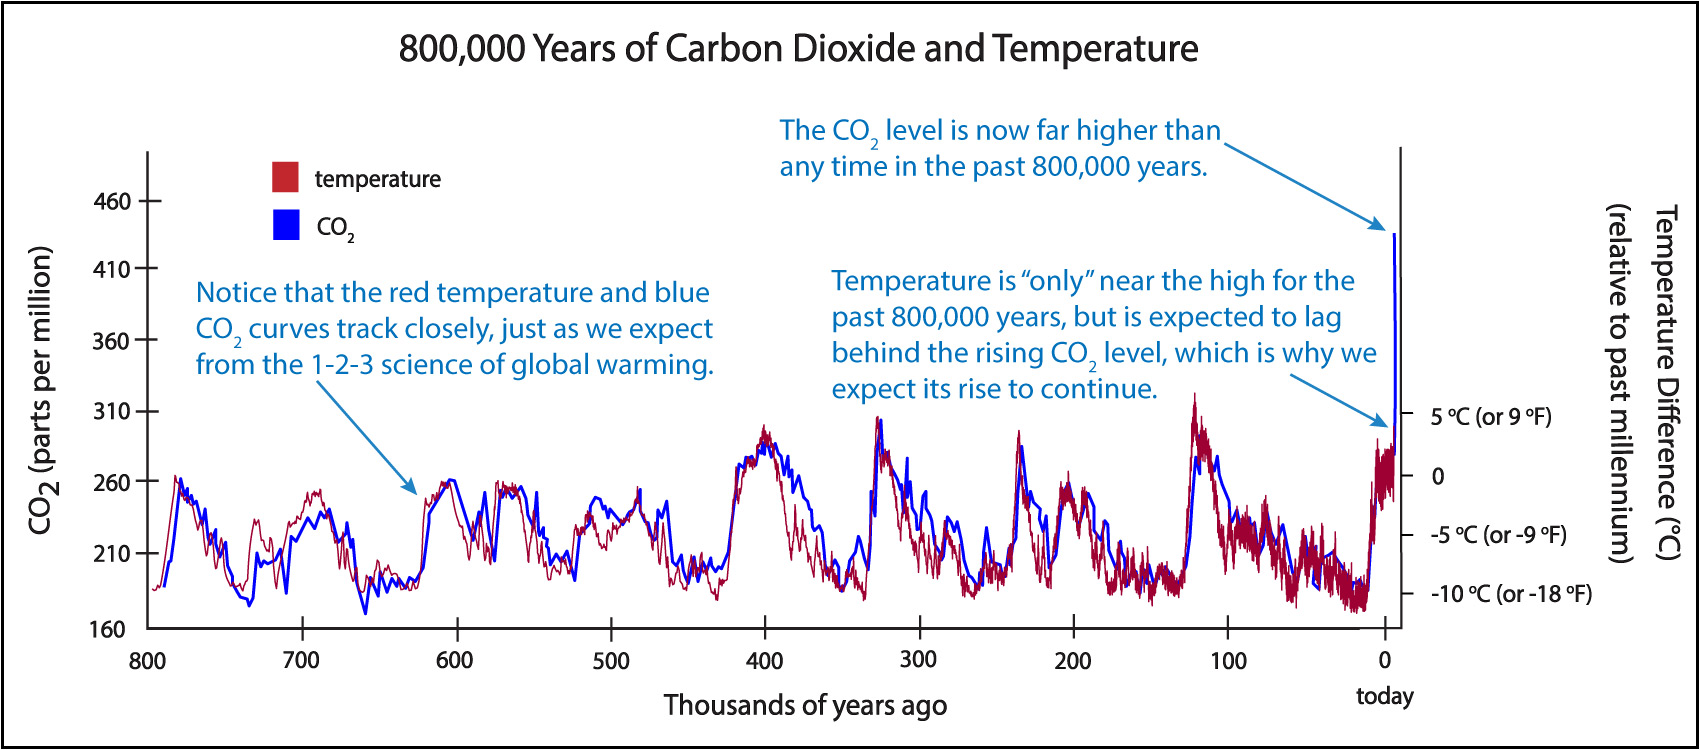
Scientists can study changes in Earth’s average temperature over the past 800,000 years with the same ice cores used to measure past carbon dioxide concentrations. Figure 7.1.4–1 shows the carbon dioxide data that you saw earlier (in Figure 7.1.2-4), but this time with an added overlay showing the temperature data revealed by the ice core measurements. Study the graph carefully, then try the questions that follow to make sure you understand what it is showing.
Before you continue, discuss the following questions about Figure 7.1.4–1 with a classmate, then click to open the answers and see if they agree with what you came up with.
1. Compare this figure to Figure 7.1.2-4. What is the same, and what is different?
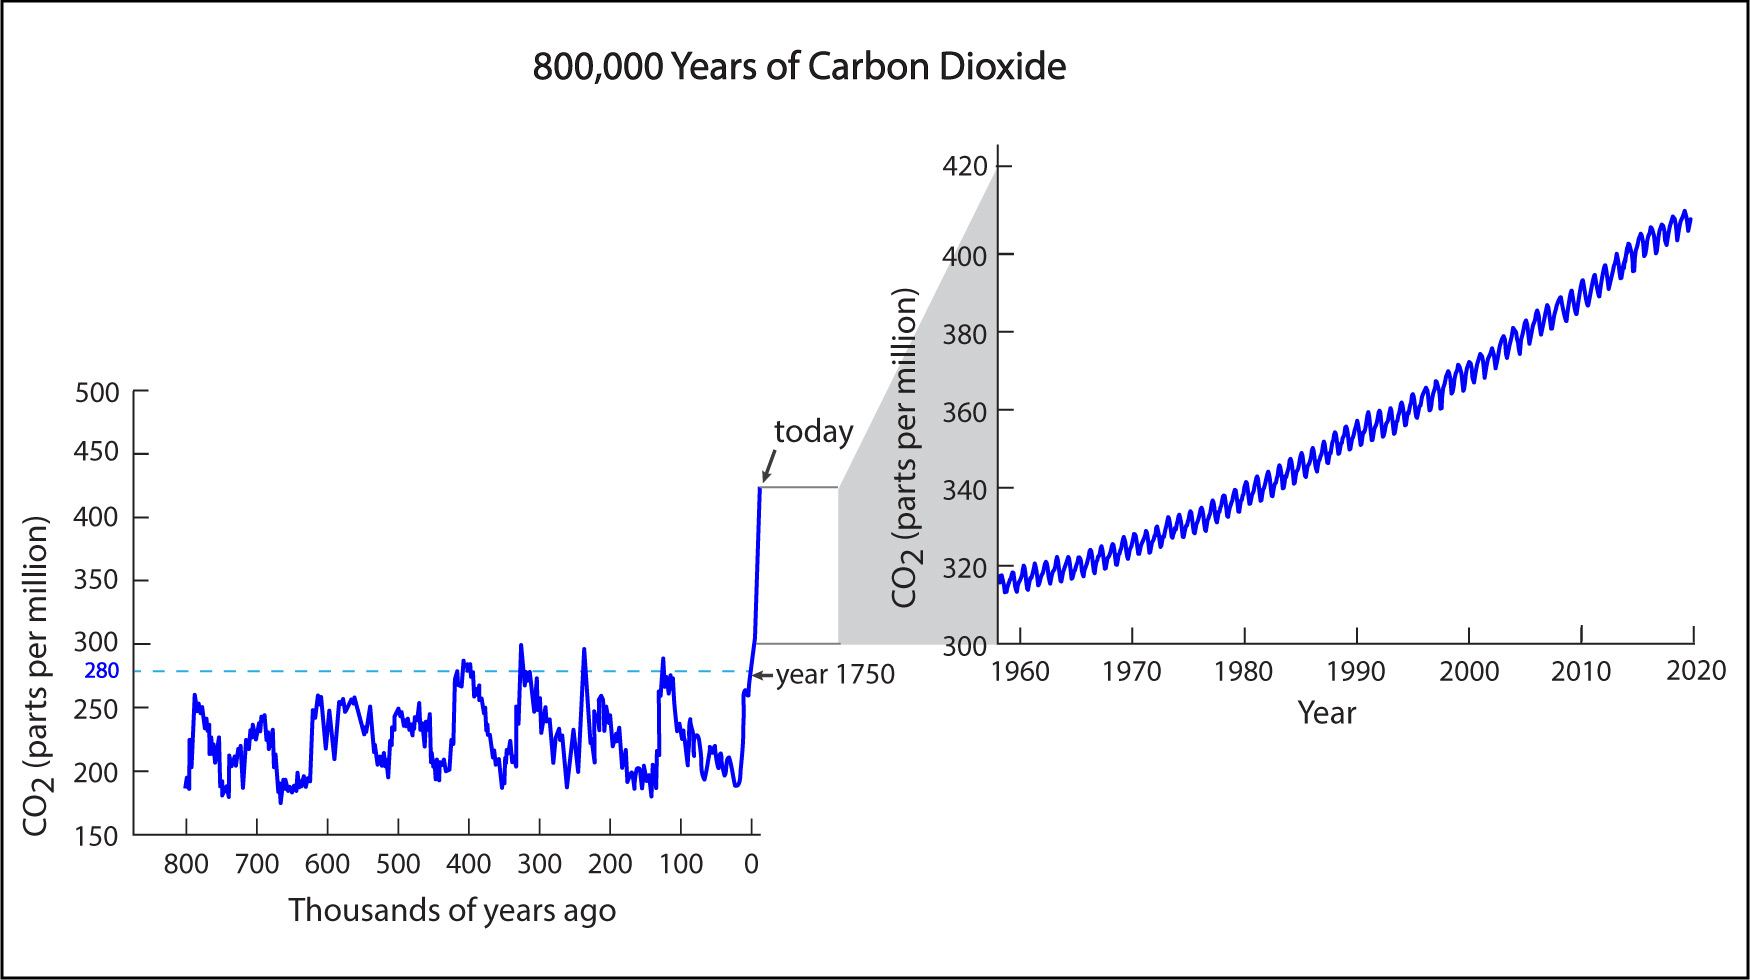
The carbon dioxide data is the same in both figures. The differences are that: (1) this figure also shows temperature data; (2) the prior figure includes a zoomout of the carbon dioxide data since 1958, which is not included here.
2. The graph has three sets of axis labels: one for the x-axis, one for the y-axis on the left, and one for the y-axis on the right. Briefly explain what each one means.
Remember that the data on the graph are based on measurements from ice cores. The x-axis tells us how far back in time we are looking in the ice core: “0” is the present and the numbers (given in thousands of years) increase to the left as we look farther back in time. The y-axis on the left shows us the carbon dioxide concentration, in parts per million, so that goes with the blue curve. The y-axis on the right shows the temperature compared to the average from the past millennium (that is, from the years 1000 to 2000).
3. Find the place on the graph that represents about 25,000 years ago. How did the global average temperature at that time compare to that of the past millennium? Explain how you can read this from the graph.
To find the time of 25,000 years ago, start at the “0” at the far right of the x-axis, then go ¼ of the way toward the label “100” (representing 100,000 years ago). You can read the temperature at this time by using the labels along the y-axis on the right. You will see that the temperature was about “−9°C,” which means about 9°C (or about 16°F) colder than the average from the past millennium.
4. How does the graph tell you when ice ages were occurring? What happens in between ice ages?
The dips in temperature correspond to ice ages. For example, the cold temperatures of 25,000 years ago tell you that Earth was in an ice age at that time. The graph also shows that it tends to become much warmer in between the ice ages (these times are called “interglacial” periods).
5. Notice that the two curves for temperature and carbon dioxide concentration line up almost perfectly with each other. How does that support the 1-2-3 science of global warming that we have discussed?
The 1-2-3 science tells us that more greenhouse gas (such as carbon dioxide) should go with higher temperatures and less greenhouse gas should go with lower temperatures, which is exactly what we see on the graph.
6.(multiple choice) Look closely at the time period during which the most recent ice age ended. About how long did it take for temperatures to climb from their ice age lows to temperatures similar to those of the past millennium? (a) about 50 years; (b) about 300 years; (c) about 6,000 years; (d) about 25,000 years. Explain how you know which choice is correct.
The answer is (c), about 6,000 years. You can tell because the rise in temperature clearly does not go straight up (though the slope is quite steep) and you know that the space from “100” to “0” along the x-axis represents 100,000 years. Therefore, the answer can’t be tens or hundreds of years (choices a or b), because in that case the line would go essentially straight up on this graph. The answer also can’t be choice (d) of 25,000 years, because that would require the slope to be gentler. That leaves choice (c) of 6,000 years as the only answer that makes sense, and if you look closely, you will see that it is correct .
There’s just one more fact that you need to know in order to understand why the 800,000-year climate record makes scientists so concerned about human-caused global warming:
- Detailed studies of the climate indicate that when the carbon dioxide concentration rises, it takes at least a few decades for the global average temperature to rise in response . Therefore, Earth’s temperature is not yet showing the expected effects of the last few decades of the carbon dioxide rise.
This delay between the rise in carbon dioxide and the rise in global temperatures means that our world is already “locked in” to experience some amount of additional warming, even if we were to immediately halt the rise in carbon dioxide concentration. The only way that we could prevent further warming would be if we somehow were able to reduce the carbon dioxide level. That’s obviously going to be very difficult, though it is not impossible, as we’ll discuss in Section 3.3.
Claim-Evidence-Reasoning Activity
Cause for Concern
Consider what you’ve learned about recent (human-caused) global warming along with what we know about past climate change from the 800,000-year ice core record. Then use evidence and reasoning to support or refute the following claim:
Claim: Unless we make major reductions in carbon dioxide emissions, during the rest of this century we can expect the world to warm at a much more rapid rate than has occurred at any other time in the past 800,000 years.
This CER activity is designed to check that students understand why the ice core record of past climate change should make us concerned about what will happen as a result of human-caused climate change. Key points that students should recognize:
- The past temperature swings between ice ages and interglacial warmings have been quite large. So far, human-caused global warming looks small by comparison.
- However, the current rise in the carbon dioxide concentration is much larger than any natural rise in the ice core record.
- Which means that, given the lag time, we might expect a correspondingly large rise in temperature to occur in coming decades to centuries. This is much faster than the natural changes that occur, which students know from question 6 above, in which they saw that it took 6,000 years for temperatures to go from their ice age lows to more modern levels.
- Encourage students to also focus on the included caveat “unless we make major reductions”; again, this is where you can build the “inspiration” message by reminding students that we in principle still have the power to slow or stop the warming trend.
Discussion
Future Carbon Dioxide Levels, Part 3
You’ve already seen (in the activity Future Carbon Dioxide, Part 2) that at the current rate of increase, we will reach double the pre-industrial carbon dioxide concentration (which means reaching 560 parts per million) within a few decades. Does this seem like it should be considered acceptable? If not, what level do you think would be acceptable, and what would it take for us to avoid exceeding that level? Defend your opinions.
This discussion can be a challenging one, since students obviously don’t have the scientific expertise to know exactly what kind of carbon dioxide level would keep global warming to an “acceptable” level. However, since “acceptable” is subjective anyway, we think this activity is a good way to engage students in at least beginning to think about the issue of how much more carbon dioxide we can afford to release. A few notes that may help you in guiding the discussion:
- The Intergovernmental Panel on Climate Change (IPCC) says that we need to keep the level below 450 parts per million in order to keep the warming to less than about 2°C in total. This will clearly be very difficult, given the rapid rate at which the concentration is rising.
- Reaching a doubling (560 ppm) will mean a much greater temperature increase, likely in the range of 3°C to 5°C.
Note: As usual for U.S. students, you might want to convert to Fahrenheit, pointing out that a rise of 5°C means a rise of 9°F, which is quite substantial. - Climate scientist James Hansen and colleagues have calculated that to return our planet to the state it was in before human-caused global warming, we would need to bring the level back down to under 350 parts per million. This would obviously require both stopping the current rise and developing technologies to pull carbon dioxide back out of the atmosphere.
- Students may have varying opinions of what is “acceptable,” so try to steer them toward defending their opinions with evidence and reasoning.
Climate in the More Distant Past
It’s more difficult to learn about the climate in the more distant past, but scientists have a number of different ways to make good estimates for different times. For example, as we discussed briefly in Section 5.4.1, geological evidence points to at least three very deep “snowball Earth” ice ages having occurred more than 580 million years ago. Earth was much colder during these snowball Earth periods than at any time during the ice ages of the past couple million years.
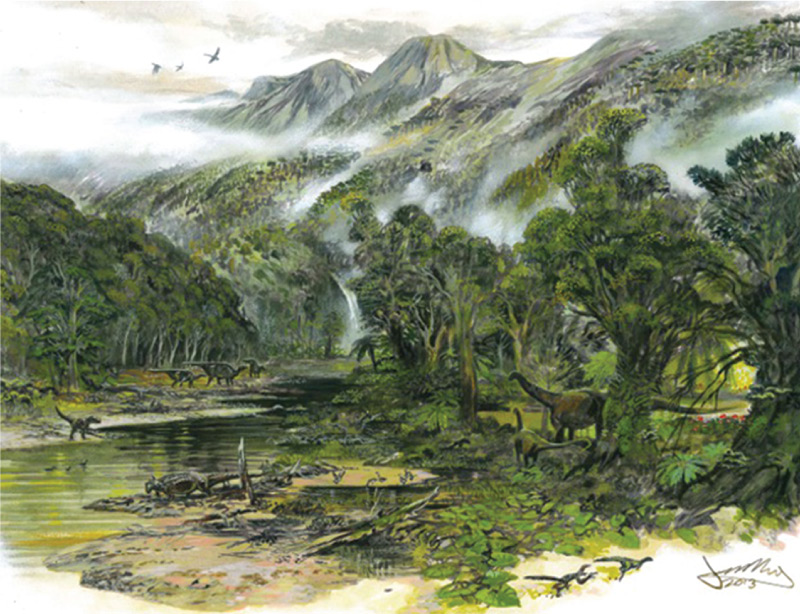
In a similar way, Earth has often been much warmer in the more distant past than it is today. For example, during much of the time that dinosaurs lived on Earth, evidence indicates that the carbon dioxide concentration was near or above 1,000 parts per million, and this made temperatures so warm that there were no ice caps in either the Arctic or the Antarctic (Figure 7.1.4–2).
Some people have used the fact that Earth has been much warmer in the past to claim that this means the current global warming is no big deal. However, by now you should recognize that the speed at which global warming occurs is very important. In particular:
- Most natural warmings have occurred over time periods of many thousands to millions of years, which means there is plenty of time for species to migrate and adapt to these changes.
- The only cases in which warming (or cooling) is known to have occurred much faster have been associated with mass extinctions (such as the end-Permian extinction) that wiped out much of the life on Earth at the times.
The lesson should be clear: If we continue to warm our planet at our current rate, we can expect devastating consequences to species and ecosystems. So as we begin to look (in the next section) at the types of consequences we are already experiencing, keep in mind that the evidence from the distant past shows that things could get far worse.
Claim-Evidence-Reasoning Activity
Lessons from the Past
Although some people have tried to claim that the studies of natural climate change should make us less fearful of global warming, most climate scientists think the opposite. That is, they see the lessons of the past as a warning that we must get off our current path of rising carbon dioxide levels, so that we can slow or stop the global warming trend of recent decades. Think about what you’ve learned about how the current rise in carbon dioxide and the current warming compares to past natural changes in the climate. Then use evidence and reasoning to support or refute the following claim.
Claim: Careful study of past natural climate change offers lessons that should make us act with urgency to slow or stop the current global warming trend.
This CER activity essentially has students consider what the past lessons mean. As we’ve noted, many “skeptics” have used the existence of natural climate change in the past to imply that current concerns are overblown, but most climate scientists think the opposite. This CER activity asks students to support or refute the scientists’ position. We hope they will recognize that it should be supported. A few notes:
- Students should consider both the 800,000-year ice core record and our brief discussion above about climate change in the more distant past.
- For the ice core record, students should point out that changes in the CO2 concentration that are much smaller than the change since 1750 have led to huge swings in temperature. This fact therefore implies that we are on the verge of causing a similarly large swing in temperature if we continue on our current path. In other words, the lesson from the ice core record is that we are treading on very dangerous ground.
- The longer term changes can be interpreted similarly, but students might in particular focus on the way the end-Permian extinction is thought to have been tied to extreme global warming (as we discussed in Chapter 5). This also seems to be a warning about how bad things could in principle get.
- It is possible that you will have some students who will choose to refute the claim. This is not “wrong,” since lessons of the past can be interpreted in different ways. However, they will have a hard time citing any legitimate evidence and reasoning for refuting the claim, so be sure to challenge them on what they present and grade them on how well they defend their position.
- Finally, be sure to again focus on “inspiration” by pointing out that despite the implied danger, the claim is clear that if we “act with urgency” then we can create a much better future.
Claim-Evidence-Reasoning Activity
Melting the Polar Caps
Use evidence and reasoning to support or refute the following claim:
Claim: If we continue to add carbon dioxide to Earth’s atmosphere at the current pace, within a couple of centuries we may have set in motion a temperature rise that would completely melt the polar ice caps.
This is a challenging CER activity because even scientists don’t know the full details, but the geological evidence makes clear that the claim should be supported as follows:
- As discussed above, evidence shows that a carbon dioxide concentration of 1,000 parts per million should certainly lead to an ice-free world.
Note 1: The level that leads to full melting might be significantly lower than 1,000 ppm, but no one knows for sure. In fact, some scientists suspect we may already be at a carbon dioxide level that would eventually lead to full polar melting.
Note 2: The claim says “set in motion” because it will take time for the ice to melt. In fact, most scientists suspect that full melting would take centuries to millennia, no matter how rapidly the temperature rises.
Note 3: Complete polar melting would cause sea level to rise about 70 meters (240 feet). - Although 1,000 parts per million is far above the current level, students have already seen (in earlier activities) that we are on a pace that is rapidly pushing the concentration upward. Depending on the precise assumptions used about the future pace, our current path (assuming continued use of fossil fuels) could have us reaching that level before about the year 2200, and we would almost certainly reach it by 2300.
- Therefore: without major changes, within a couple of centuries the carbon dioxide level will reach the level at which Earth has been ice-free in the past, so it would seem that by then we would have set in motion the processes that would ultimately lead to complete melting.