The discovery of plate tectonics did much more than just remove the objections to Alfred Wegener’s hypothesis of continental motion: It provided an explanation for virtually all of Earth’s major geological features. That is why the title of this section (Section 5.3) called plate tectonics “the unifying theory of Earth’s geology.” We are now ready to see how this one unifying theory ties together many different ideas we’ve already discussed.
Mapping the Plates
Long before Wegener advanced the idea of continental drift, people had already recognized that earthquakes and volcanic eruptions are particularly common in a horse-shoe shaped band that roughly surrounds the Pacific Ocean. Figure 5.3.2–1 shows this region, commonly called the “ring of fire” . You probably already realize that this “ring” is outlining plate boundaries, but careful study of the earthquake data shows even more.
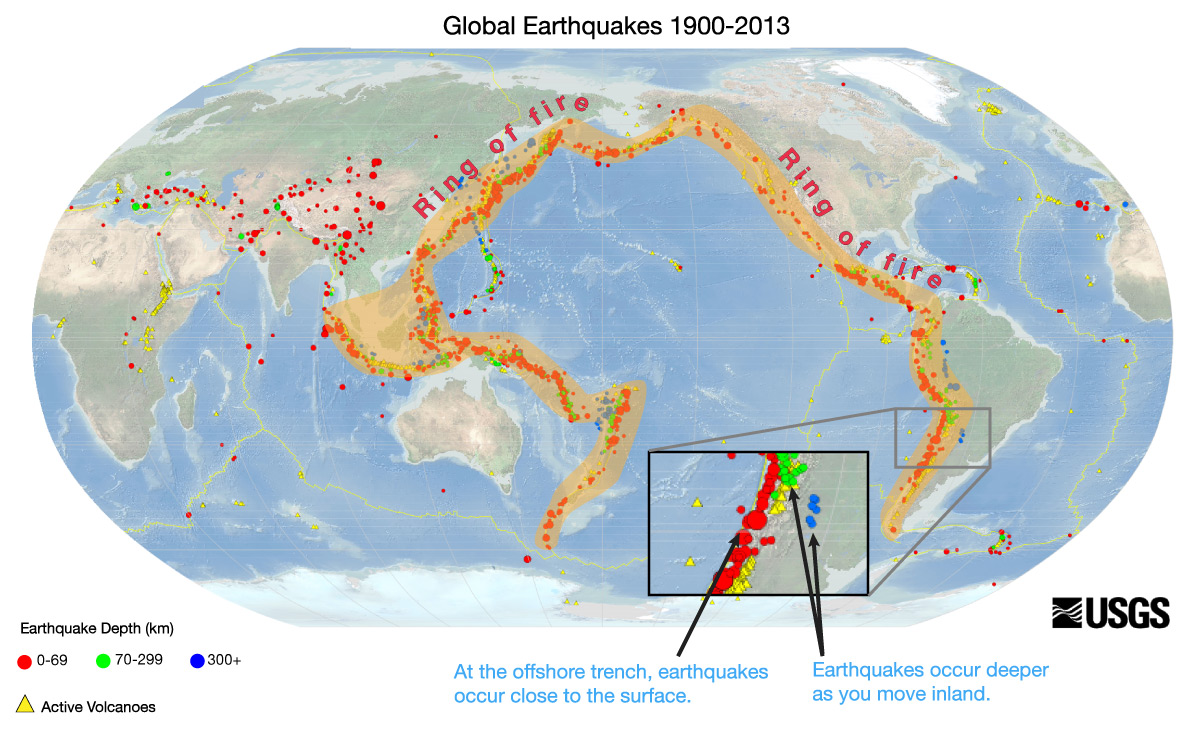
In particular, the map of Figure 5.3.2–1 shows a clear pattern in the depths at which earthquakes occur. For example, if you look at the region of South America shown in the inset, you’ll see that earthquakes increase in depth as you move inland. Try the following questions to help you understand why this pattern occurs.
Discuss the following questions with a classmate. Then click to open the answers to see if they agree with what you came up with.
- The red dots in Figure 5.3.2–1 indicate the shallowest earthquakes (those that occur close to the surface). As you look in the ocean just off the coast of South America, what geographical feature are these red dots tracing? (Hint: review Figure 4.11.)
The red dots are lining the Peru-Chile trench.
- Now look at the green dots, which mark deeper earthquakes, that are located slightly inland in South America. What feature are they tracing?
The green dots are tracing the Andes mountain range.
- The map also shows some yellow dots tracing the same path as the green dots. What are those?
The key tells that the yellow dots are active volcanoes; these are some of the many active volcanoes of the Andes.
- From earlier in this chapter, you already know what is happening in this region of the world that can explain the earthquakes and active volcanoes. What is it? (Hint: review Figure 5.2.2–3a).
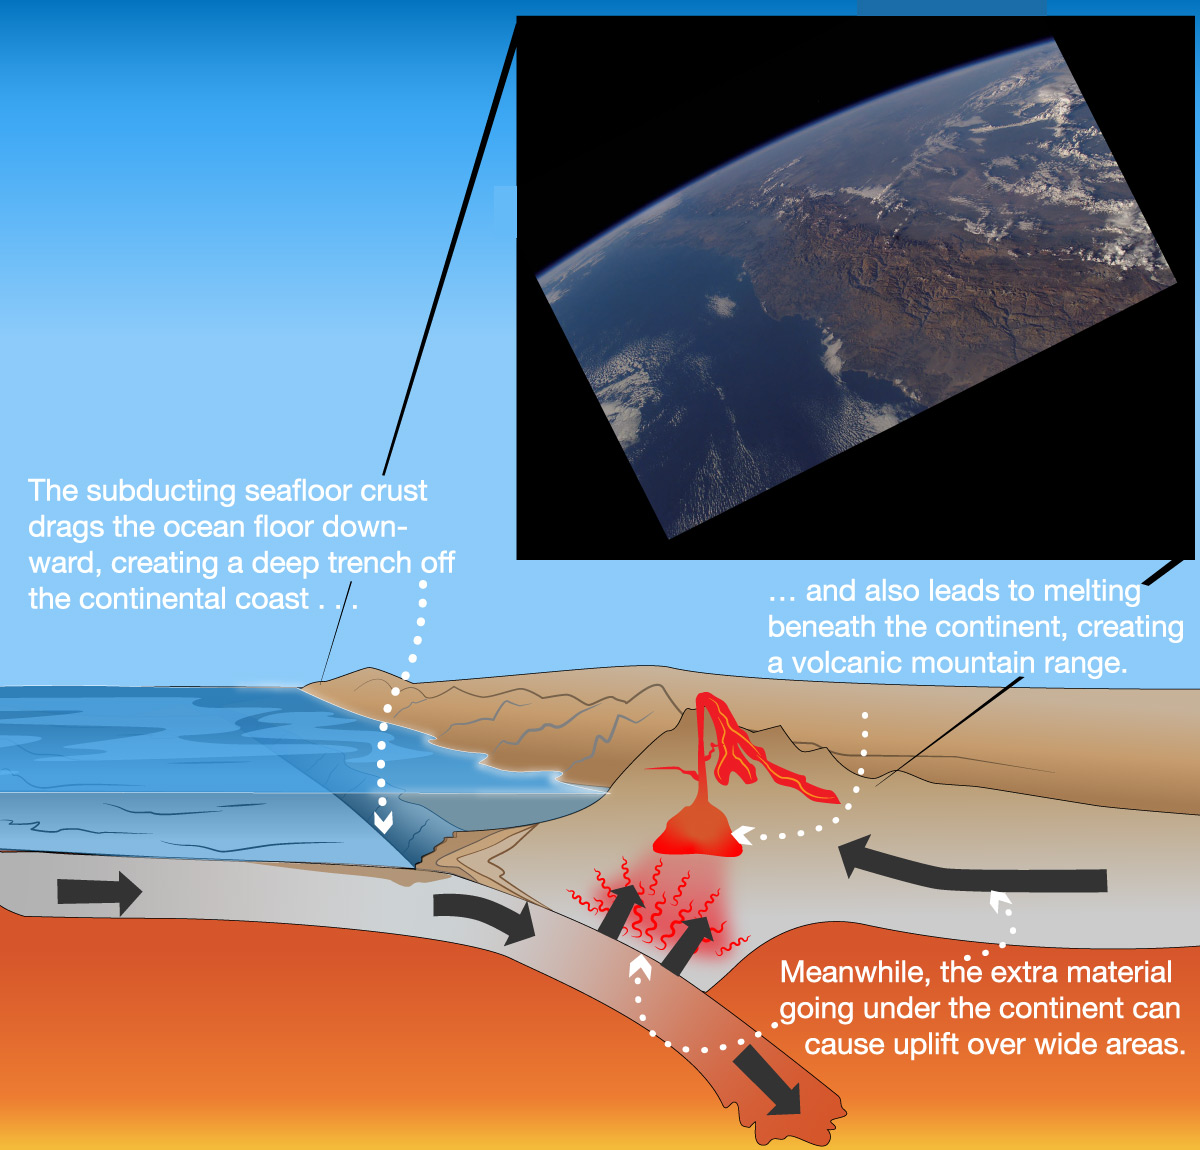
The seafloor is subducting under the continent of South America in this region. The Peru-Chile trench marks the place where the subduction first occurs, and Figure 5.2.2–3a shows how this leads to the uplift (and volcanic activity) that created the Andes mountain range.
- The blue dots, which indicate the deepest earthquakes, occur even farther inland. Looking back at Figure 5.2.2–3a, do you see anything that can explain the pattern in which earthquake depth increases as you move inland?
Yes! As you can see in Figure 5.2.2–3, the subducting plate dives deeper beneath the continent as you move inland, which matches the pattern of the earthquake depths.
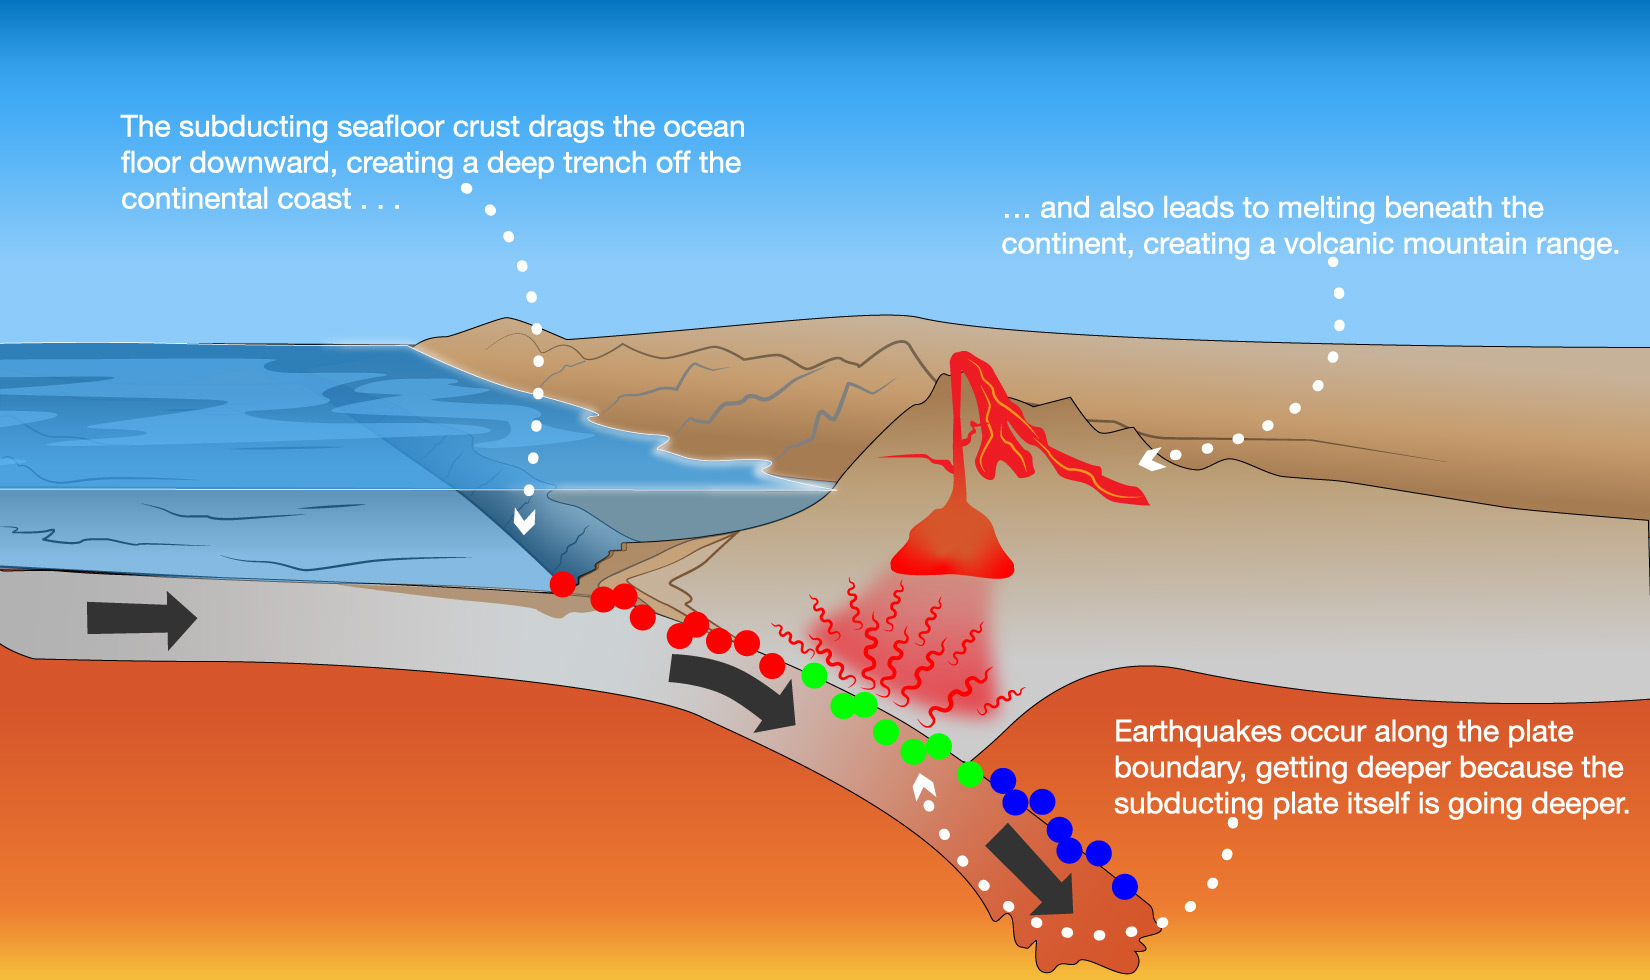
If you’ve answered the above questions successfully, then you’ll see that your answers are all summarized in Figure 5.3.2–2. The earthquakes all occur along the plate boundary, and because the seafloor plate is angling downward under the continental plate, the earthquakes along it get deeper as you go inland. In fact, the earthquake data played a key role in helping scientists figure out that one plate was subducting under another, because it essentially gave them a 3-dimensional map of what the plate boundary looks like underground.
Discussion
Mapping Subduction Zones
Discuss the following questions in small groups or as a class.
- Imagine that you did not already know that a seafloor plate is subducting under the continent of South America. Briefly explain how the earthquake data shown in Figure 5.3.2–1 would tell you that subduction is occurring.
- Now look around the rest of the Pacific by comparing the earthquake data of Figure 5.3.2–1 with the map in Figure 4.11 showing the locations of ocean trenches and associated mountain ranges and island arcs. Do you see similar patterns that can be explained by subduction? Give at least two examples.
This discussion will help you check whether students have really absorbed the ideas we’ve been discussing. Notes:
- (1) This question is really just asking students to explain (in their own words) the ideas shown in Figure 5.3.2–2 above: namely, that the earthquake depths are providing us with the ability to “see” the subducting plate going underground.
- (2) Here, students should recall the connection between trenches and mountain ranges and island arcs as we’ve already discussed, and recognize that in all these cases we see the same pattern of earthquake depths as you move away from a trench. For their two examples, they could cite any of the trenches shown in Figure 4.11.
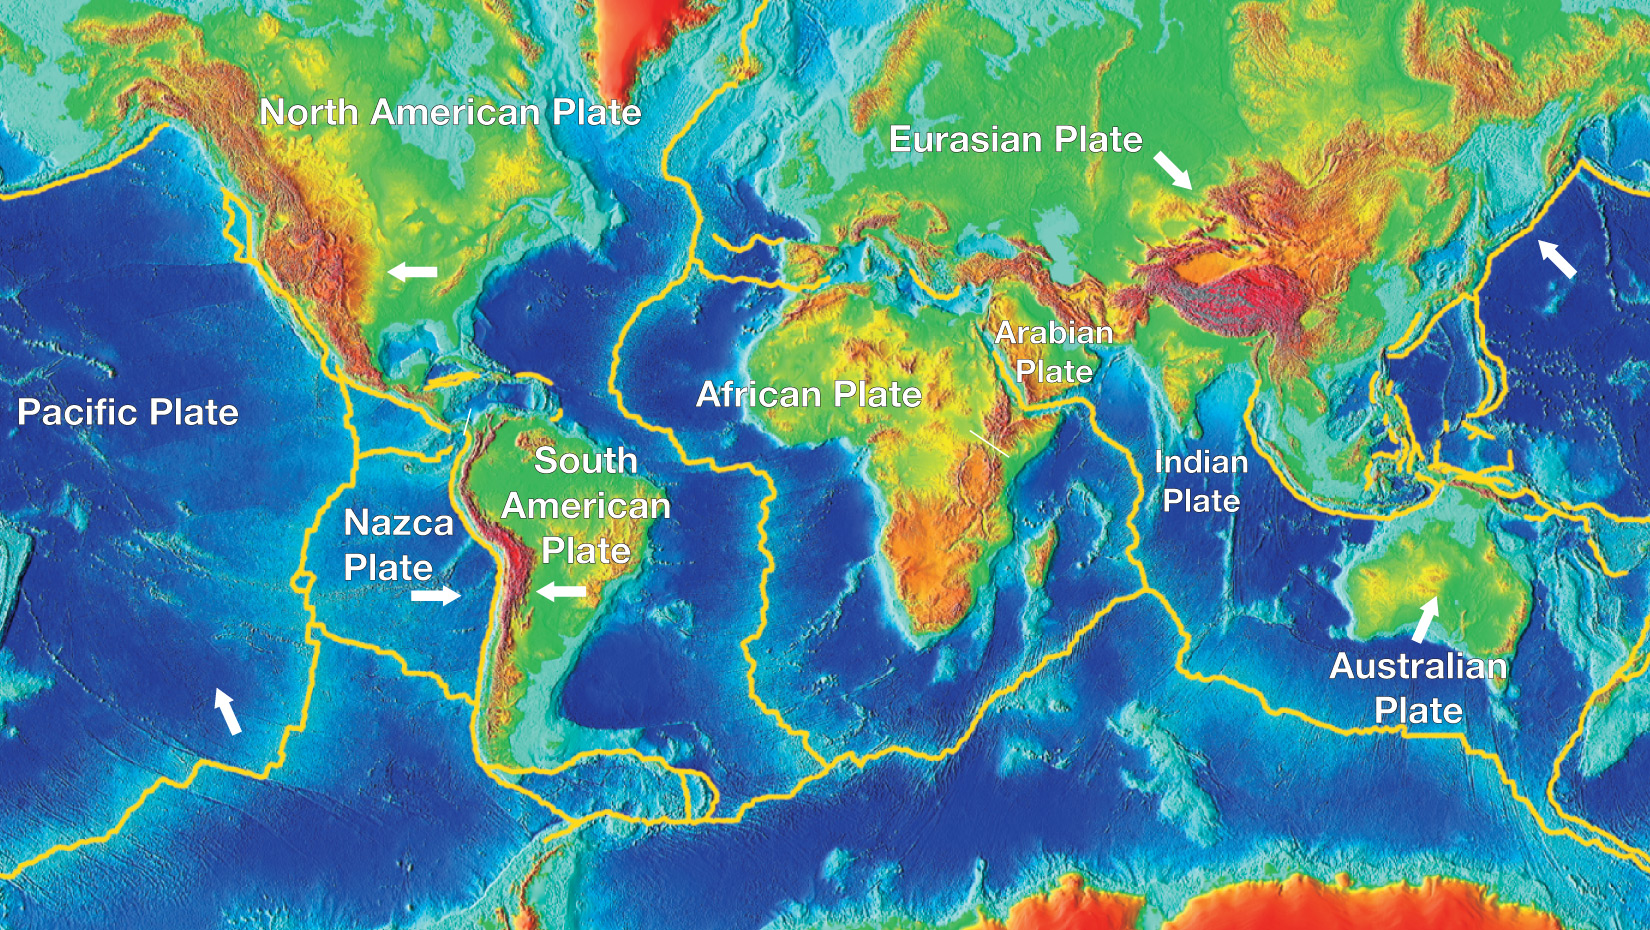
You should now understand how earthquakes can help scientists map out subducting plates. Similar methods have allowed scientists to make fairly complete maps of all the world’s plates. Moreover, GPS measurements have allowed scientists to measure the directions in which the plates are moving relative to one another. Figure 5.3.2–3 shows the boundaries of major plates , along with their names and their general directions of motion.
Discussion
Home Plate
Find your location on the plate map in Figure 5.3.2–3. What plate do you live on? Where will your plate be going (relative to other plates) over the next few million years?
This should be a very short discussion in which students identify the plate on which you live and briefly note how it is moving relative to other plates.
Mantle Convection and Plate Motion
The discoveries we’ve discussed leave no doubt that the continents really do move around with their plates. But what drives the motion? Recall that there are only two major energy sources for Earth: (1) energy from the Sun and (2) energy from Earth’s own internal heat. There’s clearly not enough solar energy to move entire continents, so the energy source must be Earth’s internal heat.
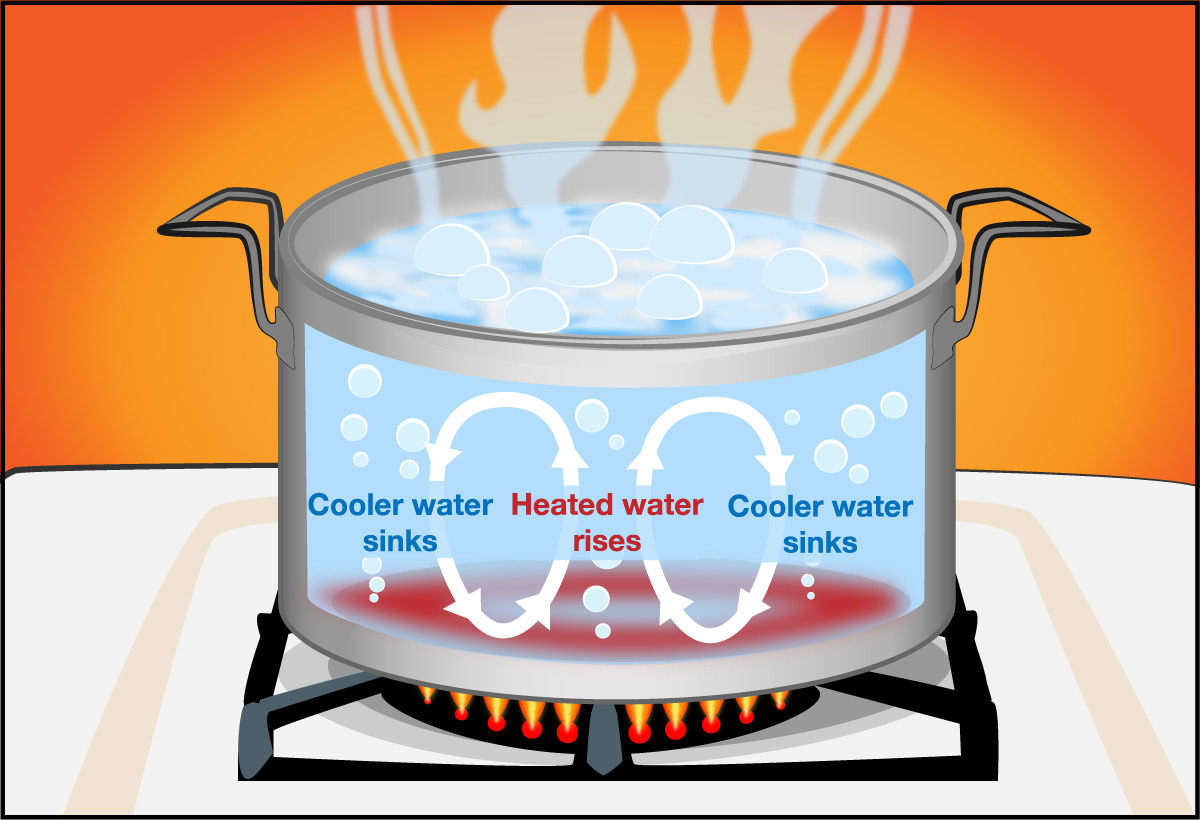
More specifically, geologists have traced the source of the energy that moves the plates to heat rising up toward the crust through the process of convection in Earth’s mantle. You are probably familiar with the idea of convection, even if you have never heard the term before, because it happens anytime you heat a pot of water. Figure 5.3.2–4 shows how it works:
- Heating from below the pot makes the water at the bottom hotter than the water above it. Water expands slightly when it is heated, so this hotter water rises upward, while the denser, cooler water above sinks downward.
- The cooler water that sank downward then heats up when it reaches the bottom of the pan, while the hot water that rose begins to cool at the surface, so that the cycle continues.
- If you could see the density and temperature differences in the water, you’d see that the pot would have little “loops,” called convection cells , of rising and falling water (like those shown in the figure).
- The overall process of convection carries energy upward, because it is continually carrying heat (which is a form of energy) upward.
Convection is very common in nature, because it can occur almost any time there is strong heating at the bottom of some layer of material. For example, in Chapter 6 we’ll discuss how solar heating of the ground drives convection of air in the atmosphere. Here, we are interested in convection in Earth’s mantle, which occurs because the mantle is being heated by the even hotter core beneath it. Just as in the pot of water, the convection occurs in convection cells that essentially represent loops of rising hot material and falling cool material (Figure 5.3.2–5).
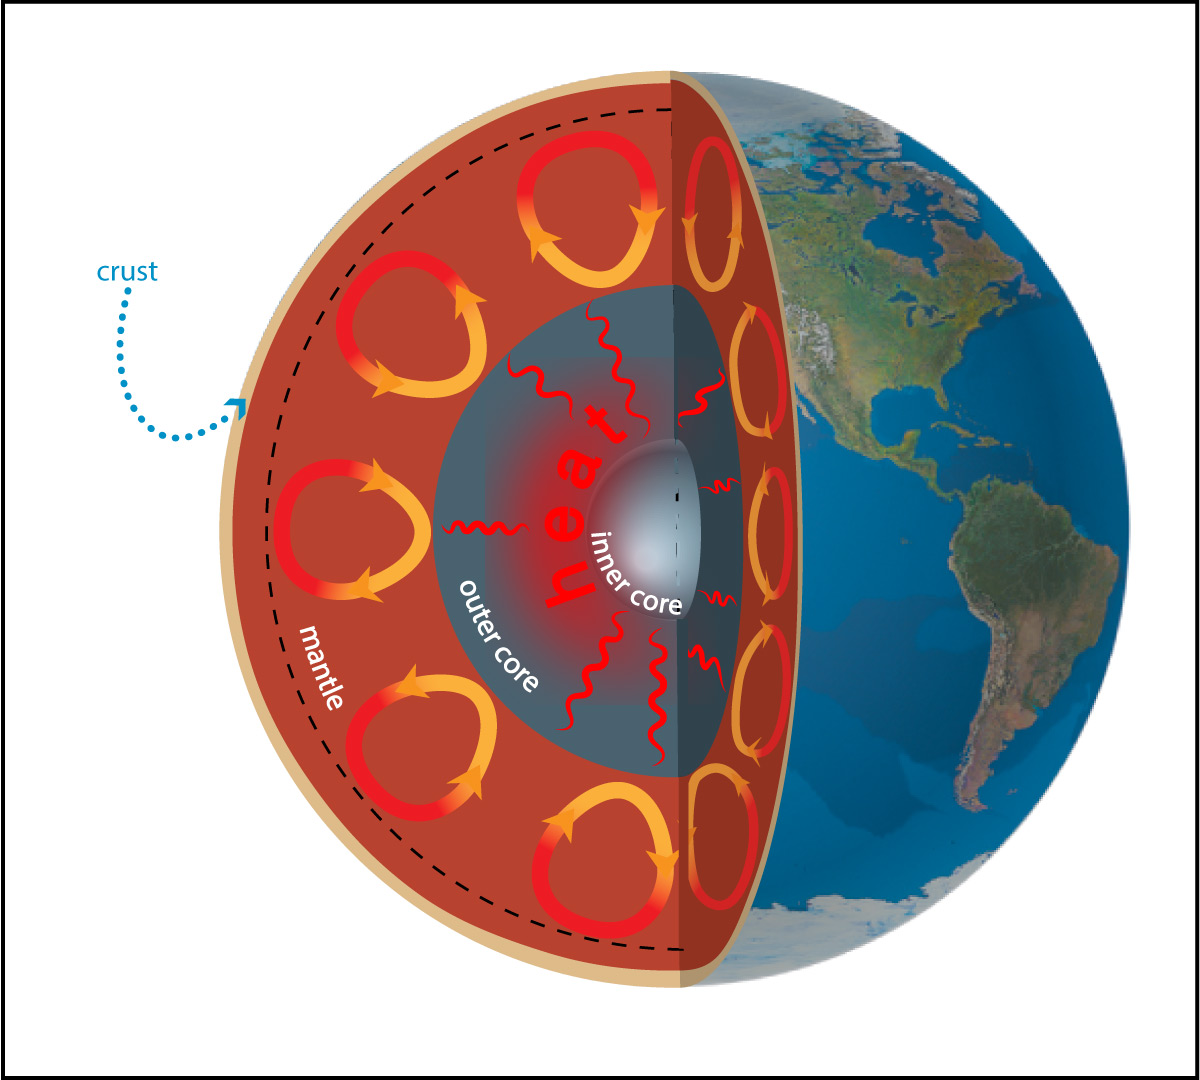
The major difference between convection in a pot of water and in the mantle is speed. Because water is liquid, convection can circulate it quite quickly. In contrast, remember that the mantle is made of solid rock, and while it is possible for solid rock to flow (see Section 3.4.3), it flows very slowly. At the typical speed of mantle convection, it would take a piece of rock approximately 100 million years to rise from the base of the mantle to the top.
The plates are essentially “floating” on top of the mantle and move around as the mantle convects. The slow rate of convection of mantle rock therefore explains the slow rate of continental motion.
Activity
The Speed of “Drifting” Continents
Work in small groups to do the following.
- Find South America and Africa on a globe or map, and look at how they once fit together in Pangaea. Using the map or globe scale, estimate how far South America and Africa have drifted apart since that time.
- GPS measurements show that South America and Africa are moving apart at a rate of about 4 centimeters per year. Assuming that they have been moving at this same rate since they were together, how long did it take them to “drift” to their current locations?
- Fossil evidence shows that South America and Africa became separate continents by about 110 million years ago. Is this consistent with your answer from Step 2? Explain.
- Explain how your answer above supports the scientific theory of plate tectonics.
This activity is designed to help students see how the GPS speeds of plate motion are consistent with fossil evidence of the breakup of continents. It uses some math that students should be familiar with by now, but you may still need to help them with it. Notes:
- (1) The distance is approximately 4,500 kilometers, though depending on how they measure they might get anything between about 4,000 and 5,000 kilometers. If they are getting something outside this range, be sure that they are correctly measuring between points that were once connected, such as eastern Brazil and the region of Africa near Cameroon.
Note: One good way to do this part is to have students use a piece of string and a globe. They should first stretch the string around the globe to measure the globe circumference, then use the fact that Earth’s circumference is about 40,000 km to determine the string scale. E.g., if you have a standard globe, its circumference will be about 95 cm, so the scale for the string would be approximately 1 cm = 420 km. Then, if students find the string length between South America and Africa to be 10 cm, they’ll calculate a “drift distance” of 4,200 km. - (2) For this part, students will need to convert the distance to centimeters and then recognize that time = distance/speed. E.g., if students found a distance of 4,500 km above, this converts to 450,000,000 cm, and dividing by 4 cm/yr gives a time of 112.5 million years.
- (3) The time calculated in (2) is unlikely to be an exact match to the 110 million years, but students should recognize that it is “close enough” to count as being consistent, since the calculated time was based on an estimated distance and speed, as well as an assumption of constant speed, which is not fully realistic.
- (4) The fact that GPS measurements of the separation speed lead to a calculated separation time that agrees with the fossil evidence provides strong support to the theory of plate tectonics.
- Note: If you look up breakup date and spreading rate for South America and Africa, you will find there are considerable uncertainties in both. Here, we’ve used approximate ages and rates from Müller et al (2008).
Three Types of Plate Boundary
If you look at the convection cells in Figure 5.3.2–5 (and remember to think in 3 dimensions instead of only the 2 dimensions that are shown), you’ll realize there are three basic types of boundary that can occur between plates, all shown in Figure 5.3.2–6:
- Figure 5.3.2–6a shows a convergent plate boundary (converge means “to come together”), which is a place where mantle convection is pushing two plates into a collision. This forces one plate to subduct under the other.
- Figure 5.3.2–6b shows a divergent plate boundary (diverge means “to move apart”), which is a place where mantle convection is pulling two plates apart. This means that new crust must be emerging to fill in the gap that is opening between them.
- Figure 5.3.2–6a shows a slip-slide plate boundary (more formally called a transform plate boundary), which is a place where two plates are moving sideways relative to each other. This creates a slip-slide fault , like the San Andreas fault (see Figure 5.2.3–4).
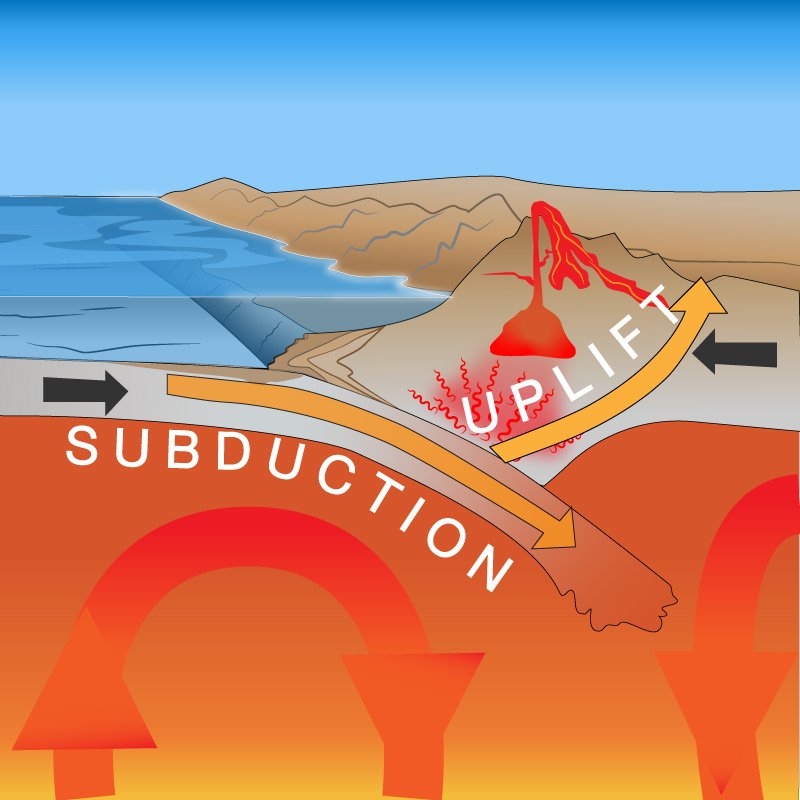
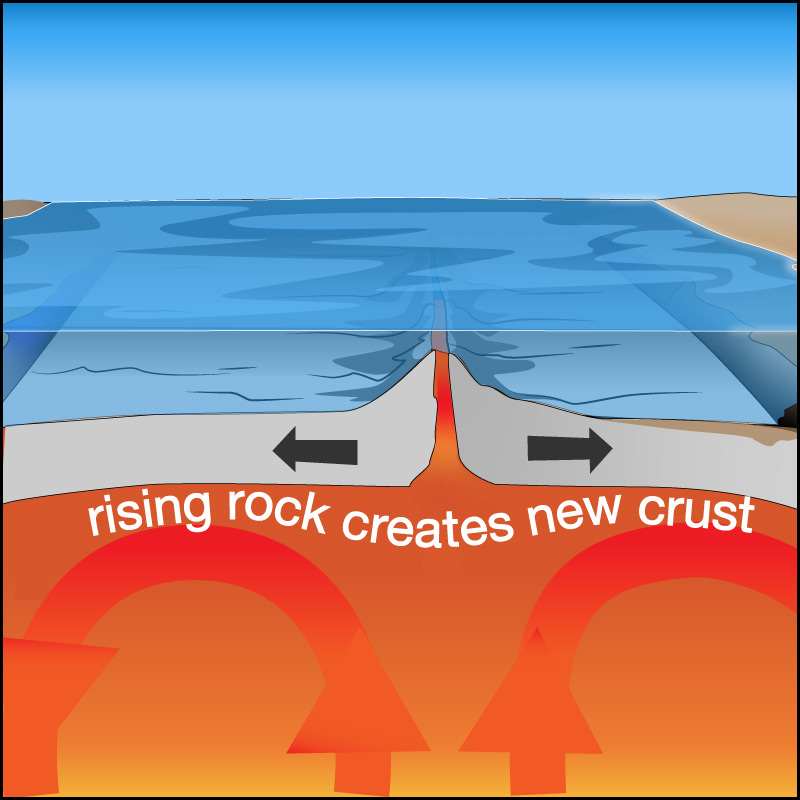
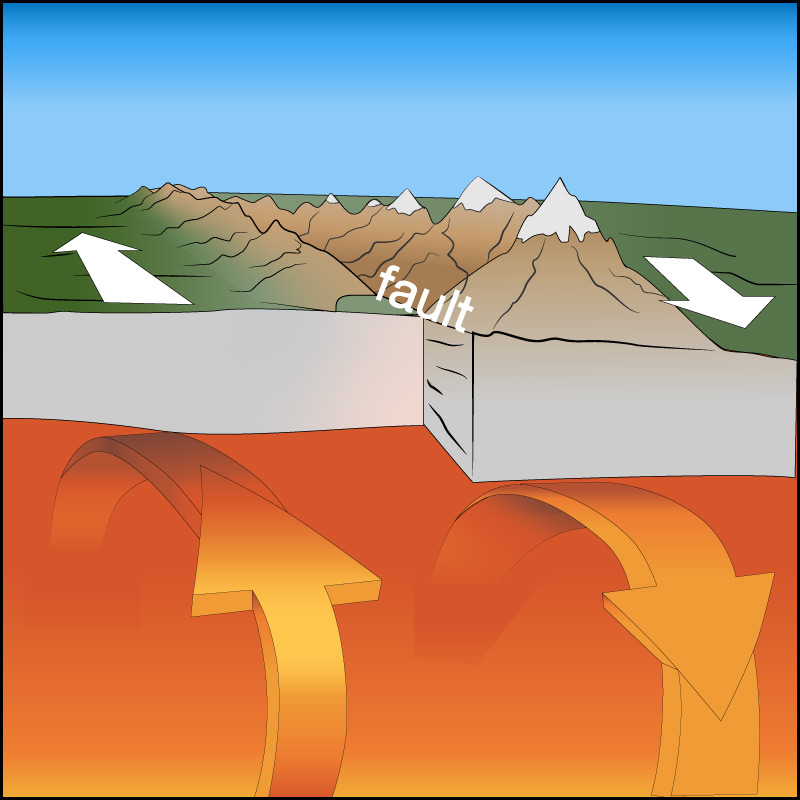
Figure 5.3.2–6 – These diagrams show the three general types of plate boundary. Credit: Zofostro Science.
Discussion
Plate Boundary Examples
You’ve already seen several examples of each of the three basic types of plate boundary shown in Figure 5.3.2–6. In small groups or as a class, identify at least one example of each type, and decide whether it involves seafloor crust, continental crust, or both. Then look at the plate map and arrows in Figure 5.3.2–3 to identify a few other places where each type of plate boundary occurs.
This goal of this discussion is simply to have students review what they’ve already learned before moving on to the “putting it all together” summary below. Notes:
- For the convergent boundary, we’ve seen examples of (1) a seafloor plate subducting under a continental plate to create a trench and mountain range as in the Andes (Figure 5.2.2–3a); one continental plate subducting under another as in the Himalayas (Figure 5.2.2–3b); and (3) one seafloor plate subducting under another to make a trench and island arc (Figure 5.2.3–11).
- For the divergent boundary, we’ve previously discussed how new seafloor crust emerges at mid-ocean ridges, which involves seafloor crust on both sides of the boundary (Figure 5.2.1–4).
- For the slip-slide boundary, they can point to the San Andreas fault (Figure 5.2.3–4).
- For the plate map, students should recognize that the arrows indicating the direction of plate motion tell them the type of boundary. Arrows pointing at each other indicate convergence, pointing away indicate divergence, and pointed in opposite directions along an edge indicate slip-slide.
Putting it All Together: The Plate Tectonic Conveyor Belt
If we put together all the ideas we’ve discussed, you can now get a clearer overall picture of how plate tectonics works:
- Plates carrying continents are made of thick, lower-density continental crust . They can therefore stay somewhat intact as they move about, explaining the old rocks found on continents.
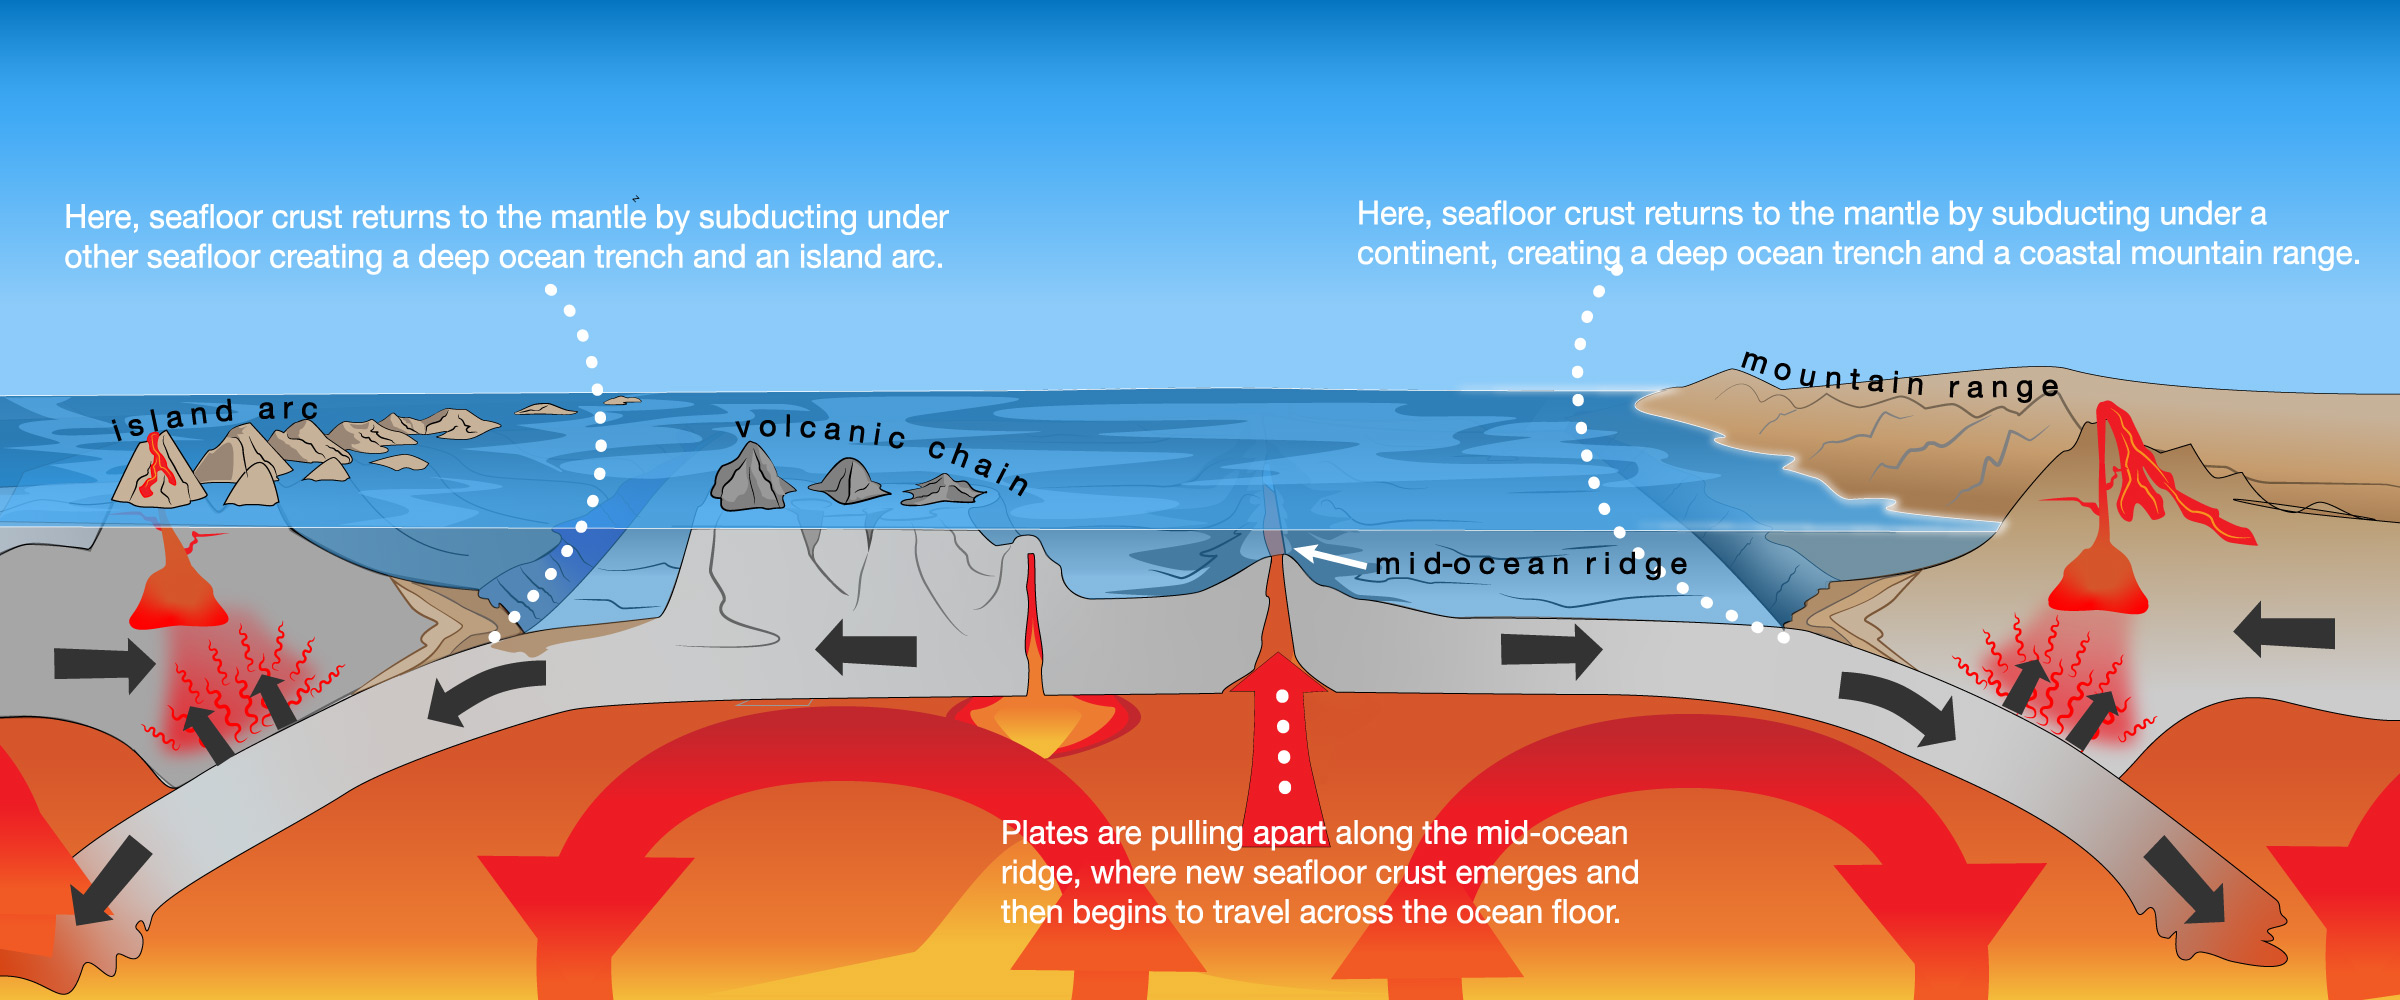
- Seafloor crust emerges at mid-ocean ridges, spreads across ocean, and then is recycled back into the mantle by subducting under either a continent or another seafloor plate.
The overall action of plate tectonics is somewhat like a giant conveyor belt that constantly brings up new rock from the mantle and recycles it back into the mantle later. Figure 5.3.2–7 shows this general idea. Keep in mind that this figure shows only the aspects of plate tectonics that recycle mantle rock around the oceans. We’ve also seen a few other examples of the ways in which plate tectonics operates, including slip-slide faults and the collision of continental plates that made the Himalayas, summarized in Video 5.3.2–8.
Video 5.3.2–8 - This short animation shows how the plate carrying India collided with Asia, creating the Himalayas. Compare to Figure 5.2.2–3b. Credit: Courtesy of Tanya Atwater, in honor of Peter Molnar.
Claim-Evidence-Reasoning Activity
Plate Tectonics as the Unifying Theory of Earth’s Geology
Put together all that you’ve learned by using evidence and reasoning to describe how the theory of plate tectonics explains each of the following features of Earth:
- the gradual movement of continents
- the existence of mid-ocean ridges
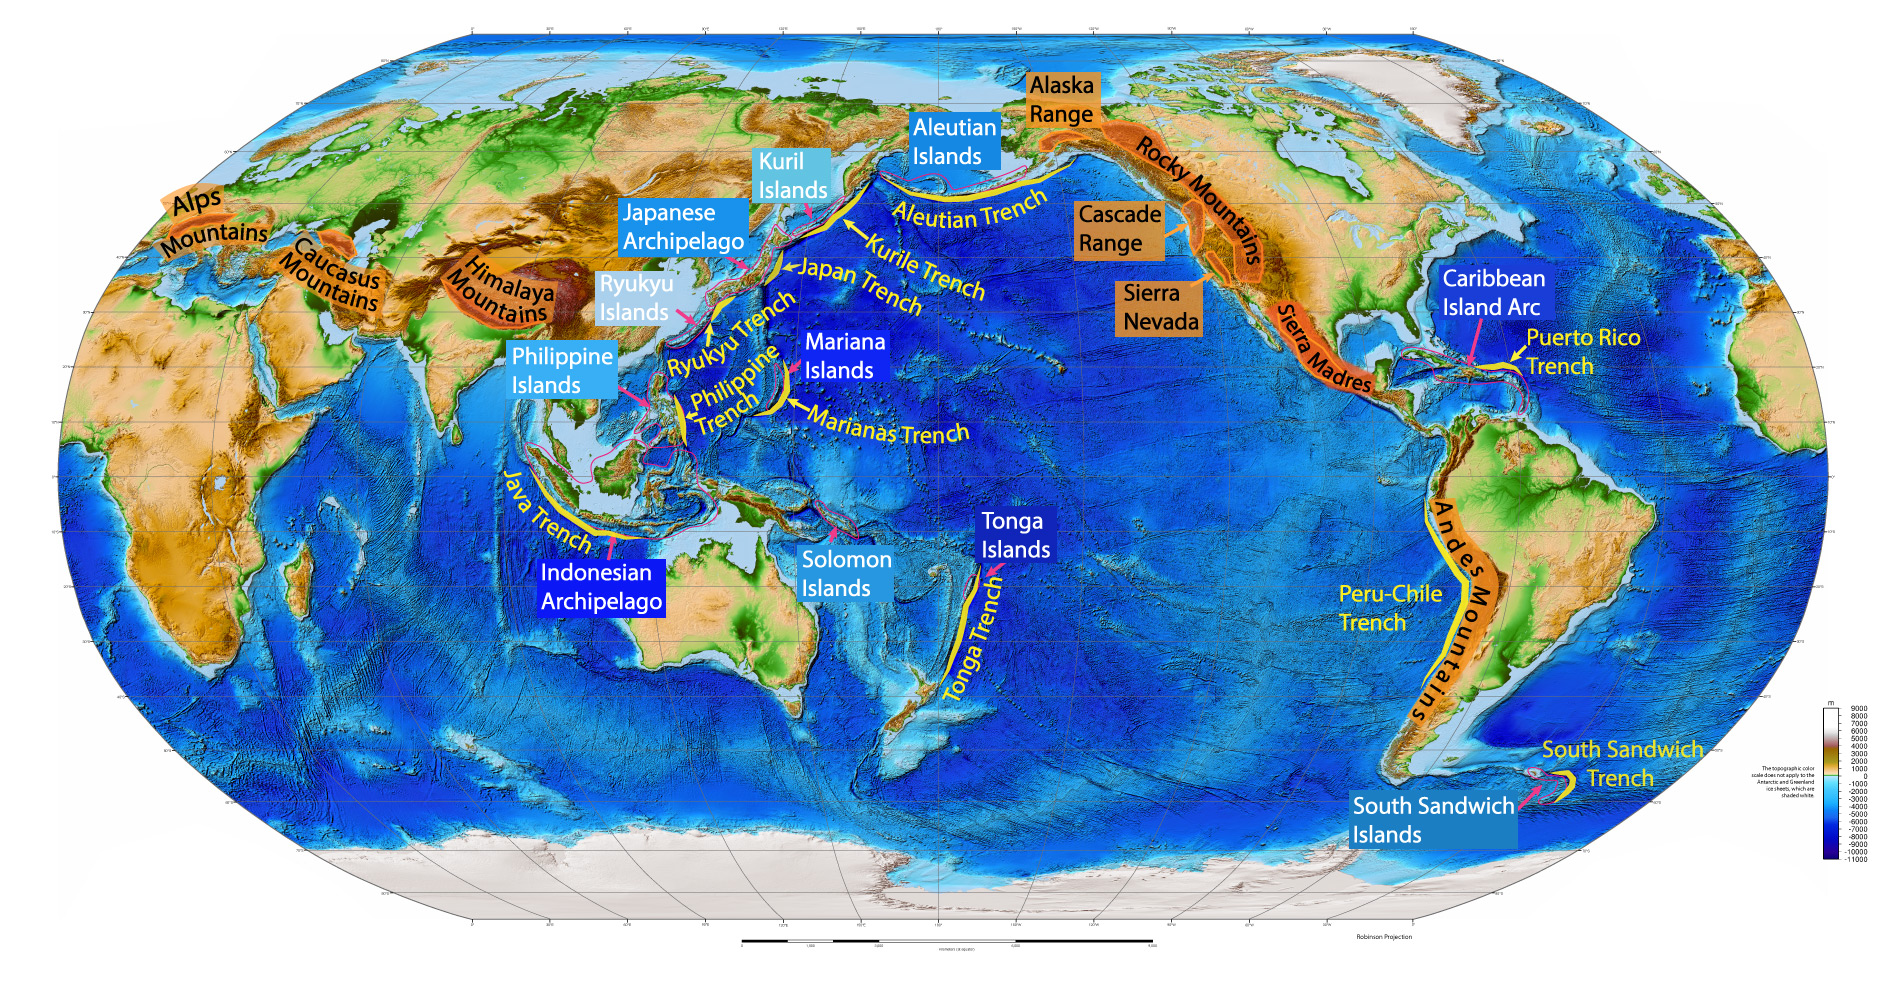
- the association of ocean trenches with coastal mountain ranges and island arcs
- the existence of the Himalayas
- earthquake danger along faults such as the San Andreas fault in California
- Bonus: Would you consider the origin of the Hawaiian islands to be due to plate tectonics? Defend your opinion.
This is a little bit different from most other CER activities, since rather than supporting (or refuting) a specific claim, we are asking students to use their evidence and reasoning to explain the existence of particular features. All of the answers have already been discussed, so this is an opportunity for students to demonstrate their mastery. Brief notes on the answers:
- (1) and (2): Students should cite the evidence that continents really do move, then show how seafloor spreading at mid-ocean ridges explains how continents can be pushed apart (or pushed together).
- (3) Students should cite the associations of trenches with mountain ranges and island arcs that they first saw in Figure 4.11, then describe how plate tectonics explains this association with subduction.
- (4) Students should be able to explain the origin of the Himalayas by referring back to Figure 5.2.2–3b.
- (5) Students should be able to explain the slip-slide earthquakes as shown in Figure 5.2.3–3.
- For the “bonus” question (6): This question can be answered either way, so the key is how students defend their opinions. For a “no” answer, the main argument would be that hot spots can exist independent of plate tectonics, as we know from the case of volcanoes on Mars. For the “yes” answer, they would argue that the dominance of plate tectonics in Earth’s geology makes it difficult to separate any major aspect of Earth’s geology — including the hot spots — from the more general context of plate tectonics.
Past and Future Continents
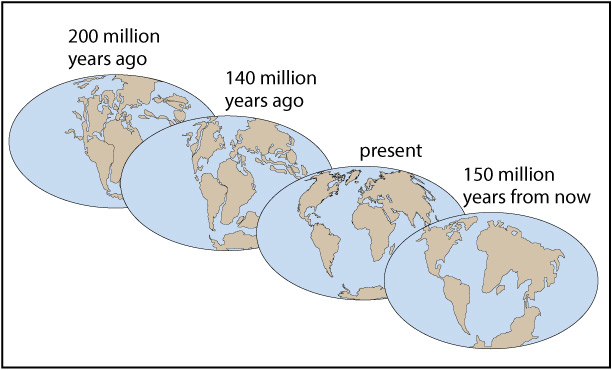
Earth’s plates, and the continents they carry, have been on the move (and sometimes breaking or merging) for billions of years. Careful studies of rocks and fossils have allowed geologists to map the movement of the continents. These studies have revealed that, over hundreds of millions and billions of years, the continents have slammed together, pulled apart, spun around, and changed places on the globe. For example, central Africa once lay at Earth’s South Pole, and Antarctica once was near the equator.
The continents continue to move, and their current arrangement is no more permanent than any past arrangement. We are living at one instant in Earth’s long geological history, and if we had lived at some other time we would have a very different world map. Figure 5.3.2–9 summarizes some of the changes that have occurred to the world map since the time of Pangaea. It also shows what the map is likely to look like some 150 million years in the future, based on current motions of the plates.
Journal Entry or Class Discussion
Reflecting on the Value of Science
For most of human history, most people never considered the possibility that entire continents might move about the Earth over time. Then, in a period of just a few decades (after Alfred Wegner proposed his hypothesis in 1912), the idea of continental motion not only grabbed attention but became an accepted fact in the context of plate tectonics. This, in turn, led to a new understanding of geological phenomena such as earthquakes and volcanoes that has dramatically improved scientists’ ability to help people prepare for and save lives in many geological disasters.
Now, recall that in Section 3.3.3, the authors gave the following three reasons for why science has value:
- Science gives us a way to distinguish possibilities from realities.
- Science provides us with a way of bringing people to agreement.
- Science is the primary driver of technological progress.
Either by writing a journal entry or holding a class discussion, briefly describe how the discovery story of plate tectonics illustrates each of those three reasons. Then reflect briefly on any lessons you think the story of plate tectonics has for people who might wonder if science is really important.
The goal of this activity is for students to recognize how the story we’ve discussed illustrates the methodology and value of science, and to reflect on what it means to them. We list it as either a journal entry or class discussion, depending on whether you prefer that students reflect individually or as a group. You could also do both, first having students write their brief descriptions in their journals, then holding a class discussion in which they together reflect on the value of science. For the brief descriptions of how the story fits the three reasons given by the authors, we hope students will focus on the following:
- “Science gives us a way to distinguish possibilities from realities”: This applies directly to continental motion. As we discussed, numerous people before Wegener had considered the possibility that continents might move over time, and alternative possibilities (such as land bridges or rafting of species) were also considered. By focusing on real evidence, the alternative possibilities were eventually eliminated, and the mechanism of continental motion via plate tectonics was discovered.
- “Science provides us with a way of bringing people to agreement.” When Wegener first proposed his hypothesis in 1912, only a relatively small fraction of other scientists thought it likely to be true. But by continuing study, the evidence eventually became so overwhelming that there is no longer any real doubt that continents really do move as a consequence of plate tectonics.
- “Science is the primary driver of technological progress.” This one can be looked at in at least two ways in the context of plate tectonics: (1) As noted in the instructions for this journal entry, understanding of plate tectonics has helped lead to technologies that can mitigate the impacts of natural disasters, such as buildings that can withstand earthquakes and helping people learn where it is safe to build in volcanic zones. (2) The quest to find evidence for continental motion and to further understand plate tectonics has driven new technologies. For example, at least some of the motivation for early mapping of the ocean floor — which spurred development of technologies for this mapping— was driven by a desire to find out whether the idea of continental motion could be supported. Similarly, the quest to measure plate motions led to development of technologies that vastly improved the accuracy of GPS measurements.
Activity
Earth Rap/Slam Poetry
Work in small groups to create either a musical or slam poetry piece about geology or about Earth science more generally. Be creative, but try to incorporate as much real science as you can, and be sure all your science is clearly and correctly explained. If possible, make a video recording of your piece, either as a live performance or using video animation tools. For inspiration, you may want to check out the following videos:
- This video adapts a well-known song to teach about fossil formation.
- This video, made by 6th graders, is their own rap about how the theory of plate tectonics developed.
This optional activity can be fun for students who want to get creative. Note: You can find more videos made by the same group as the one suggested in the box (“Science with Tom”) here: https://www.sciencewithtom.com/videos.