As you learned in Section 4.2, the hydrosphere is the name we give to all the water on Earth, including:
- all the water in the oceans
- all the water on land, including lakes, rivers, and groundwater
- all the ice floating in the oceans or in the form of snow or glaciers on land
- all water in the atmosphere, including both water vapor and liquid droplets or ice crystals in clouds.
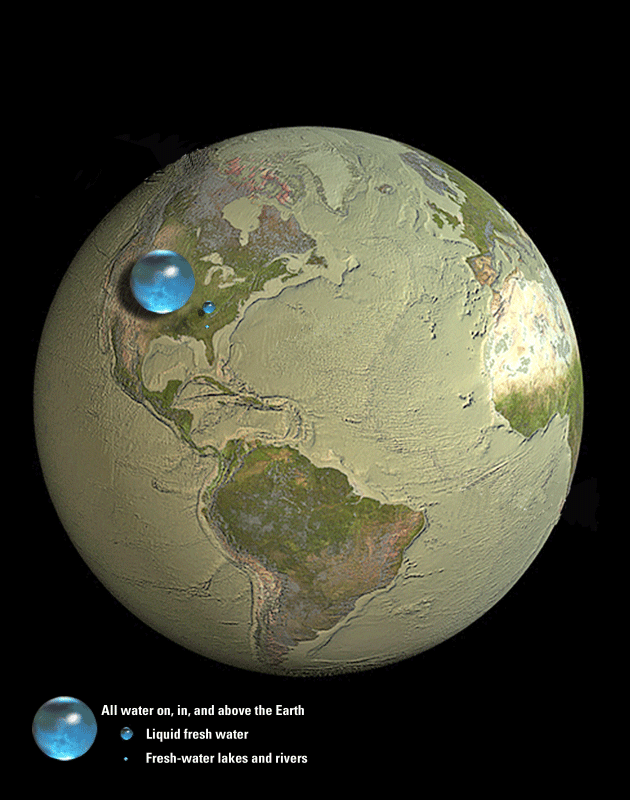
You also saw in Figure 4.31 that the total volume of water in the hydrosphere is small compared to Earth as a whole, but it dominates Earth’s appearance because it is all found on or near the surface. In fact, nearly ¾ of Earth’s surface is covered by water, which is why we often call our world the “blue planet.”
In this section, we’ll look a little more deeply at the distribution of water on Earth, with a particular focus on the availability of fresh water and its importance to humanity.
The Geographic Distribution of Water
The vast majority of Earth’s water (about 97%) is in the oceans. We cannot drink the salty water of the oceans, but it still has enormous effects on our lives.
Discussion
How the Oceans Affect Us
Working as a class, come up with a list of as many ways as you can think of that the oceans affect our lives.
This should be a brief discussion in which you give students a chance to compile a list of ways in which the oceans affect us. You may get some very extensive lists, but three key items that students will hopefully come up with are: the role the oceans play in our food supply (fisheries); the roles they play in weather and climate by storing heat and moderating heat exchange with the atmosphere; and the effects they have on coastlines through such things as tides, storms, and storm surges. Students might also list some more humanistic effects, such as the way oceans provide transportation links between distant locations via ships, recreational aspects of the oceans in boating and at beaches, or even the appearances of oceans in literature and storytelling.
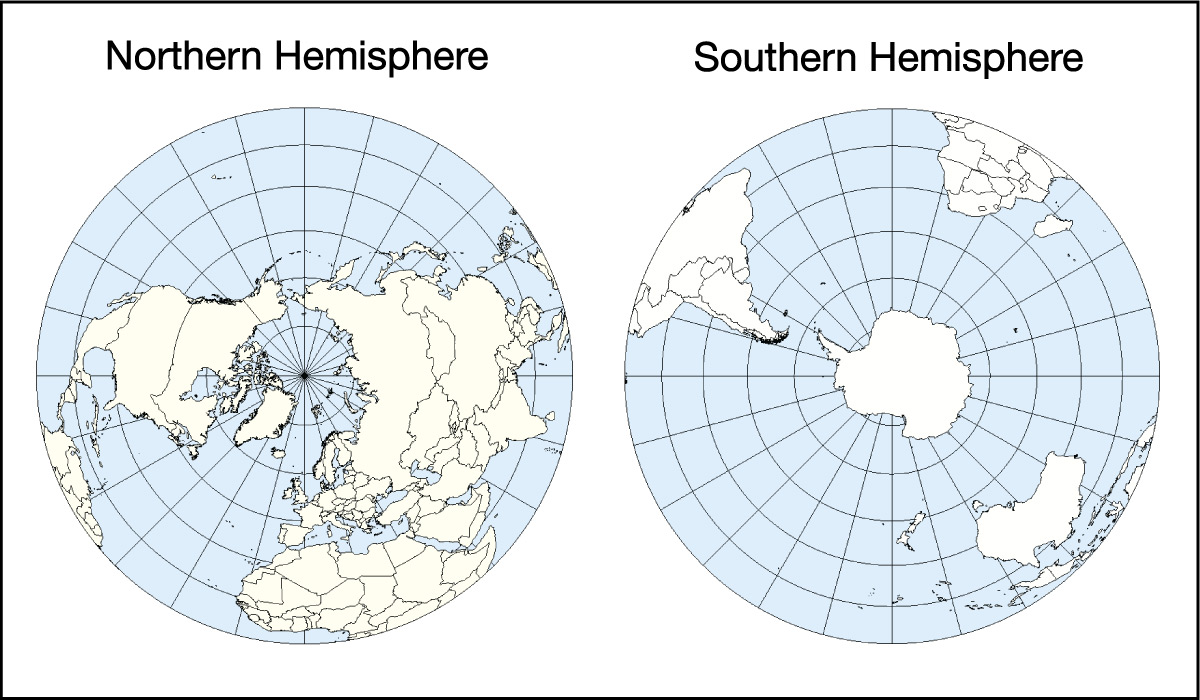
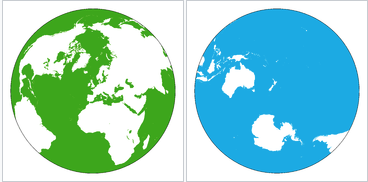
Some of the effects of the oceans come from their geographical distribution. Figure 6.1.2–1 shows top-down views of the Northern and Southern Hemispheres. Notice that while oceans take up more area than land in both hemispheres, there is much more total ocean in the Southern Hemisphere. Recall from Section 2.2.2 (and Figure 2.19) that this geographic distribution, combined with the moderating effect of the oceans on climate, explains why the Southern Hemisphere has milder seasonal changes than the Northern Hemisphere. The uneven distribution of the oceans also affects weather and climate in many other ways, some of which we’ll discuss later in this chapter.
Activity
Distribution of the Oceans
Work in pairs or small groups for this activity, for which you’ll need a globe or inflatable Earth and a cell phone camera. One student should hold the globe (or inflatable Earth) while another takes photos.
- Take two photos, one looking straight down from above the North Pole (that is, the student holding the globe should hold it with the North Pole at the top) and one looking straight down above the South Pole (that is, the student holding the globe should turn it over so the South Pole is at the top). Compare the two photos. Do they look like the maps in Figure 6.2.1–1? What do you notice about the distribution of land and ocean in the Northern and Southern Hemispheres? How does this explain what you learned in Chapter 2 about seasonal differences in the two hemispheres?
- Now rotate the globe so that the middle of the Pacific ocean is at the top. Take a photo looking straight down at the globe now, then rotate it to the exact opposite side of the Earth for a second photo (so that together, your two photos represent the full Earth, since they are taken from opposite sides). What do you notice about the two photos in this case?
- Experiment with your globe and photos, continuing to take photos of opposite sides, to see if you can find a pairing that maximizes the difference in land between the two photos. That is, try to identify the view of Earth that most makes our planet seem to have a “land hemisphere” and “water hemisphere.”
This activity should be fairly simple if you have enough globes (or inflatable Earths) to spread among your students and they use their own cell phone cameras. If you don’t, then you could do it as a class using a single globe and taking the photos yourself, then showing them to the whole class. Notes on the answers:
- (1) This first pair of photos essentially has students reproduce the views of Figure 6.2.1–1, which will make sure they understand how to take the photos. This should also reinforce their understanding of the fact that there is much more land in the Northern Hemisphere, even while ocean dominates in both hemispheres. Students should recall from Chapter 2 (and the paragraph above this activity) that the moderating effect of the oceans explains the milder seasonal changes that occur in the Southern Hemisphere.
Note: Looking ahead to Chapter 7, you might also point out that this means that most of the trees and plants that change with the seasons are in the Northern Hemisphere, and that this will account for the annual wiggles seen in carbon dioxide data like that of Figure 7.1.2–1, as explained in this I was Wondering box. - (2) Students should notice that there’s an even larger difference in the land distribution between the Pacific hemisphere and its opposite hemisphere.
- (3) Students should have fun trying to maximize the difference in land in their two views. You should accept any reasonable tries at this, including focusing on the Pacific as in question (2), since that is close to a maximum. In case you are curious, the two views below (which you can find here on Wikipedia) show the maximum: the hemisphere view on the left contains slightly more than 80% of all Earth’s land. Note, however, that while it contains the vast majority of Earth’s total land mass, this hemisphere still has more ocean than land, which again emphasizes the fact that our planet’s surface is dominated by the oceans.
The Difference Between Salt Water and Fresh Water
This subsection is optional, and you can skip ahead to the fresh water distribution if you are pressed for time. However, we have found that while most students have an intuition about the difference between freshwater and seawater, they can’t actually explain it, and this in turn means they’ll have difficulty understanding why there is a continuum of salinities across different bodies of water. This subsection should help rectify that issue. Note also that we are giving salinity as percentages, but you may see other units used elsewhere. To understand the common salinity units, note the following:
- Salinity is commonly defined as the weight of salt in a given weight of saline water, usually stated as “grams of salt per kilogram of water.” For example, if you collect 1 kilogram of seawater and find that it contains 35 grams of salt, then its salinity is 35 “grams per kilogram.”
- Because there are 1,000 grams in 1 kilogram, “grams per kilogram” can also be stated as “parts per thousand” (ppt). Continuing the above example, you may therefore hear the salinity of the seawater described as 35 ppt.
- Percentages are equivalent to parts per hundred, so you can convert from ppt to precent simply by dividing by 10. A seawater salinity of 35 ppt is therefore equivalent to 3.5%.
- Similarly, convert from percent to ppt by multiplying by 10. For example, a fresh water salinity of 0.01% is equivalent to 0.1 ppt.
We have chosen to use percent for salinity, rather than other units, because we believe it will be easier for students given that percent is so commonly used in many contexts. However, if your students do any independent reading or research, they are likely to see ppt or “grams per kilogram” units instead.
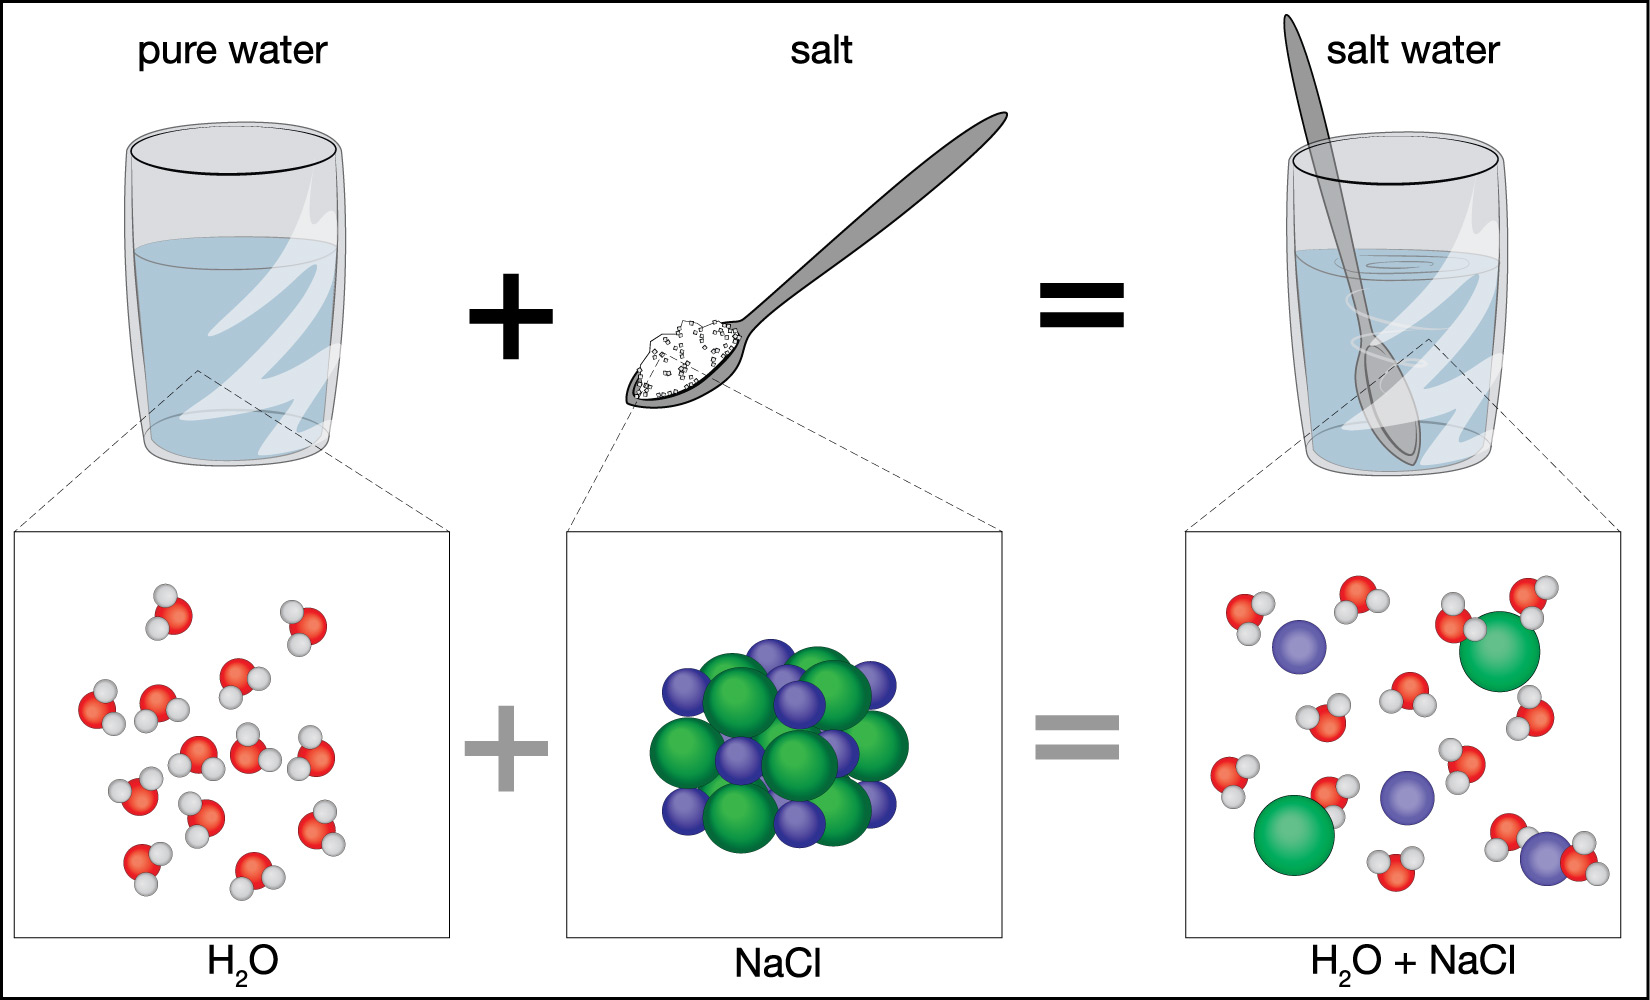
Have you ever wondered why the oceans contain salt water while rivers and lakes on land are generally fresh water? To answer, we first need to consider what we mean by “salt water.” The name tells us that salt water has two components:
- Water, which is simply H2O, meaning that it consists of molecules that contain two atoms of hydrogen and one atom of oxygen.
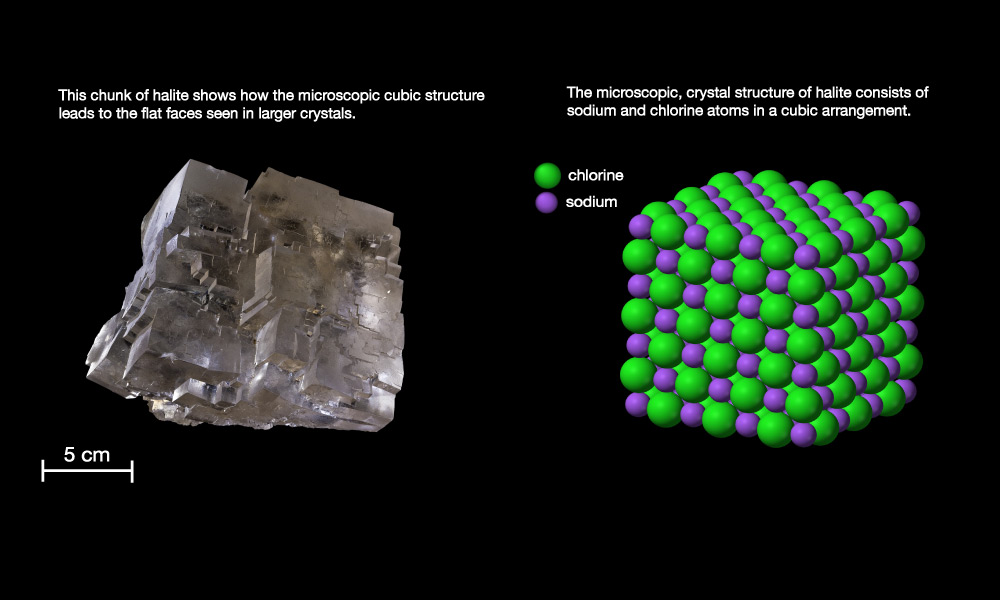
- Salt , which in geology refers to minerals that dissolve easily in water , so as to make “salt water.” The most common salt in seawater is the mineral halite (see Slide 1 in Slide Show 5.1.1–2), also known as “table salt” or by its chemical name, sodium chloride (NaCl) .
Figure 6.1.2–2 shows how dissolving salt in water makes salt water.
We measure the saltiness, or salinity , of water by how much salt it has dissolved in it. For example:
- Pure water has no salt dissolved in at all, so it has a salinity of zero.
- Typical seawater has about 3.5 grams of salt dissolved in each 100 grams of the seawater, so we say it has a salinity of about 3.5%.
- The fresh water we drink typically has less than 0.01 gram of salt for each 100 grams of water, so we say it has a salinity of less than 0.01%.
Before you continue, try the following question to make sure you understand the tremendous difference in salinity between seawater and drinking water.
Discuss the following question with a classmate. Then click to open the answer to see if it agrees with what you came up with.
- About how many times more salt is there in seawater than in drinking water?
You can find the answer using the facts given above: 100 grams of seawater contains 3.5 grams of salt, while 100 grams of drinking water contains only about 0.01 grams of salt. Dividing the two salt values (from equivalent amounts of water), we find:
3.5 0.01 = 350
We conclude that seawater contains about 350 times as much salt as drinking water.
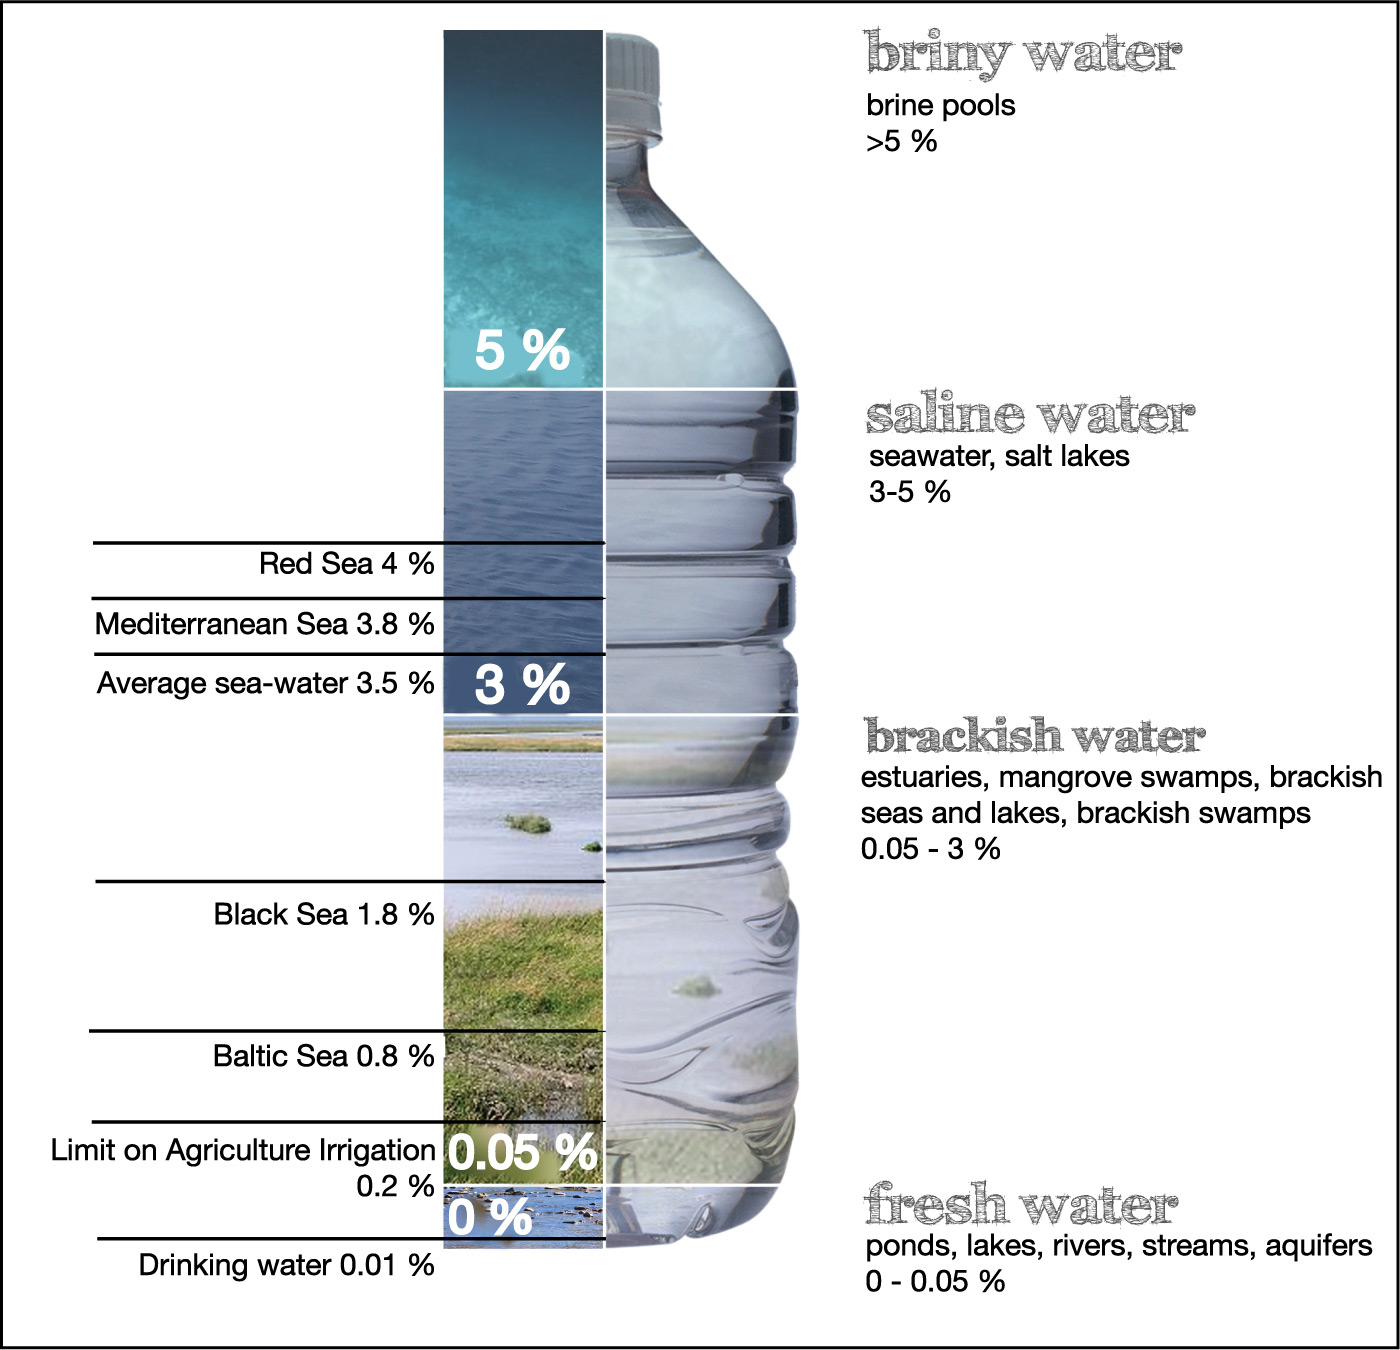
The salinity of the water found on Earth varies over a wide range. Figure 6.1.2–3 shows that different levels of salinity are categorized with different names. (You do not need to memorize these categories, but you are likely to hear their names used in your everyday lives.) For example, anything with a salinity of less than about 0.05% is usually considered “fresh water,” while water that has more salt than fresh water but less than seawater is called “brackish.”
Activity
Making “Sea Water”
It’s easy to make your own “sea water,” meaning water with the salinity of the oceans. You’ll simply need to dissolve enough salt into some water to give it a salinity of about 3.5%. Two facts will help you do this:
- One liter of water has a weight of approximately 1 kilogram. (To see why, recall that the density of water is 1 g/cm3 and 1 liter = 1,000 cm3; therefore, the weight of 1 liter of water is 1,000 grams, or 1 kilogram.)
- One teaspoon of salt weighs about 6 grams. (Note: a “teaspoon” is the same as 5 cm3, also called 5 milliliters or 5 ml.)
With these facts, there are many ways you can make a batch of “sea water,” but here is one simple way:
- Find a 1 liter bottle and fill it with fresh water.
- Add a little more than ½ teaspoon of salt to it and shake or stir until it is completely dissolved. (You want a little more than half a teaspoon, because the fact that one teaspoon of salt weighs about 6 grams means that a half-teaspoon weighs about 3 grams, and your goal is to dissolve in about 3.5 grams.)
After you make your “sea water,” take a taste of it (but don’t drink it!) to see how salty it is.
You may wish to save your “sea water,” as we’ll use it in a later activity.
Important note: Don’t use a mixture like this to put into a saltwater aquarium, because your mixture contains only table salt while salt water fishes need other salts from seawater to survive. That is why you should purchase “aquarium salt” for saltwater aquariums.
This is a simple activity, as long as you have a teaspoon for measuring the salt and a bottle or other measuring tool for the water.
Now that you understand salinity, we can return to the question of why the oceans are salty but rivers and most lakes are not. The answer is basically that water become salty if it has a source of salts and enough time for the salt to accumulate. The oceans have two main sources of salt (Figure 6.1.2–4):
- Most of the salt in the oceans comes from weathering and erosion of rocks on land. The eroded rock becomes sand and silt that is carried downstream by rivers to the sea, and some of this eroded material includes salts that then dissolve in the seas.
- A secondary source of salt in the oceans is minerals that erupt from volcanic vents along mid-ocean ridges .
Over time, these salts have accumulated in the ocean, making the water salty. As to why most lakes and rivers are not salty, use the questions that follow the figure to explain it yourself.
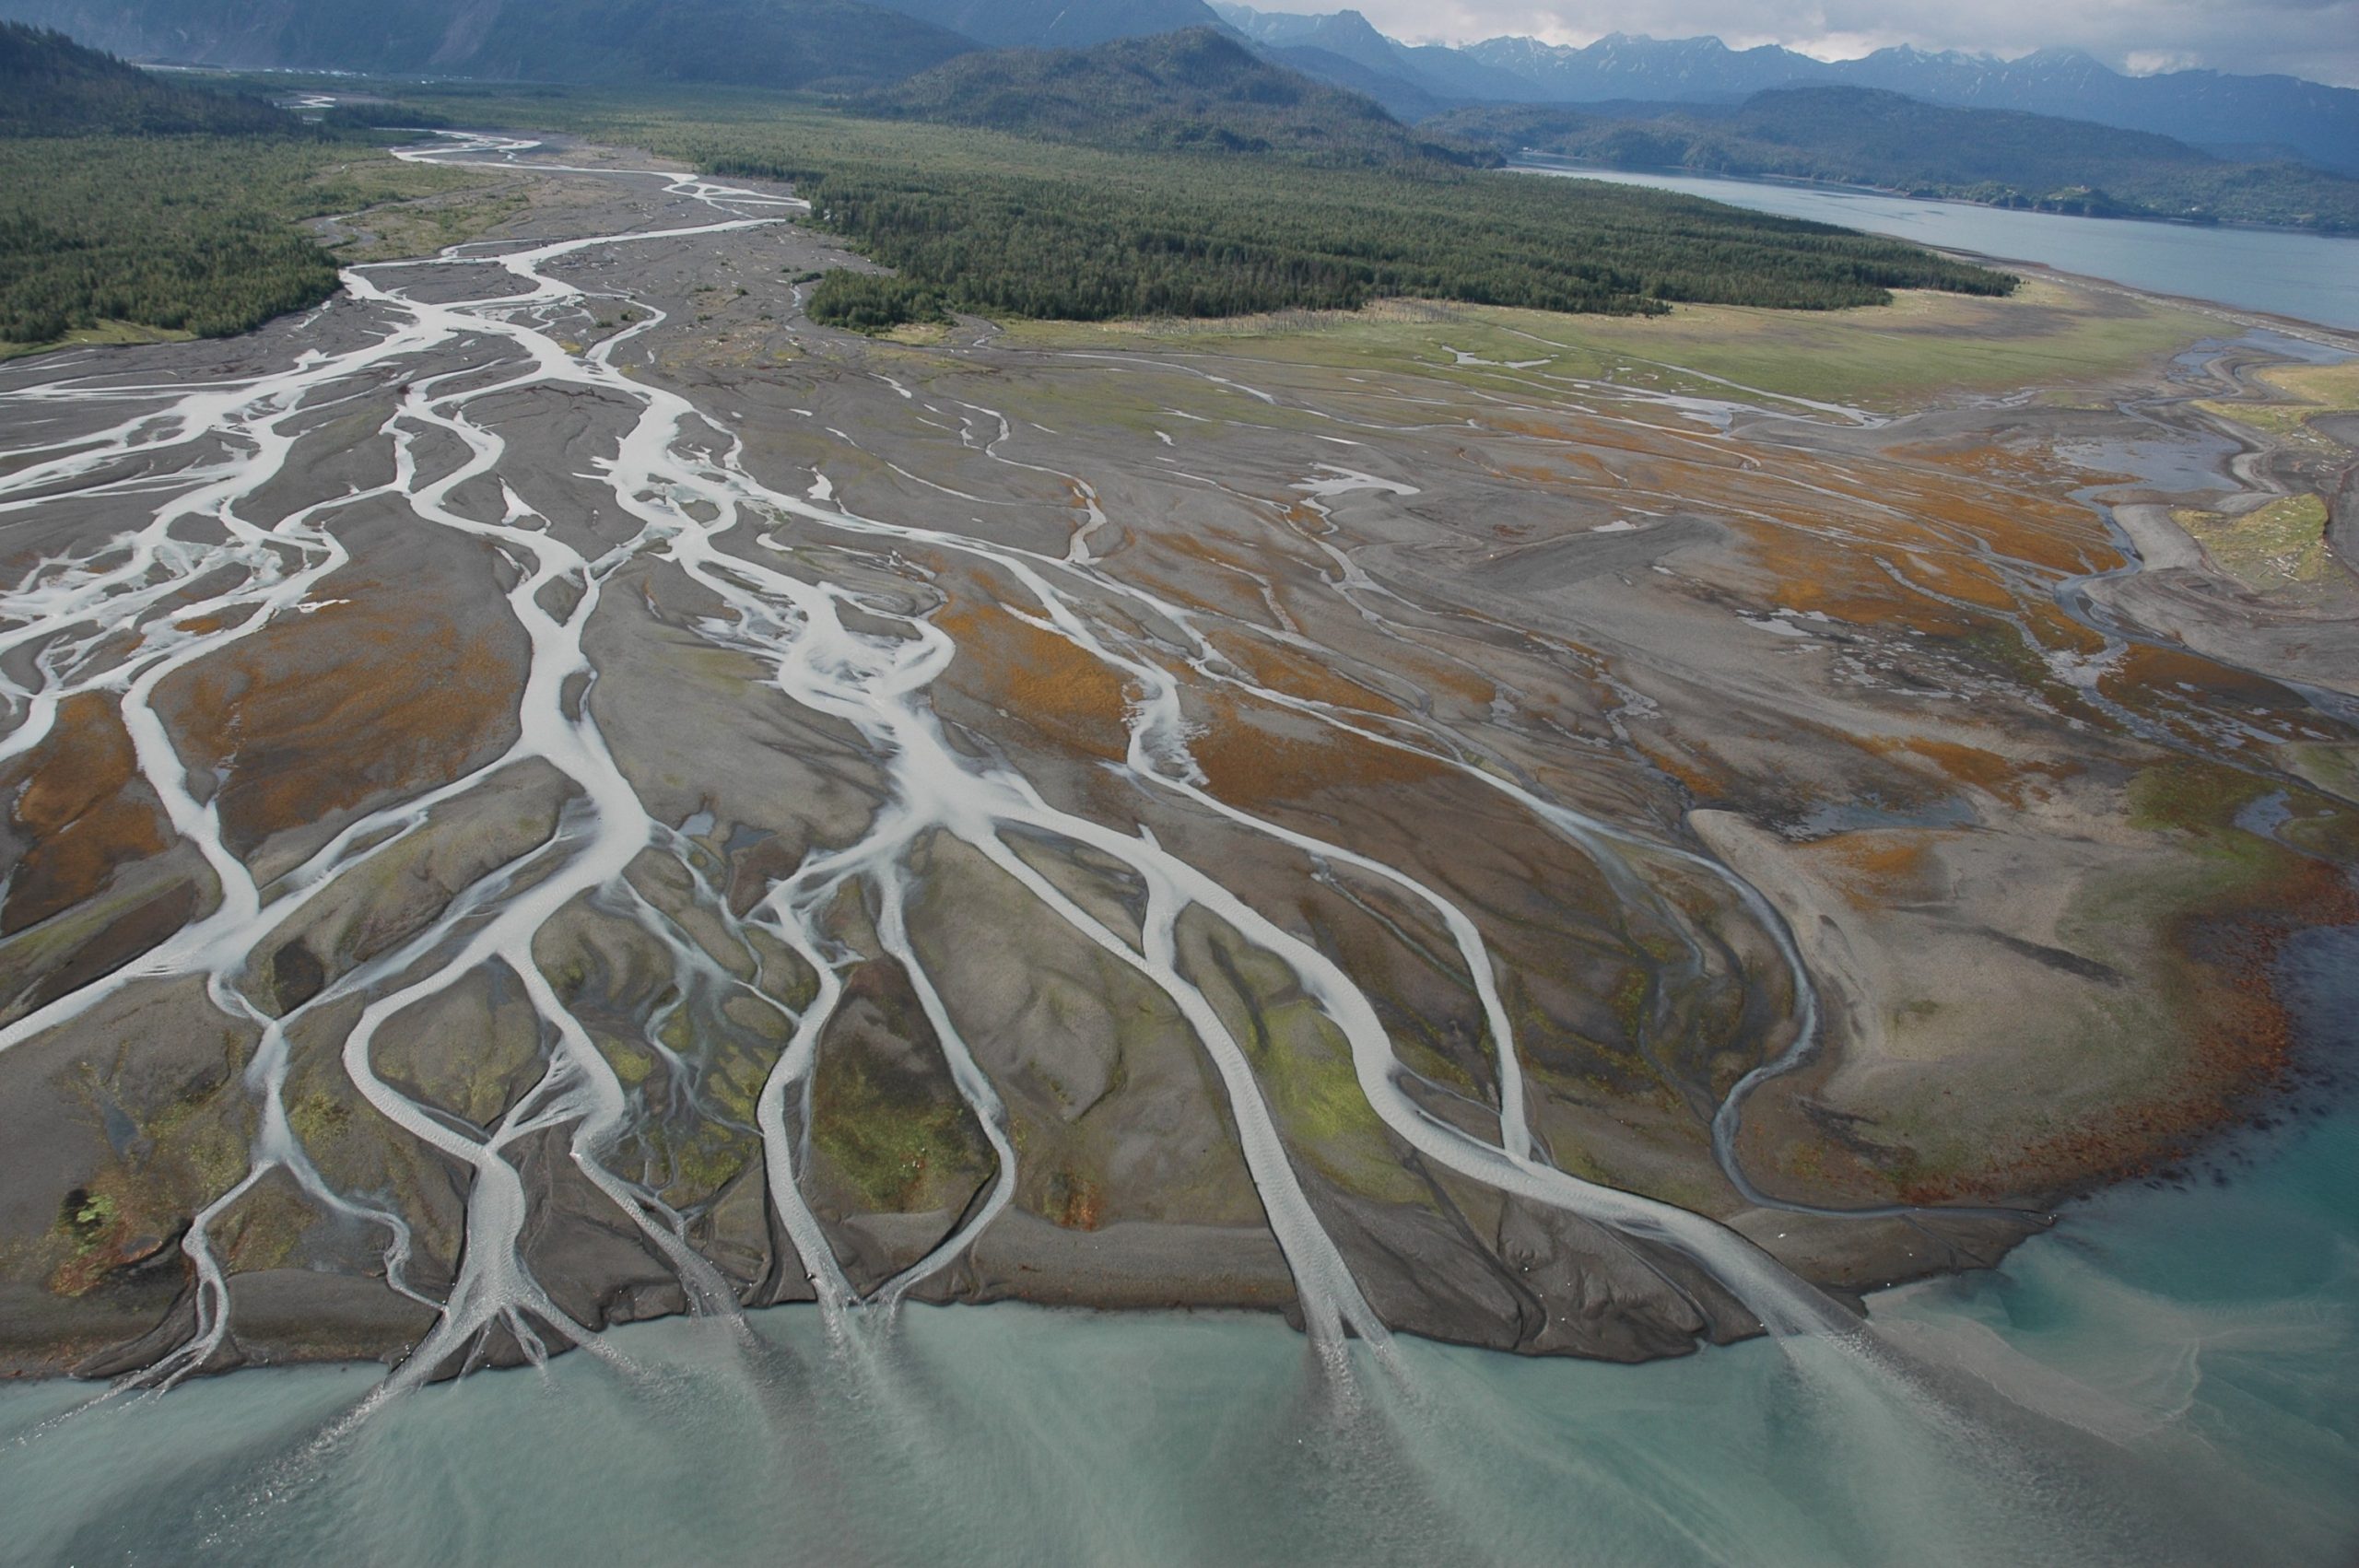
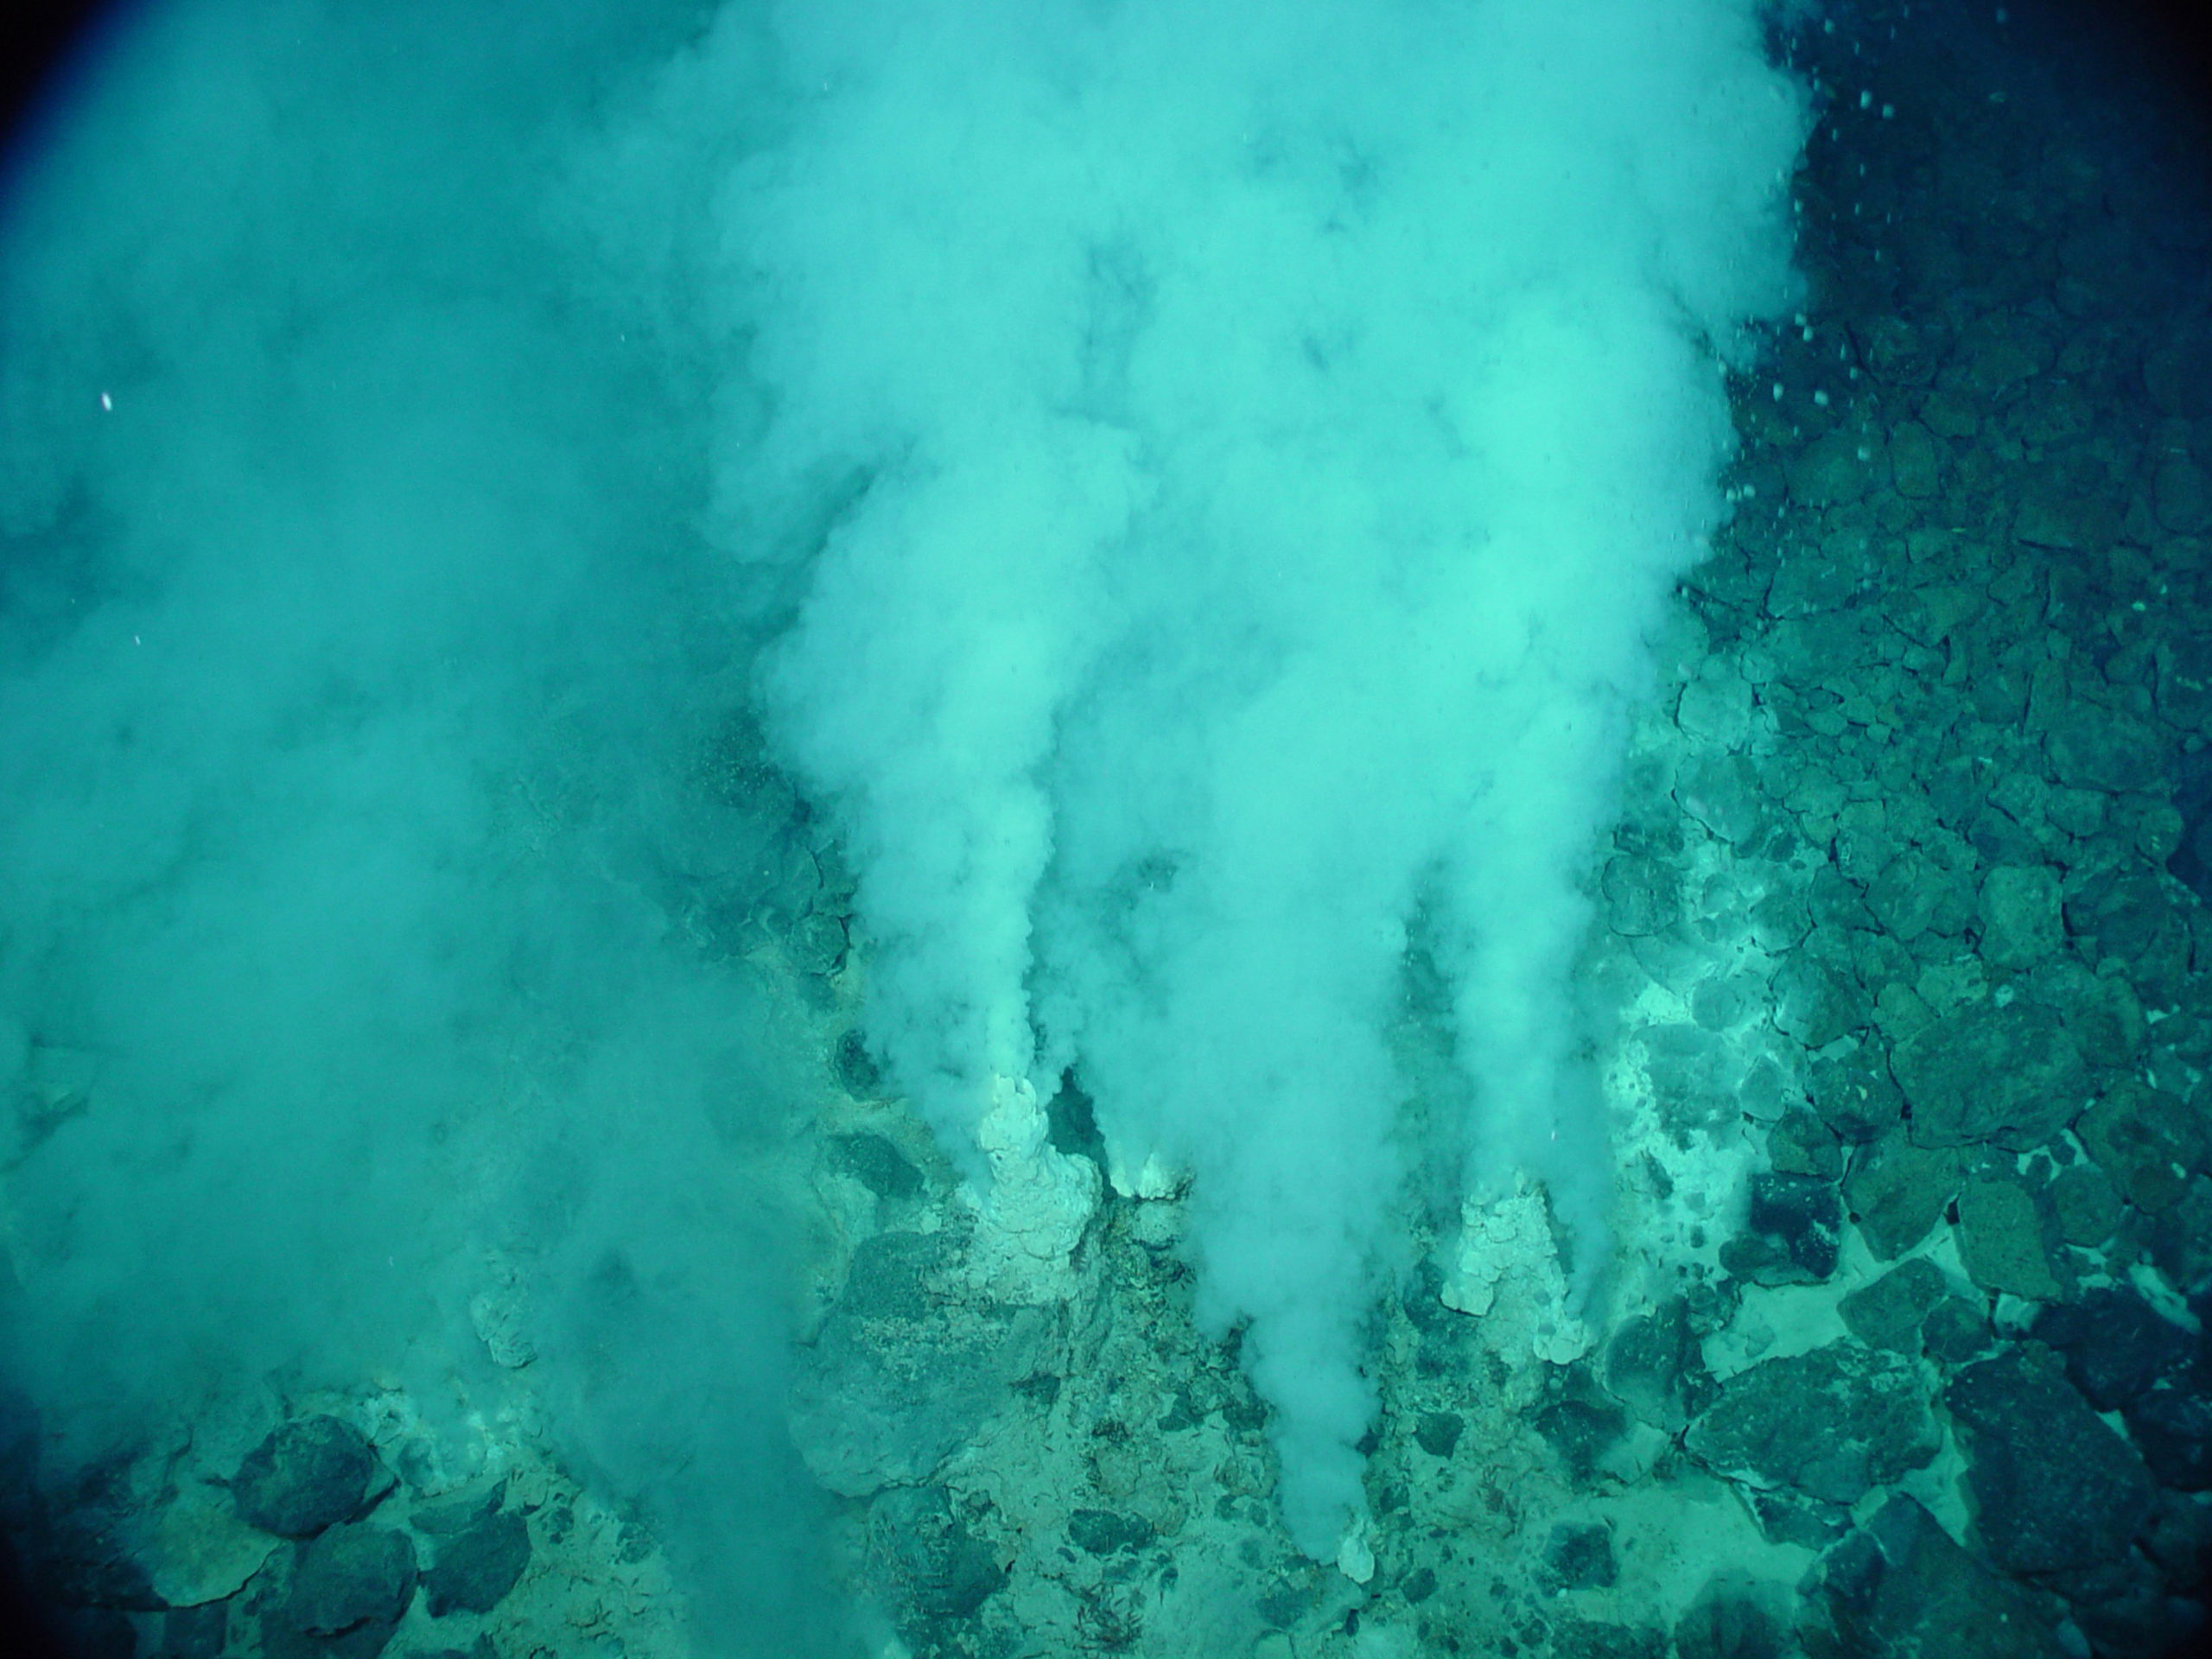
Figure 6.1.2–4 – These photos show examples of the two main sources of salts for the ocean.
Discuss the following questions with a classmate. Then click to open the answers to see if they agree with what you came up with.
- Is rain water fresh or salty, and why? Hint: When water evaporates to make water vapor, any salt in it is left behind (see the next Activity below).
Rain water is fresh water, which is why you can collect it for drinking or use it to water plants. The hint provides the key clue as to why. Rain water falls from clouds, and clouds contain droplets that have condensed from water vapor in the atmosphere. Because the water vapor is pure water (any salts were left behind when it evaporated), the droplets will also be nearly pure .
- Is snow made of fresh water or salt water, and why?
Snow also comes from water vapor that has condensed in clouds, except that it has frozen into ice crystals. Therefore, snow is also made from fresh water, which is why you can melt it to make drinking water.
- Use your answers to questions 1 and 2 to explain why rivers contain fresh water rather than salt water.
Rivers are fed by rain water and melting snow. Since those are both fresh water, the rivers contain fresh water.
- Rivers cause weathering and erosion of rocks, which means they can pick up salts as they flow. So why don’t rivers become very salty as they flow? Hint: Think about the time it takes river water to reach the oceans compared to the time that salt has had to accumulate in the oceans.
The oceans are salty because salt has been accumulated for millions of years. River water reaches the oceans fairly quickly, so there isn’t enough time for much salt to accumulate in rivers before their water flows onward to the sea.
- Build on your prior answers to explain why most lakes contain fresh water, but some contain salt water.
The river water that flows into lakes is fresh, but it may also contain small amounts of salt. If the lake water is continually replenished as water flows in one side and out on another, the water will remain fresh like the river water. But if the lake is closed off, then the salts will have time to accumulate and make the lake water salty.
If you’ve successfully answered the above questions, then you should recognize that lakes and seas may have different levels of salinity depending on how much salt has been able to accumulate in them. If you now look again at Figure 6.1.2–3, you’ll see that it gives examples of different salinities in different bodies of water.
In fact, even the oceans have varying salinity. That is, the 3.5% salinity of ocean water that we mentioned above is only an average. Today, scientists can use satellites to trace small variations in the salinity of ocean surface water. Although we won’t go into further detail here on the importance of these variations, you should watch Video 6.1.2–5 to get a sense of how salinity varies and why it is important.
Video 6.1.2–5 - This NASA video shows how ocean salinity varies around the world over the course of a year. Be sure to notice the key at the lower right: blue means lower salinity, and red is higher. Credit: NASA.
Discussion
Salinity Variation in the Oceans
In small groups or as a class, discuss some of the patterns you notice in Video 6.1.2–5. For example, why is there blue coming out from the Amazon basin? Why is there a blue band in equatorial regions? Describe other patterns that you find interesting in the video.
This discussion asks students to watch and think about the above video. This material is generally beyond the scope of middle school science, but it is not difficult to understand, and so we encourage you to use it as a way of building interest in a topic (salinity) that might otherwise seem a bit dry. Note that you can also use this discussion to help students think again about the nature of science, and how even something as seemingly mundane as “sea water is salty” can, upon detailed inspection, turn out to yield important and useful insights.
Activity
Making Salt Through Evaporation
When water evaporates, any salt that is in it will be left behind. Therefore, it is possible to “make” salt from seawater, or any other salty water, simply by letting all the water evaporate. You can speed up the process by boiling away much of the water as follows:
Step 1: Use one of the following two options to obtain your salt water.
Option 1: If you live near an ocean or salty lake, collect some water. To remove any sand or silt, pour it through a cheesecloth (or similar filter) into a pot.
Option 2: If you don’t have access to a natural source of salt water, you can use the salt water that you made in the earlier Activity “Making Sea Water.”
Step 2: Heat your salt water in a pot until about 90% of the water has evaporated away (it is fine to boil the water). Then remove from the heat. The remaining water will be thick and very salty, much like wet sand.
Step 3: Pour the remaining, salty water int a shallow pan and leave it uncovered until the rest of the water evaporates. This make take a few days. It may go faster if you stir the water in the pan a couple times a day.
Discussion. Although you heated the water to make it evaporate faster in this activity, the same thing will happen (more slowly) if you put seawater into an evaporation pond and let all the water evaporate. Use this idea to explain what is happening in the photo below (Figure 1).
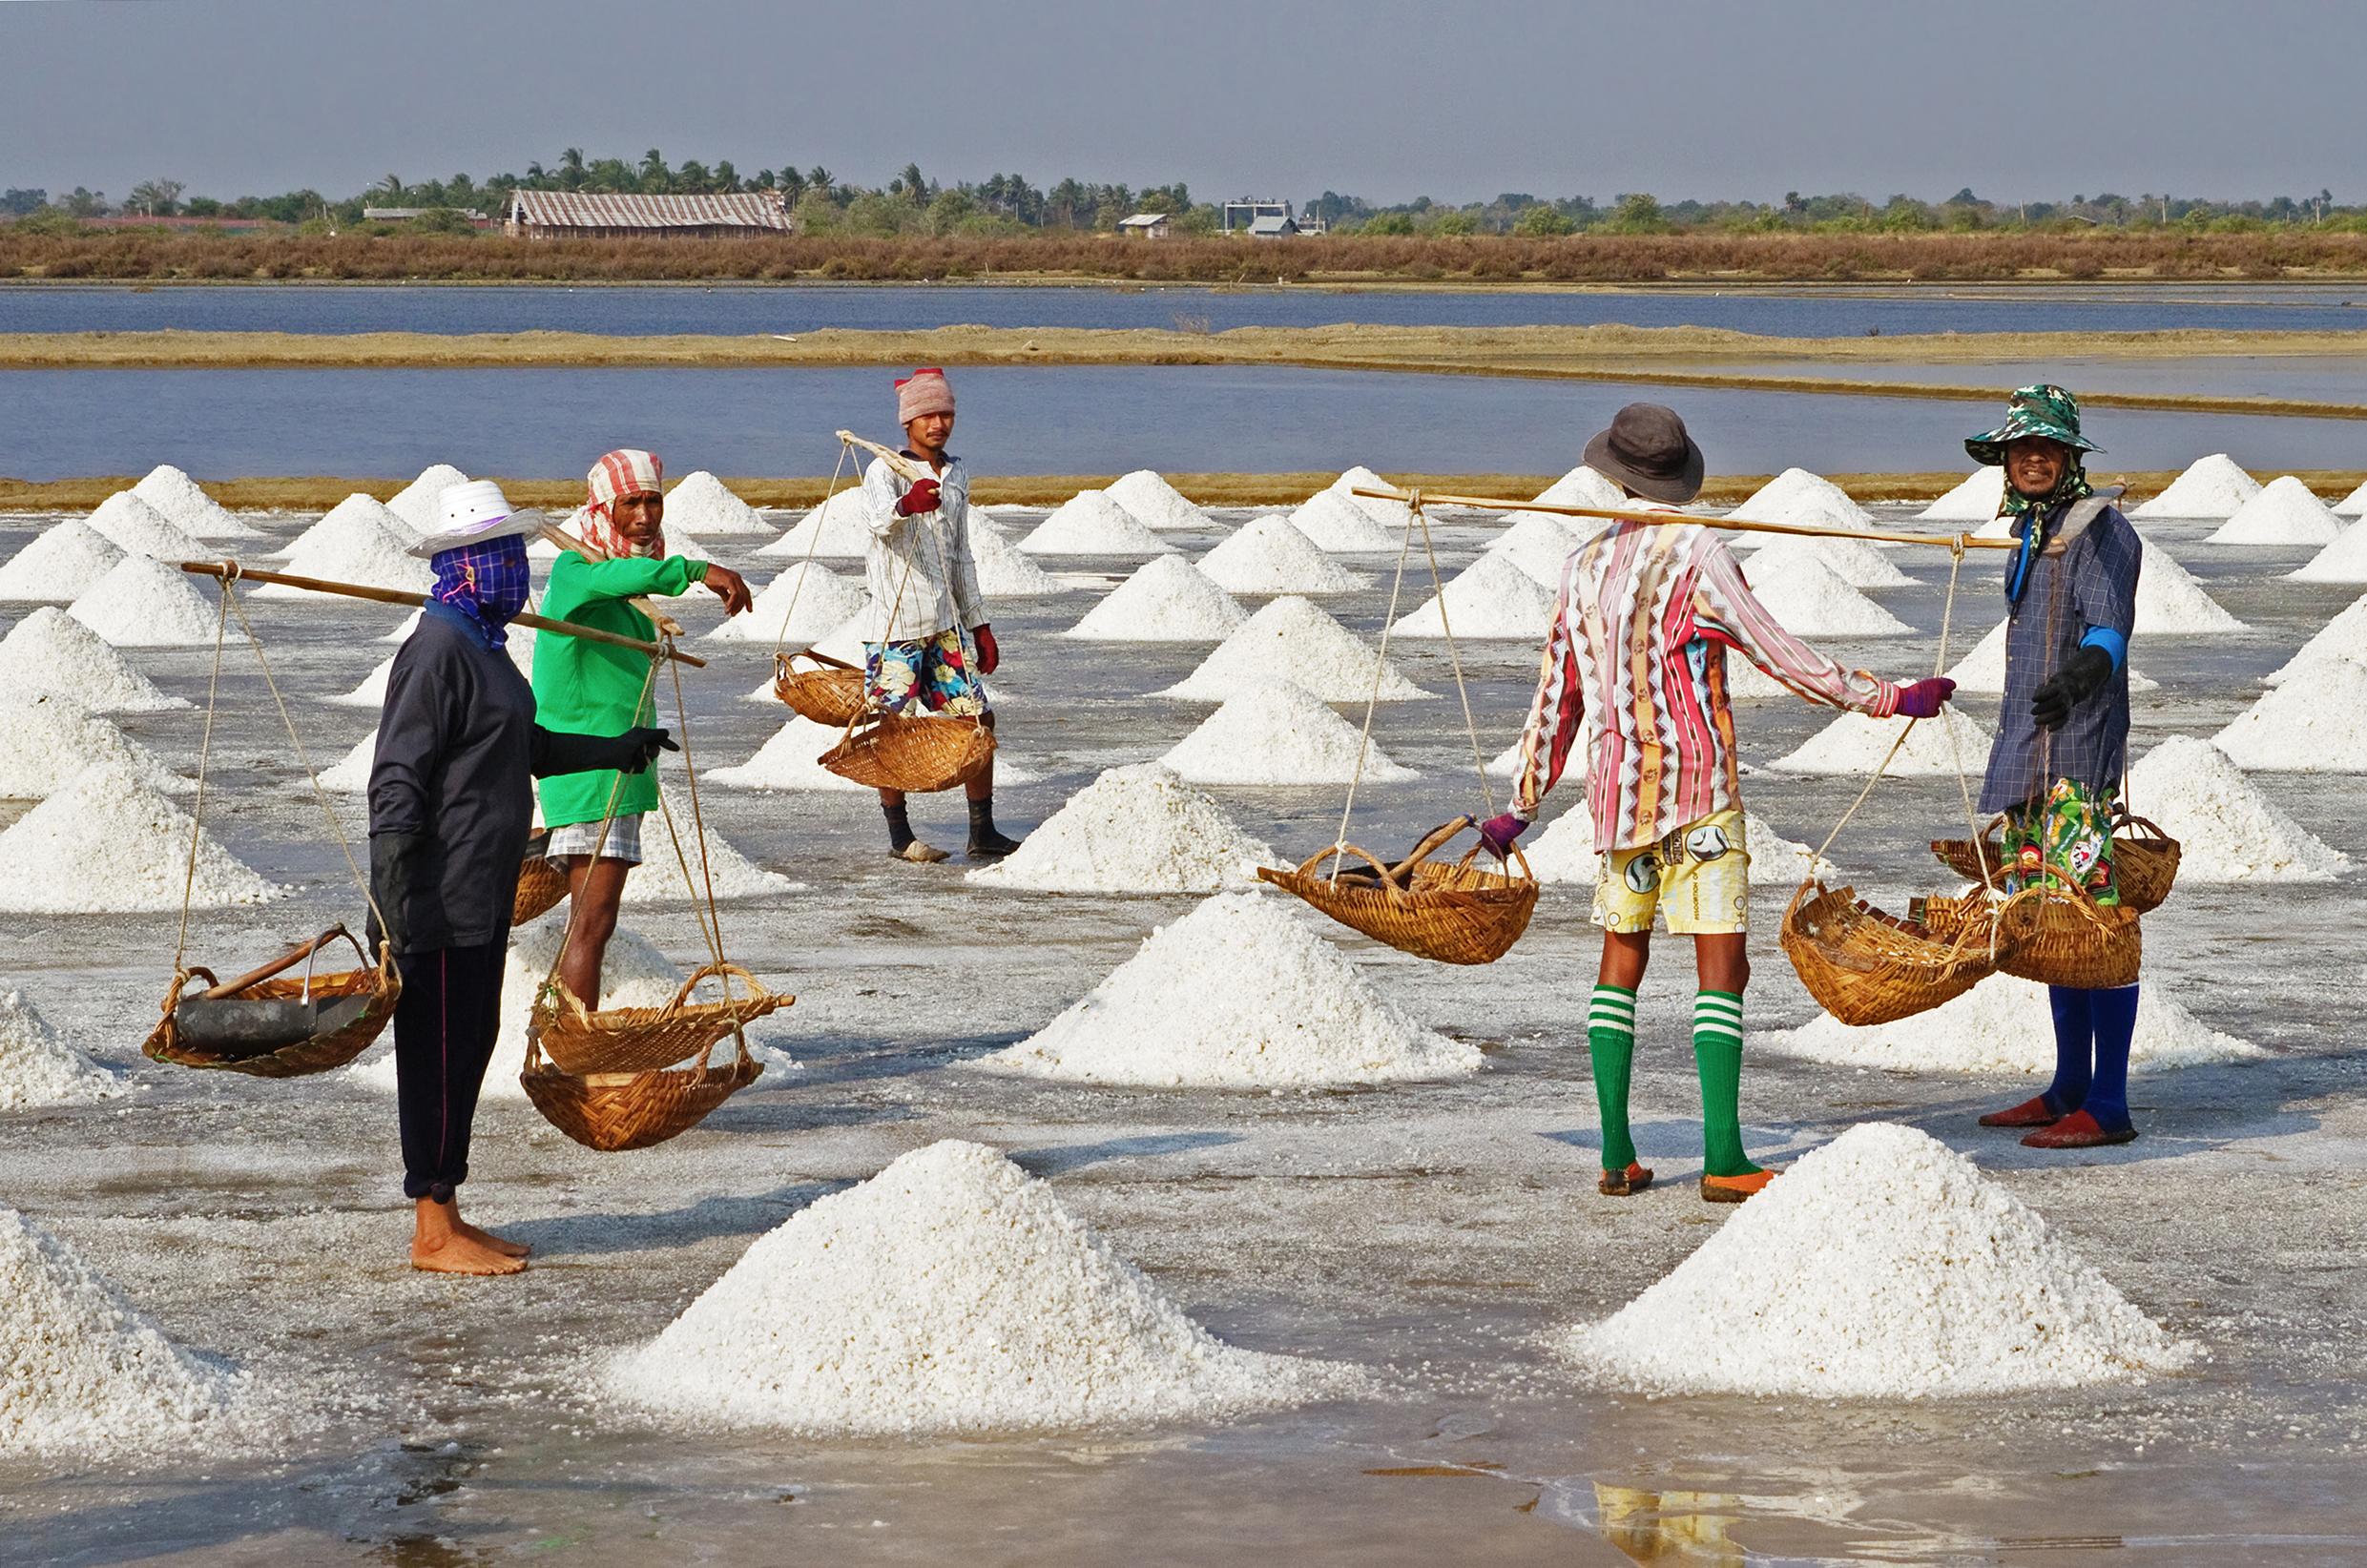
This optional activity shows students how people can “make” salt from seawater. Even if you don’t do the activity, we suggest you discuss the photo at the end. Note that the activity itself requires time to boil away most of the water and then a few days for the remaining water to evaporate. Regarding the photo: The key points that students should notice are:
- The photo must show an area near the sea, since the evaporation ponds contain seawater.
- The salt farmers are standing in a “pond” that has almost fully evaporated, leaving behind the salt that they have made into piles.
- In the background you can see ponds that have not yet fully evaporated.
Connections—History and Etymology
Would you accept your salary in salt?
Imagine that you were hired to do a small job, such as babysitting or yard work, and when you were finished, the person who hired you paid you by pouring a bit of salt into your hands. You probably wouldn’t like that, but long ago, salt was actually used by some cultures as money! In fact, the word salary comes from the Latin word sal, for salt.
To understand why salt was once considered so valuable, you need to understand a little about its importance and role in history. Thousands of years ago, people noticed that salt could be used to help preserve food. (They didn’t know the reason at the time, but it is because many microorganisms that rot food cannot survive with high salt concentrations.) However, before people learned to make salt by evaporating seawater, salt was very difficult to find. Therefore, the value of salt as a preservative, combined with the fact that small amounts of salt taste good, made salt very valuable.
The idea of salt as something of great value still infuses our language in many ways. For example, if you say someone is “salt of the earth,” it means that person is considered good and valuable – just as salt is good for things like preserving food and was once of high value. Some people also still use the expression “worth one’s salt” to mean a person who is competent and does valuable work. On the other side, armies discovered that pouring salt over an enemy’s crops could kill the crops and thereby starve the enemy. For this reason the phrase “salting the Earth” is sometimes used to describe destruction.
The Distribution of Fresh Water
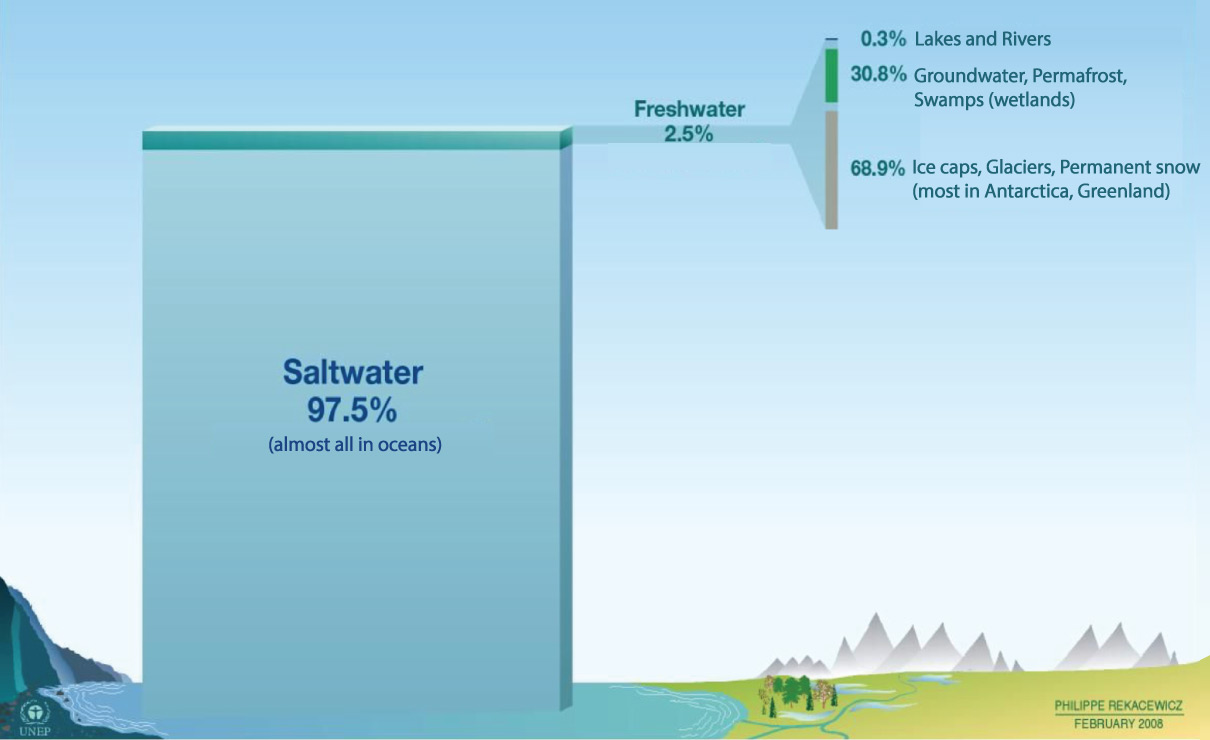
The difference between fresh water and salt water is very important to our lives, because we can only drink fresh water and because most crops will grow only with fresh water irrigation. Therefore, even though we live on an “ocean planet,” the water that we can actually use is relatively rare. Figure 6.1.2–6 shows where we can find fresh water on Earth.
Quiz – Where the Water Is
Answer the following questions based on what you’ve learned about the distribution of water on Earth and the data shown in Figure 6.1.2-6.
Note: As always, after you finish the quiz, be sure you read the feedback that explains the correct answers, to make sure you understand the reasons for these answers.
Notice that (as you found in the above quiz), most of Earth’s fresh water is not easily accessible to us because it is frozen at the polar caps. Most of this frozen fresh water is glacial ice in Antarctica and Greenland, and much of the rest is frozen in the Arctic Ocean.
Indeed, the only easily accessible fresh water is the water in lakes and rivers, and this represents only a tiny fraction (0.3%) of Earth’s total fresh water. However, in many cases we can also use wells to tap into groundwater , which represents much more fresh water than we find in lakes and rivers.
Many people are surprised to learn that there is much more water underground than in lakes and rivers, but it should make sense if you think about it. Rain (and snow) can fall anywhere, and this water will start seeping into the ground as soon as it falls (or melts). Only when it is “piled up” on the surface will it be able to flow along the surface for long enough to feed into a stream, river, or lake.
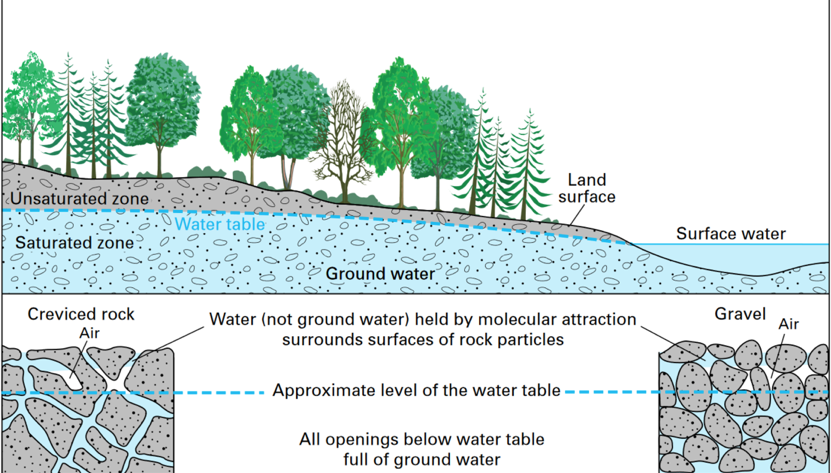
Once water seeps into the surface, it will continue to seep downward until it runs into a place where all the available space is already filled with water. Figure 6.1.2–7 shows how groundwater thereby forms a “water table” beneath the ground. Below the water table, water fills all the available space between particles of rock or soil (the “saturated zone” in the figure). Above it, the water is still making its way downward, which also means it is accessible to plant roots.
Fresh Water as a Resource
The fact that fresh water is not always accessible means that it can be considered a resource just like other materials that we extract from the Earth. Like many other resources, fresh water is becoming increasingly scarce. Indeed, humans are now using much of the available fresh water in rivers and lakes on Earth, and we are using so much groundwater that water tables are dropping in much of the world.
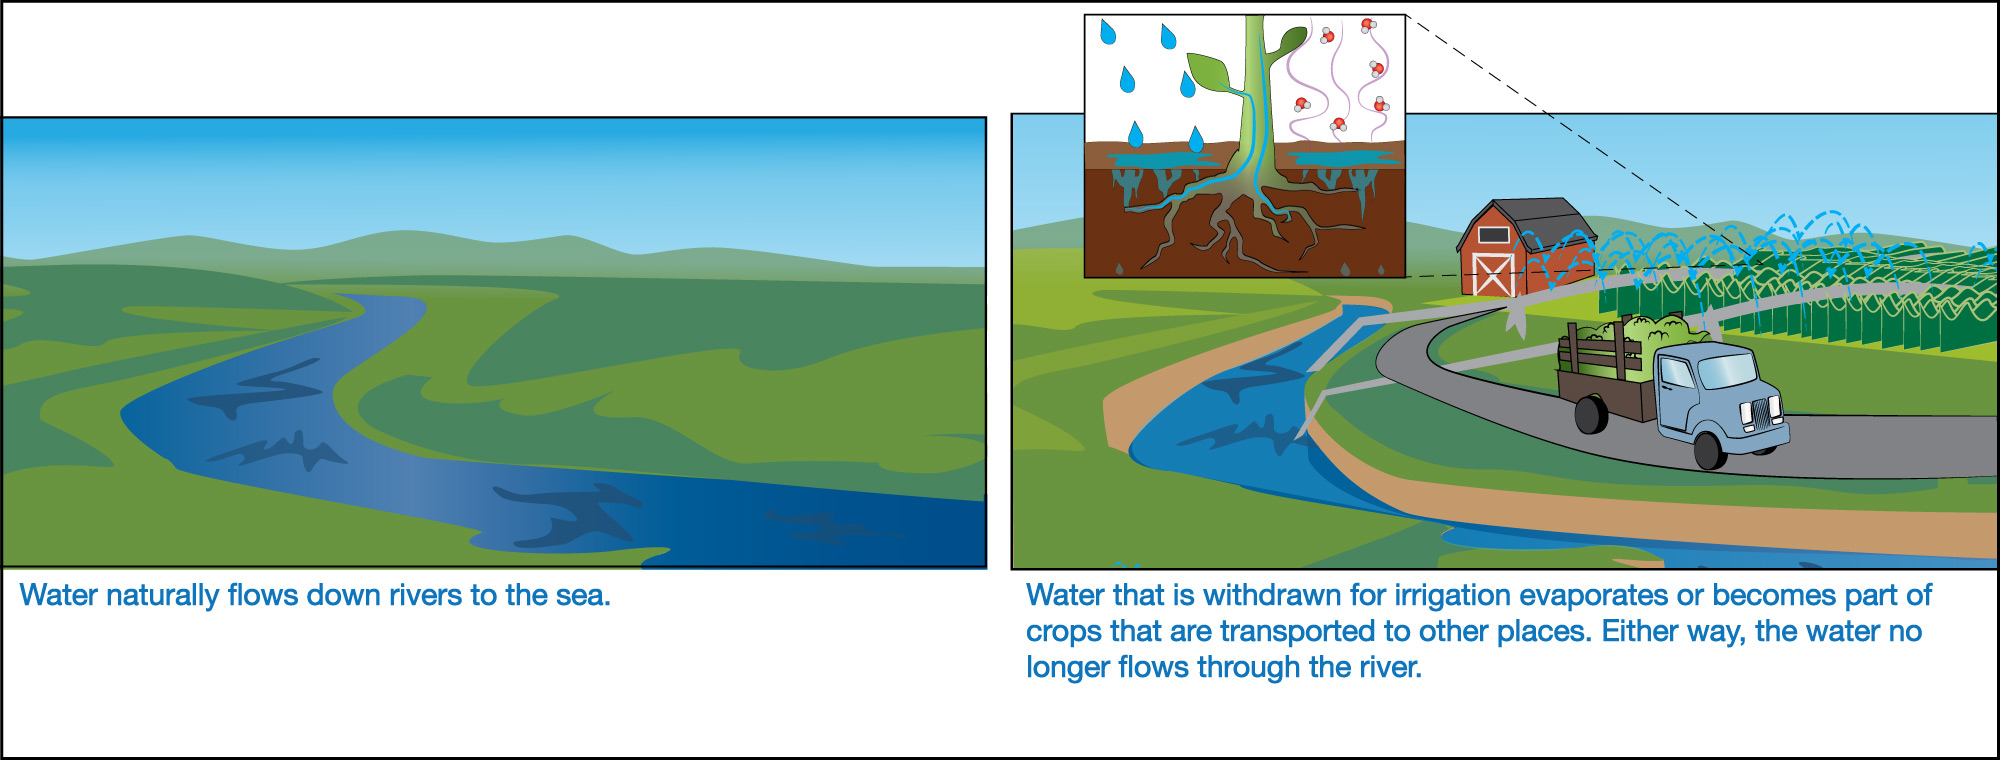
Given that all water is ultimately recycled on Earth, you might wonder how we can ever run short on fresh water. The answer has to do with how the water is recycled. As an example, Figure 6.1.2–8 shows what happens when water is drawn from a river and used to irrigate farms. Note that:
- If this water had not been withdrawn, it would have continued downstream to the sea.
- But once the water is moved to a farm, most of it will either evaporate into the air or become incorporated into the crops that are being grown, which then may be shipped to far-away locations.
In other words, the water is still ultimately recycled, but not to the same river from which it was drawn. In other cases, water is used in a way that returns it to the river but with added pollutants such as chemical fertilizers or sewage. That is one reason why water pollution is a major problem in many parts of the world.
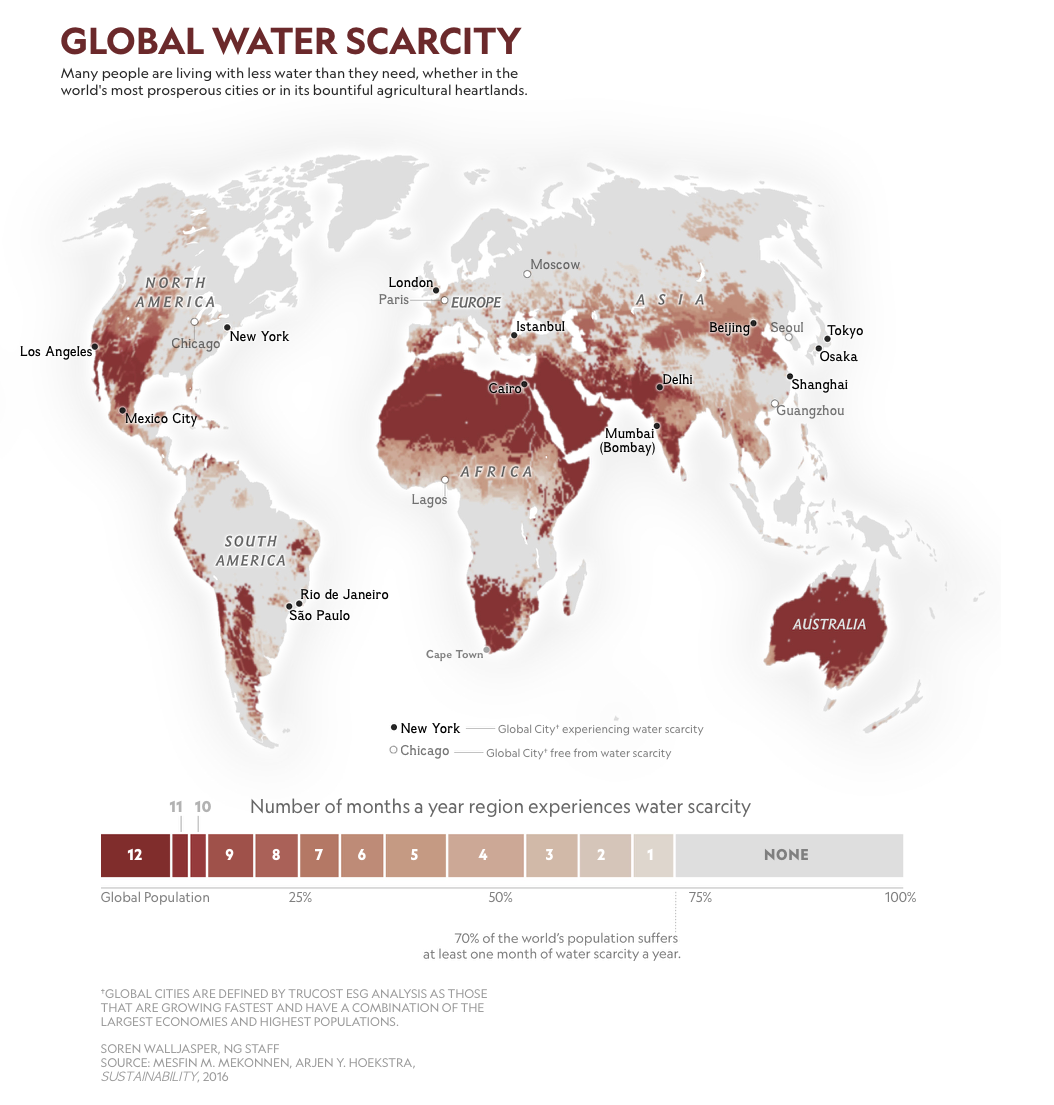
The availability of fresh water in any particular place depends on many factors: how much rain or snow falls, how much groundwater is available, the population, and the way in which water is used. Figure 6.1.2–9 shows how these (and other) factors combine to create different levels of water scarcity in different regions of the world.
Discussion
Water Scarcity
Discuss the following questions in small groups or as a class. You may need to do some research to find all the information needed.
- Find your location on the map in Figure 6.1.2–9. According to the map, how often (on average) does your region experience water scarcity? Does the answer from the map make sense based on your own life experiences?
- Find out where your local water comes from (for example, from a river, lake, glacier, or groundwater).
- Find out whether there has been an increase in water scarcity in your region. If so, why? If not, why not?
- Has your region ever experienced a severe water shortage that causes rationing or other conservation measures to save water? If so, learn about and discuss what happened. If not, learn about another region of the world that has recently experienced a severe shortage (for example, Cape Town, South Africa, in 2018) and discuss what happened there.
This optional discussion will help students understand water scarcity issues. It will be particularly relevant if you live in a region where scarcity is common. Notes:
- (1) For the first part of the question, students should be able to read the answer from the map, though you may need to give them some help to make sure they are interpreting the map correctly. For the second part, students should think about their own experiences with water and whether those agree with the map result. For example, if the map says that water scarcity is a significant issue in your area and it really is, then students should be able to cite their own experiences in needing to conserve water. Note that it is also possible that the map will be incorrect for your locality, since the map is not very fine-grained. In that case, students should be able to explain why they don’t think the map is correct for your case.
- (2) This question will require students to do some research to learn about the source of your local water supply.
- (3) Again, students will need to do some research to learn whether scarcity is becoming more common in your area. If it is, they should learn and discuss some of the reasons why. If it isn’t, they should consider what aspects of your local conditions (for example, living in an area with a lot of rainfall) are keeping water from becoming scarce.
- (4) This question is intended to get students thinking about the kinds of conservation measures that must be taken when water becomes scarce, either from local experience or by researching another case around the world.
Fresh Water Usage
Where is all the fresh water we use going? Broadly speaking, we can divide human use of water into three categories:
- Direct water use in homes, offices, schools, and cities. For example, at home we use water to drink, to wash clothes and dishes, to bathe or shower, and for cooking. If you have a house with a yard, you may also water grass or gardens. We use water for similar reasons in schools and offices. Cities may also have public landscaping, swimming pools, fountains, and other public uses of water.
- Agricultural water use. This means all the water needed to grow our food or crops like cotton that are used to make clothing.
- Industrial water use. This water is used to keep power plants, manufacturing, and other industries going. For example, water is used to generate steam in power plants and in many manufacturing process.
The first category (direct water use) is the most obvious form of water use and the one that most of us think about first. However, the other two categories actually use much more water. Figure 6.1.2–10 shows pie charts for the way water is used globally and in the United States. Notice that, in both cases, the “hidden” water use in agriculture and industry is far greater than the amount of water we use directly. Also notice that the two pie charts demonstrate that there is great variation in the way water is used in different parts of the world. In general, poorer countries use a larger fraction of their water for agriculture, while richer countries use more for industry.
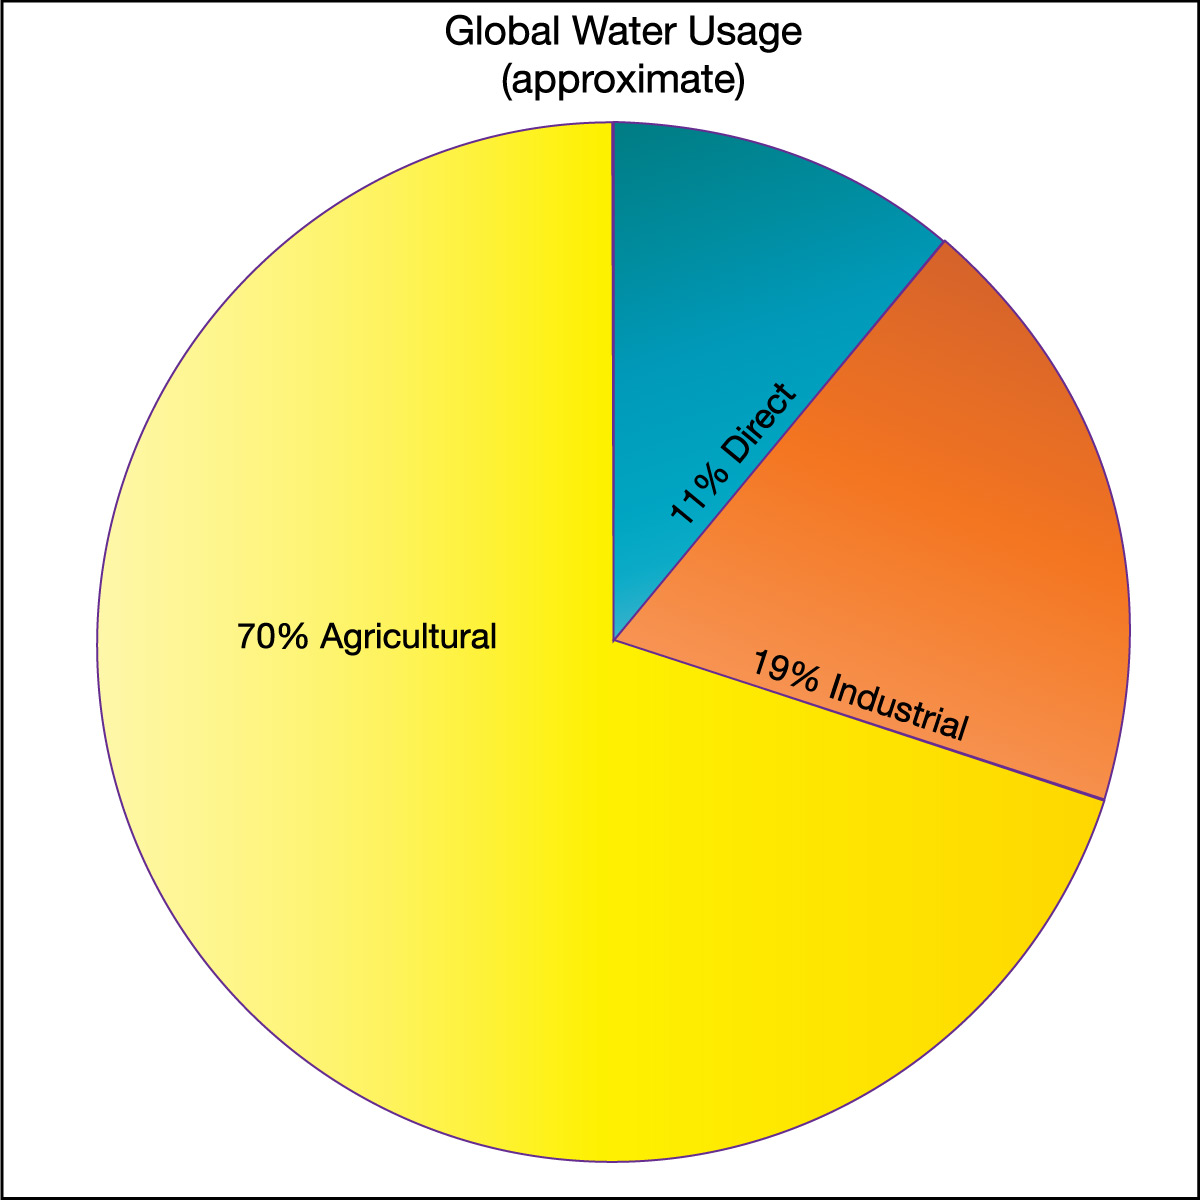
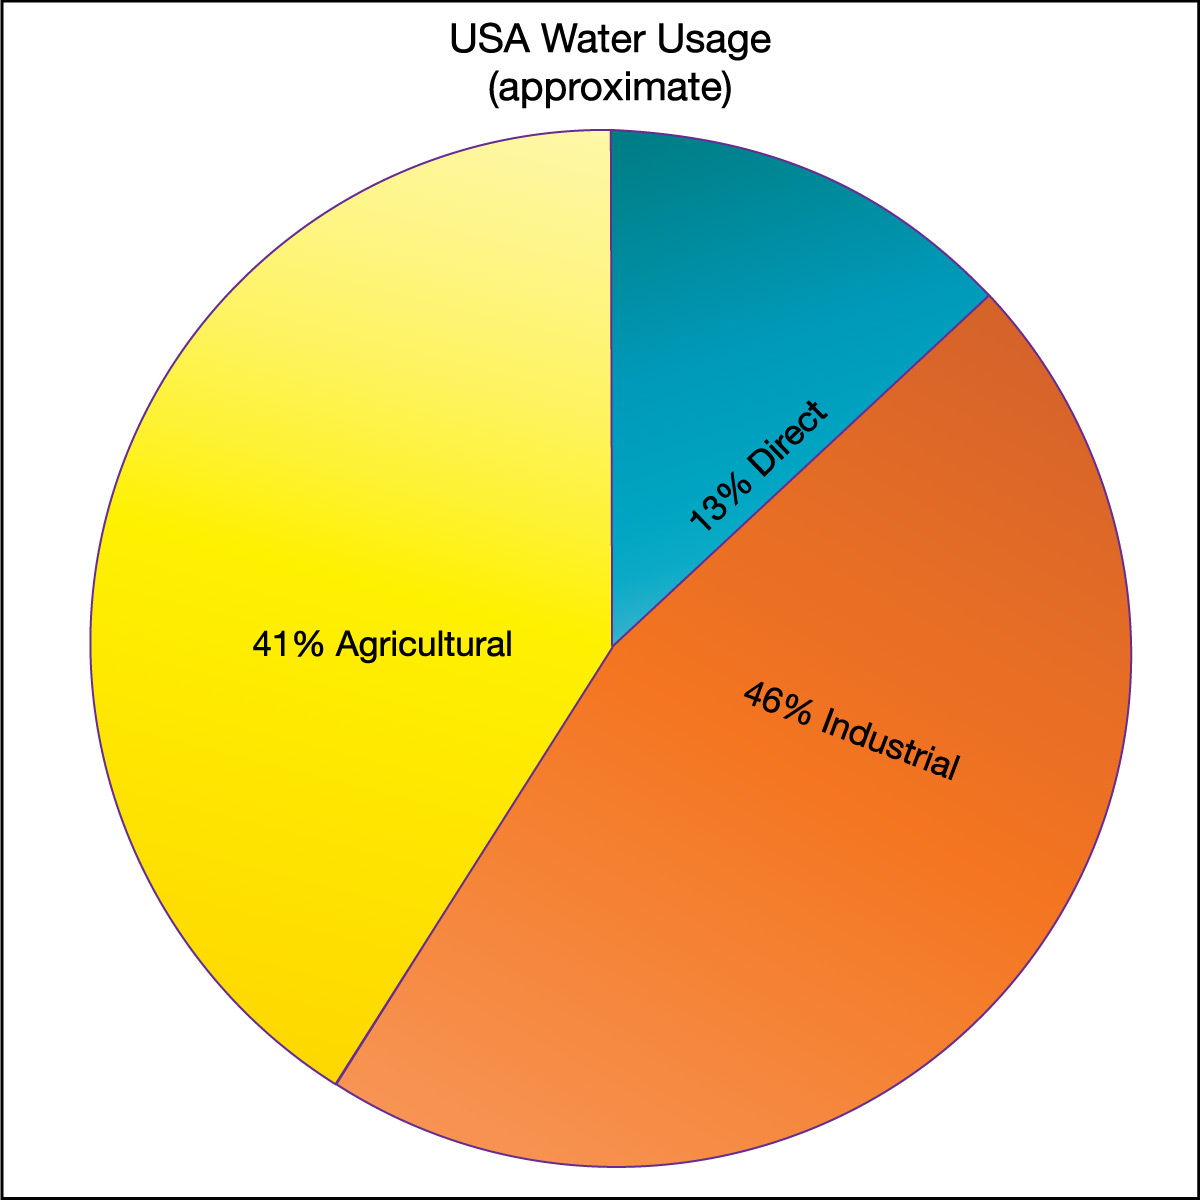
Figure 6.1.2–10 – Water use varies around the world, but in all cases the “hidden” water used in industry and agriculture far
exceeds the more obvious direct use in our homes and cities.
Credit: Data from the Food and Agriculture Organization of the United Nations.
The fact that so much of our water use is “hidden” means that when you are trying to conserve water, you must think not only about the water you use at home but also about the water going into the foods you eat and the products you buy. In essence, this means you want to know your personal “water footprint,” meaning the total amount of water that is needed to support your life style. We won’t go into much detail about calculating water footprints in this book, but you can use the following activity to explore the general idea.
Activity
Your Water Footprint, Part 1: The Food You Eat
For this activity, go to this interactive tool provided by the Los Angeles Times. As you explore the site, you’ll see that it allows you to create a plate of food, for which you can either select your own items or choose the “give me a random plate” option. It also allows you to choose your portion sizes, and then tells you how much water (on average in the USA) is needed to create that plate of food.
Note 1: You should do questions 1 to 3 of this activity individually, then come together as a class for question 4.
Note 2: The site uses units of ounces for the food items and gallons for the water. If you prefer to work in metric units, you can use the following conversions:
- For food: 1 ounce ≈ 28 grams
- For drink: 1 ounce = 29.57 milliliters (ml)
- For the water volume: 1 gallon =3.785 liters
- To make sure you understand the tool, start by choosing the “give me a random plate” option. Write down the four items (including your drink) that make up your meal, and the total amount of water required for that meal. Then, one item at a time, increase the portion size and see how it affects the water use. Be sure to write down the change you made each time and the change in water use that occurs.
- Next, create three more “random plates,” in each case writing down the items, portion sizes, and the total water use.
- Try to remember what you’ve eaten for each of your past three meals. For each of those actual three meals, create a plate (plus drink) that comes close to representing what you ate; be sure to estimate your portion sizes as well. In each case, write down the four items and the total water required for the meal.
- Now come together as a class to discuss what you’ve learned. For example, what types of food items tend to require the most water? Can you explain why?
- Based on the what you’ve learned, could our food choices make a significant impact on keeping fresh water available? Explain.
This activity investigates the “hidden water” in food, using the interactive from the LA Times. It should be fairly straightforward and illuminating for students. A few notes:
- (1) and (2): The biggest challenge will be for students to write down their findings in an organized way. We deliberately did not give a particular organizational scheme, as this is a good opportunity for students to think about how they will present information like this.
- (3) The choices in the interactive tool are fairly limited, so many students will not be able to reproduce their actual meals. However, encourage them to choose items that they suspect are similar to what they actually ate; in your class discussion, you could ask students to consider how well these choices in the tool are likely to approximate their actual food choices, or to do additional research to find the water impacts of their real food choices.
- (4) They should notice in general that their proteins tend to use the most water, especially if they eat meat. Moreover, some meat requires much more water than others: for example, compare chicken, pork, and beef. It’s worth discussing why beef requires so much water, which should help students recognize that cattle require huge amounts of grass or grain that all needs water to grow.
- (5) Here, students should remember that, globally, agricultural water use is the largest use of water. Therefore, food choices can indeed make a large impact. You can continue as deeply as you wish, perhaps having students consider choices they might wish to make to help with this issue.
In Chapter 7, we will discuss the related issue of carbon footprints, where different types of food have larger impacts on global warming as well. Many of your students will already be familiar with this idea, so you can feel free to take this opportunity to begin to introduce it and to notice that in many cases, the same choices will reduce both your carbon footprint and your water footprint.
Activity
Your Water Footprint, Part 2: More Hidden Water
The prior activity introduced you to the “hidden water” needed to make the food you eat. In many cases, this will be your single largest use of water. But there are many other ways in which we all use water, so use this activity to explore some of these.
- Working individually, use this interactive tool from the USGS to make an estimate of the total amount of water that your family uses directly each day. Be sure to include your entire family; for example, if there are four of you and each person brushes their teeth twice a day, then your family has a total of 8 brushings per day. Write down (or take a screen shot of) the data you used. Then submit your answers to find the total of this water use by your family. Be sure to read the explanation that goes with your answers, so that you will understand how different items contributed to the total water use.
- Now come together as a class and discuss what you learned about direct water use. For example, consider: Do any of the results surprise you? Which types of direct use require the most water? What do these results suggest about ways that we can save water?
- (Optional) Repeat questions 1 and 2 with this more detailed water footprint calculator, which includes both direct and hidden water usage.
- (Optional) As a class, watch this short video that summarizes many of the ideas we’ve discussed (plus some additional ones). Then create a “class action plan” for how you can contribute to water sustainability.
You can do this activity with or without having done the Part 1 activity first. It uses a different set of online resources to teach about water use and sustainability. Notes:
- (1) This activity should be fairly straightforward, as the interactive tool is easy to use.
- (2) This discussion can be either brief or more open-ended depending on the time you have available. Some of the items are likely to surprise students, such as how much water is involved in toilet flushes or using a washing machine. This should suggest many ideas about how to save water, such as low flow shower heads and toilets, more efficient (both for energy and water) dishwashers and washing machines, and so on.
- (3) Note that you can easily skip this part and go directly to the video in (4). If you do this one, note that this tool is much more complex than the one from question (1), so it will take considerably more time for students to use it for themselves and for your class discussion. The advantage of doing this one is that it includes industrial water use, which we did not consider in either the Part 1 Activity or in the first questions of this activity.
- (4) The video is about 6 minutes long and quite good, so you may wish to watch and discuss it. Note, however, that it goes a bit beyond what we’ve covered here, such as defining “blue,” “green,” and “gray” water.