CHAPTER INTRODUCTION
(b) The same data is shown here on a flat map, so that it is easier to see how the colors change all around the world over the course of the year.
Figure/Video 6–1 – These maps and videos show Earth as it would appear in approximately true color without clouds over the course of a single year. Credit: Reto Stöckli, NASA Earth Observatory.
The videos above show how our world’s appearance changes over the course of a single year. Notice that some of the changes are quite dramatic, such as the changes in which we see snow cover come and go, and changes in vegetation with the seasons.
These visible changes on Earth — including the changes in vegetation — are a result of the way air and water move and change with time. Therefore, if we wish to understand the conditions we experience over the course of each year, we must study the workings of air and water, which means of our atmosphere and hydrosphere . That is what we will do in this chapter.
Discussion
Earth’s Annual Cycles
- How do the time scales of the changes shown in Figure/Video 6.1 compare to the time scales of the geological changes we discussed in Chapter 5?
- What is the source of energy driving the kinds of changes shown in Figure/Video 6.1? Is it the same or different from the energy source that drives the geological changes we discussed in Chapter 5?
- Broadly speaking, the colors over land in Figure/Video 6.1 are either white, tan, or green. What does each color represent?
- What kinds of seasonal patterns are revealed by the color changes? Why do they occur?
- Do you notice any geographic patterns in the locations of the tan and green regions? What do you think these patterns tell you about what we might call “climate zones”?
- Do you see any notable patterns that affect your particular location on Earth?
This discussion should be kept fairly brief, as an introduction to the chapter content. Notes on the questions:
- (1) The time scales here are much shorter than geological time scales, with changes occurring over a single year instead of over thousands or millions of years.
- (2) The energy source for these annual changes is sunlight; the energy source for most geological change and plate tectonics is Earth’s internal heat.
- (3) The whites are snow or ice cover, the greens are forest cover, and the tans are generally desert.
- (4) Students should notice that the seasonal changes are opposite in the two hemispheres, and recognize that greening occurs in summer and snowfall occurs in winter.
- (5) For this question, we want student to start thinking about the concept of climate zones by noticing that the forest and desert regions are generally confined to particular latitude bands.
- (6) The answer will depend on where you live. Students should note, for example, whether your location sometimes becomes snow-covered or has notable vegetation changes over the course of a year.
Activity
Weather Forecast Accuracy, Part 1
One of our goals in this chapter will be to understand the basic concepts of weather forecasting. Today, it is easy to find a 10-day weather forecast online for almost any place on Earth. However, as you know, these forecasts are not always reliable. This activity will help you get a sense of the accuracy of weather forecasts. Because you’ll need to compare forecasts and actual weather for at least a couple weeks, we’ll get started here with this “Part 1” activity. We’ll then return to it at the end of the chapter, to see how accurate the forecasts proved to be. Here’s what you’ll need to do:
- Choose a source for a local 10-day weather forecast. Check the forecast each day and carefully record the following:
today’s actual weather
the forecast for 24 hours from now
the forecast for 3 days from now
the forecast for 5 days from now
the forecast for 7 days from now, and
the forecast for 10 days from now. - After the first day, begin keeping track of the accuracy of each forecast. We suggest using a rating system of 1 to 5, where 1 means the forecast was way off and 5 means it was almost a perfect match to the actual weather.
For example, suppose that on Monday, the 24-hour forecast called for sunny skies with mild winds and a temperature of 68°F. If the actual weather on Tuesday turns out to be very close to that, then you would rate Monday’s 24-hour forecast as a 5. If the actual weather turns out to be rainy and only 50°F, then you would rate the forecast as a 1 because it was so far off. - For the 1 to 5 ratings, you should try to come up with some guidelines that will help you assign your ratings. Here is one possible example, but your class might also come up with its own:
1: The weather was completely different from the forecast, raining or snowing when clear skies were forecast. If I had made outdoor plans, the forecast would not have allowed me to prepare properly.
2: The weather was significantly different from the forecast, the observed high/low temperatures were more than 8 degrees off of the forecast temperatures. I would have had to change my outdoor plans and clothing from what was forecast.
3: The weather was fairly different from the forecast; almost as though the weather pattern from the day before stretched on a bit longer (or was cut off sharply). I could still have planned my outdoor activities from the forecast, but would have added/taken away from the clothing I needed to be comfortable.
4: The weather was very close to the forecast, but was a bit more (or less) cloudy/sunny/windy/rainy/humid/dry. My outdoor activities would have been just as enjoyable, and I would still have been relatively comfortable in the clothes I planned to wear.
5: The weather matched the forecast almost perfectly, the observed high/low temperatures were within one or two degrees of the forecast temperature. I could have used this forecast to choose my outdoor activities and clothing.Once you’ve defined your rating system, you will need to use your judgment to decide the rating that each forecast deserves. You should discuss this as a class, voting on it if necessary, so that you all agree on each rating.
Keep careful records, since we’ll use these in the “Part 2” activity at the end of the chapter.
We strongly recommend doing this activity, since it will help your students evaluate real data on the accuracy of weather prediction. We suggest doing it as a class, rather than individually, so that you help students keep a single class record of the forecasts and actual weather each day.
- Remember to start this activity early and continue it for at least 2 weeks, since that is the only way to get enough data on the longer-term forecasts. This is because you obviously must wait a full 10 days to rate the reliability of a 10-day forecast, so it won’t be until day 11 that you’ll get your first data point for the reliability of the 10-day forecast.
To get a good data set, you should plan to continue the activity through weekends/holidays by having students collect those data as homework and then fill them into your class record when they return to school.
You may wish to set aside a few minutes each day to have students record the data and evaluate the past forecasts for which the date has now arrived (such as evaluating yesterday’s 24-hour forecast, or the 3-day forecast from 3 days ago). Alternatively, you might have a small group of students handle the data recording for the class, or rotate through different groups of students so everyone gets a chance. - The most challenging part of this activity is to keep good track of the data, so that it is possible for students to see: (1) how accurately a particular forecast has turned out; and (2) how the forecasts themselves change from day to day. We suggest allowing students to help you create the format, since this is a great exercise in thinking about scientific data collection. If their first format proves unwieldy, then you can help them make adjustments to it as time goes on, until it is well organized. Feel free to use this tracking sheet if needed.
- The next most challenging will be getting students to agree on the rating for the accuracy of each forecast. The 1 to 5 rating system that we recommend is subjective, so you’ll want to help students make sure they apply it consistently for all the ratings throughout the period in which you do this activity.
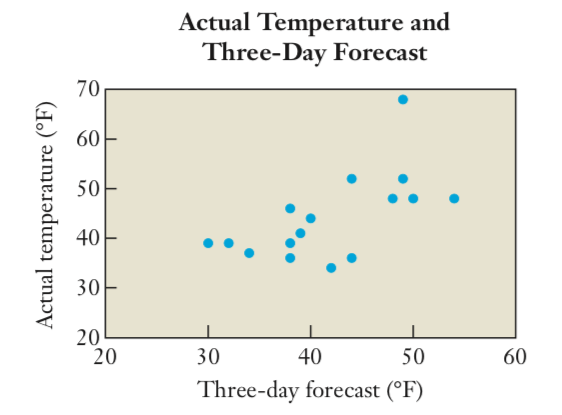
If you would like a more quantitative approach to evaluating the forecasts, you could have students create a series of scatter diagrams for various aspects of the weather. For example, we show below a scatter diagram that compares 3-day forecasts and actual temperatures (this one does not have a very strong correlation, meaning the forecasts were not very accurate). If you make similar ones for the temperature forecasts over other time periods, it will be easy to compare to see how the accuracy depended on the forecast time length. Other aspects of weather, such as cloudiness, wind, and precipitation will be more challenging for making scatter plots, and are probably best done by creating rating systems for each of these individually.
- We suggest that you post the record of predictions and actual weather in a prominent place in your classroom (on your class web page), so that students can easily check it every day.