The ocean currents also have a general global pattern. However, the current patterns are somewhat more complex than the global wind patterns. You can understand the reasons behind this added complexity by recalling the four major drivers of ocean currents that we have already discussed: winds, land distribution, tides, and water density differences determined by temperature and salinity.
The fact that the first driver is winds means that all the factors that affect wind patterns, including solar heating and the Coriolis effect , also affect ocean currents. When you then add the additional factors that affect ocean currents, especially the deep-water circulation driven by density differences, it should be no surprise that the global ocean circulation becomes quite complex.
In this section, we’ll briefly examine ocean current patterns. We’ll start by focusing on surface currents, meaning currents that flow near the ocean surface, then look at how deep-water circulation leads to a global “conveyor belt” that moves water throughout the entire ocean system.
Surface Ocean Currents
Let’s return again to the Earth Project simulation that you first explored at the beginning of Section 6.2. The project gives you surface winds by default, but Figure 6.2.3–1 shows how you can set the menu controls to view surface ocean currents instead. (You may have done this already in earlier activities.)
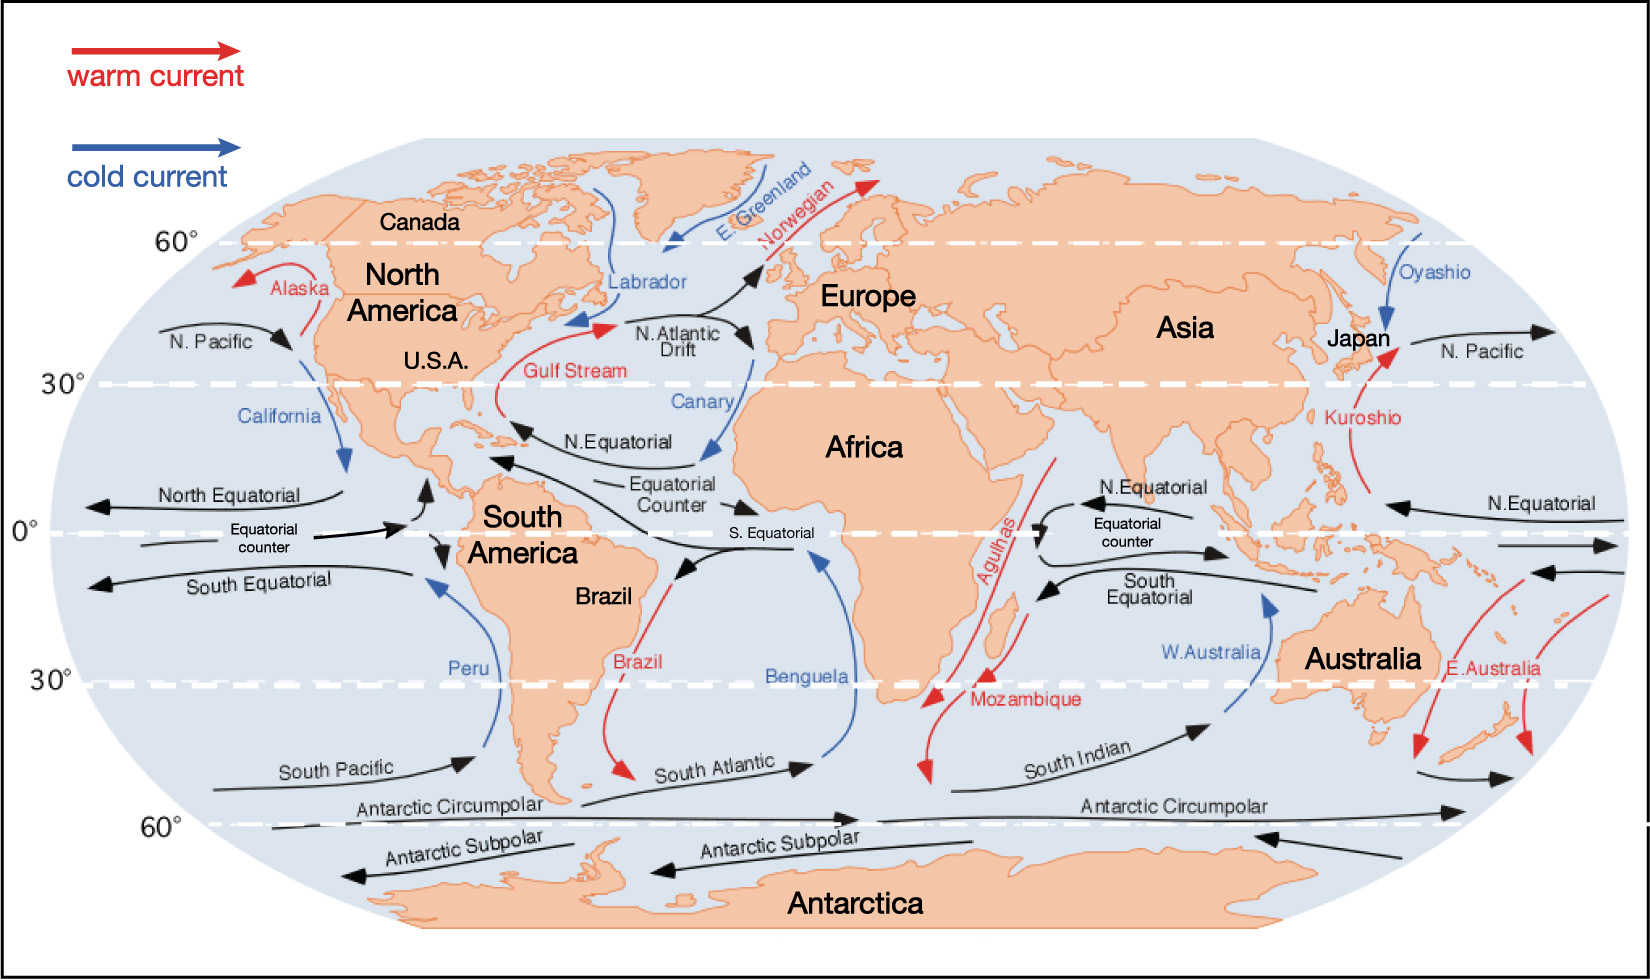
You can see that surface currents are complex, but there are a few major patterns. Figure 6.2.3–2 identifies the directions and names of major surface currents. The red arrows represent currents carrying warm water to colder regions, which means they generally flow from lower latitudes (closer to the equator) to higher latitudes (closer to the poles). The blue arrows represent currents carrying cold water to warmer regions, which go in the opposite direction. These currents can have major effects on climate, because of the moderating effects of oceans on air temperature that we discussed in Section 6.2.1.
Discussion
Major Surface Currents
Discuss the following questions in small groups or as a class as you study Figure 6.2.3–2.
- Find the Gulf Stream. Explain how this current gives the northeastern United States, eastern Canada, and western Europe warmer climates than they would have otherwise.
- Do you see a current that you would expect to have a similar effect on Japan (giving it a warmer climate than it would have otherwise)? What is the name of the current?
- Look at the dashed line for latitude 30°N as it cuts across North America. Now imagine going to the beach at that latitude on the west coast (near California) and the east coast (near Florida). In general, where you expect to find the ocean warmer, and why?
- Bonus: Choose at least one other current shown in Figure 6.2.3–2 that flows along a coastline. Do a web search to find out what types of climate effects it has on the coastal regions that it passes by.
This discussion is intended to help students learn about surface currents and to think about some of their climate effects.
- (1) This question reviews ideas we’ve discussed about the Gulf Stream previously. Students should recognize that the fact that it is carrying warm water northward along the east coast of the United States and Canada means that it moderates the climate in those regions. It has the same effect on northern Europe, through its connection to the North Atlantic Drift current. That is why the northeast USA, eastern Canada, and northern Europe have more moderate climates that regions of the same latitude on the opposite coasts of their respective continents.
- (2) The Kuroshio current carries warm waters northward past Japan.
- (3) The water would be warmer o the east coast. On the west coast, the California current is bringing cold water southward, which makes the ocean temperature much cooler at beaches in California than at beaches of the same latitude on the east coast.
- (4) This should be an easy research project. For example, most of these currents have Wikipedia pages that give a brief overview of their climate effects.
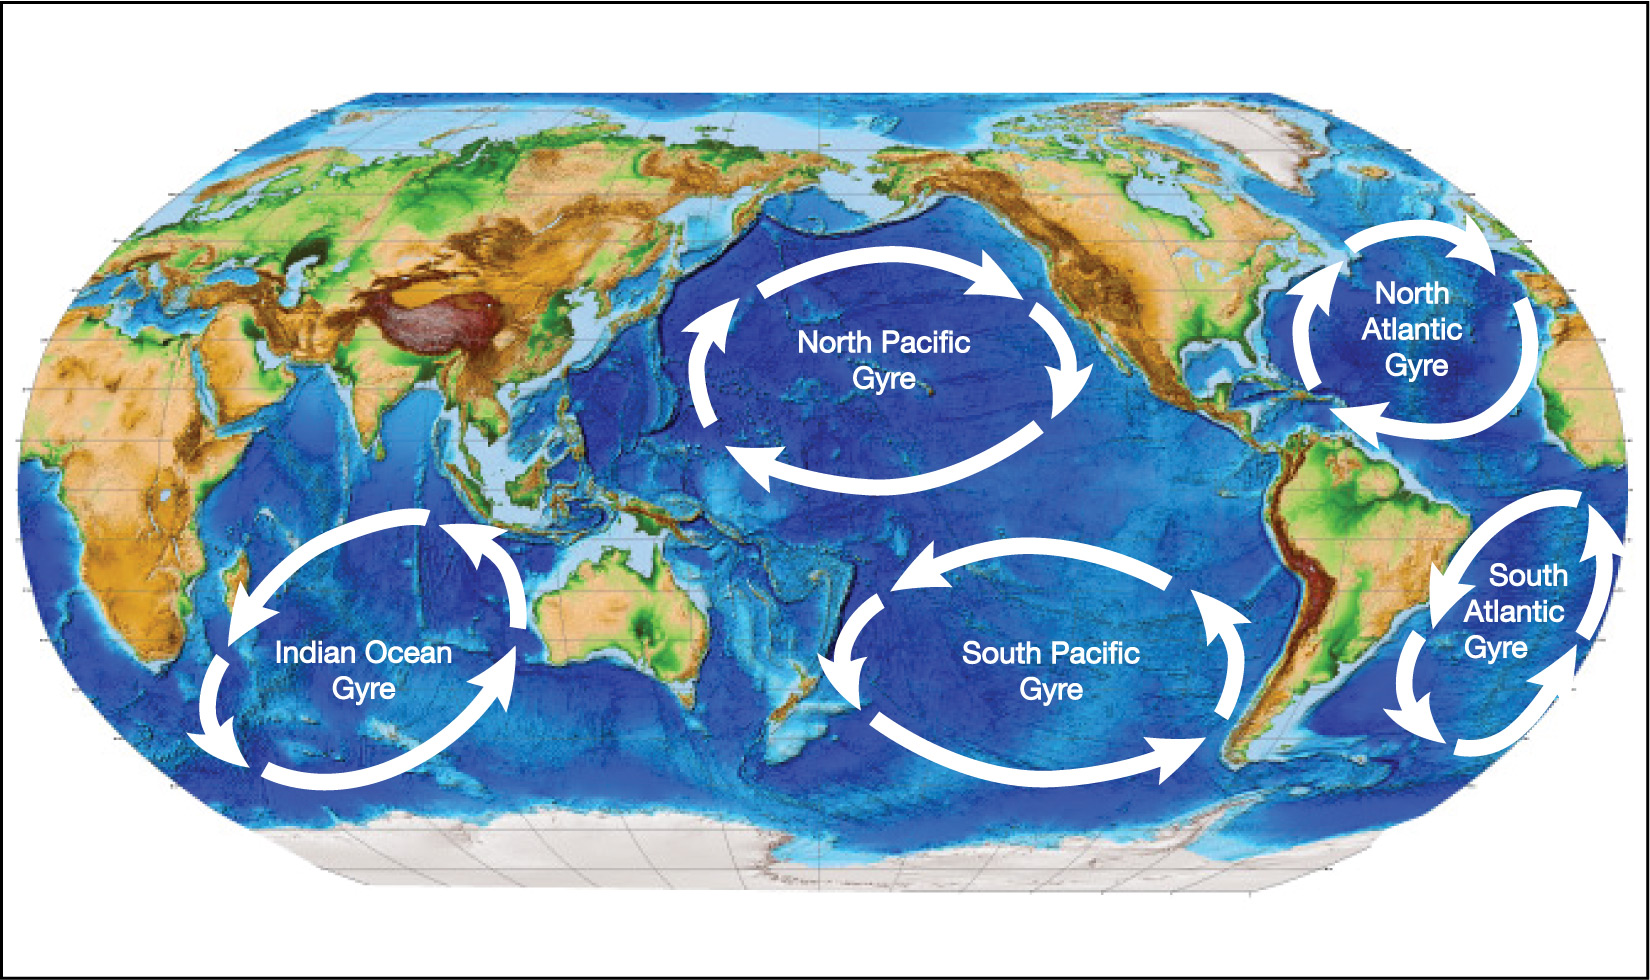
Notice that some of the currents in Figure 6.2.3–2 connect to each other in ways that form large, roughly circular patterns of current. These circular patterns are often called gyres (pronounced like “jai-urs”). Figure 6.2.3–3 summarizes the linkages between currents to make five major gyres in Earth’s oceans.
Discussion
The Ocean Gyres
Discuss the following questions about the ocean gyres in small groups or as a class.
- Compare Figure 6.2.3–3 to Figure 6.2.3–2. What major currents (give their names) form the North Atlantic Gyre? What major currents form the North Pacific Gyre? Extra credit: name the currents that form each of the other three major gyres.
- Notice the direction in which the currents circulate in the five major gyres. Explain how this shows the Coriolis effect in action.
This should be a very short discussion, since the answers should be easy for students to explain.
- (1) The North Atlantic Gyre links the Gulf Stream, North Atlantic Drift, Canary, and North Equatorial Currents. The North Pacific Gyre links the California, North Equatorial, Kuroshio, and North Pacific currents. The extra credit can be done simply by looking for the similar loops of currents for the remaining gyres.
- (2) The gyres swirl in opposite directions in the two hemispheres, just as we expect for circulation driven by the Coriolis effect.
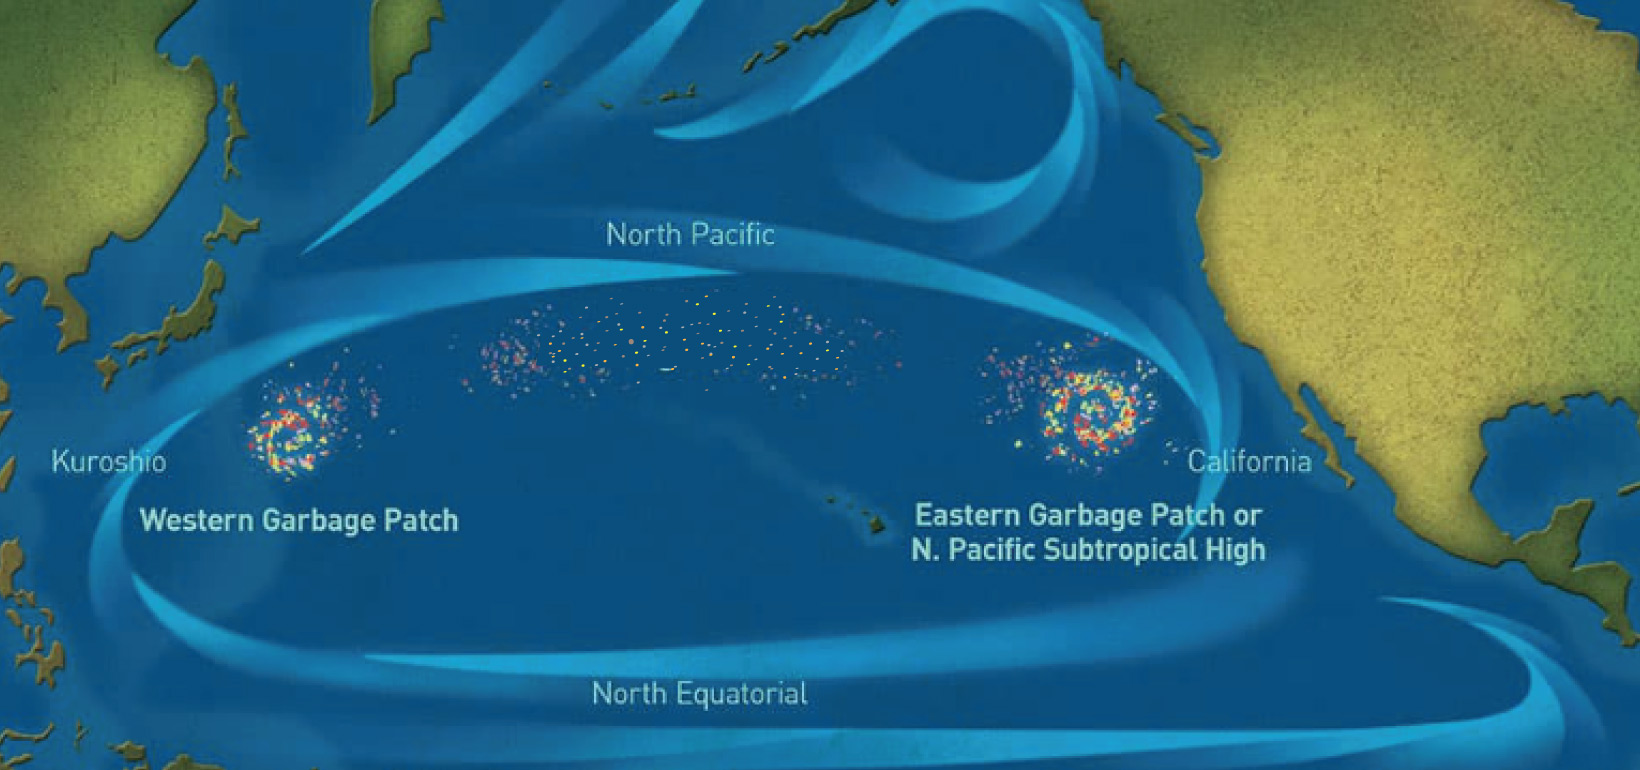
The ocean gyres can move water — and anything floating in it — vast distances across the oceans. In recent decades, this has had an unfortunate consequence on ocean pollution. Humans dump vast amounts of garbage into the ocean including plastic waste, fishing gear, and more. The gyres move this garbage across oceans, and more localized currents can cause it to collect in certain areas, or to end up on certain beaches. For example, Figure 6.2.3–4 shows how the North Pacific Gyre has caused “garbage patches” in several areas of the Pacific Ocean.
Activity
Garbage Patch Presentation
Learn more about garbage patches in the ocean: what they are, how they affect the oceans, and how we might clean them up. Then create a presentation about them in a form of your choosing, such as a poster, a video, a slide show, or a group skit. Be creative, but be scientifically accurate.
Note: You can find many web sites that will help you learn about garbage patches for your presentation, but here are three good places to start:
- Listen to (or read the transcript of) the NOAA Ocean podcast about garbage patches that you can find here.
- Read this short NOAA web page about garbage patches.
- Visit the web site of “The Ocean Cleanup,” which is a nonprofit seeking ways to clean up the oceans.
This activity gives students a chance to explore how currents and gyres move our human garbage around the ocean, and what we might do to clean up this problem in the future. Look for creativity in the student presentations.
Deep-Water Ocean Currents
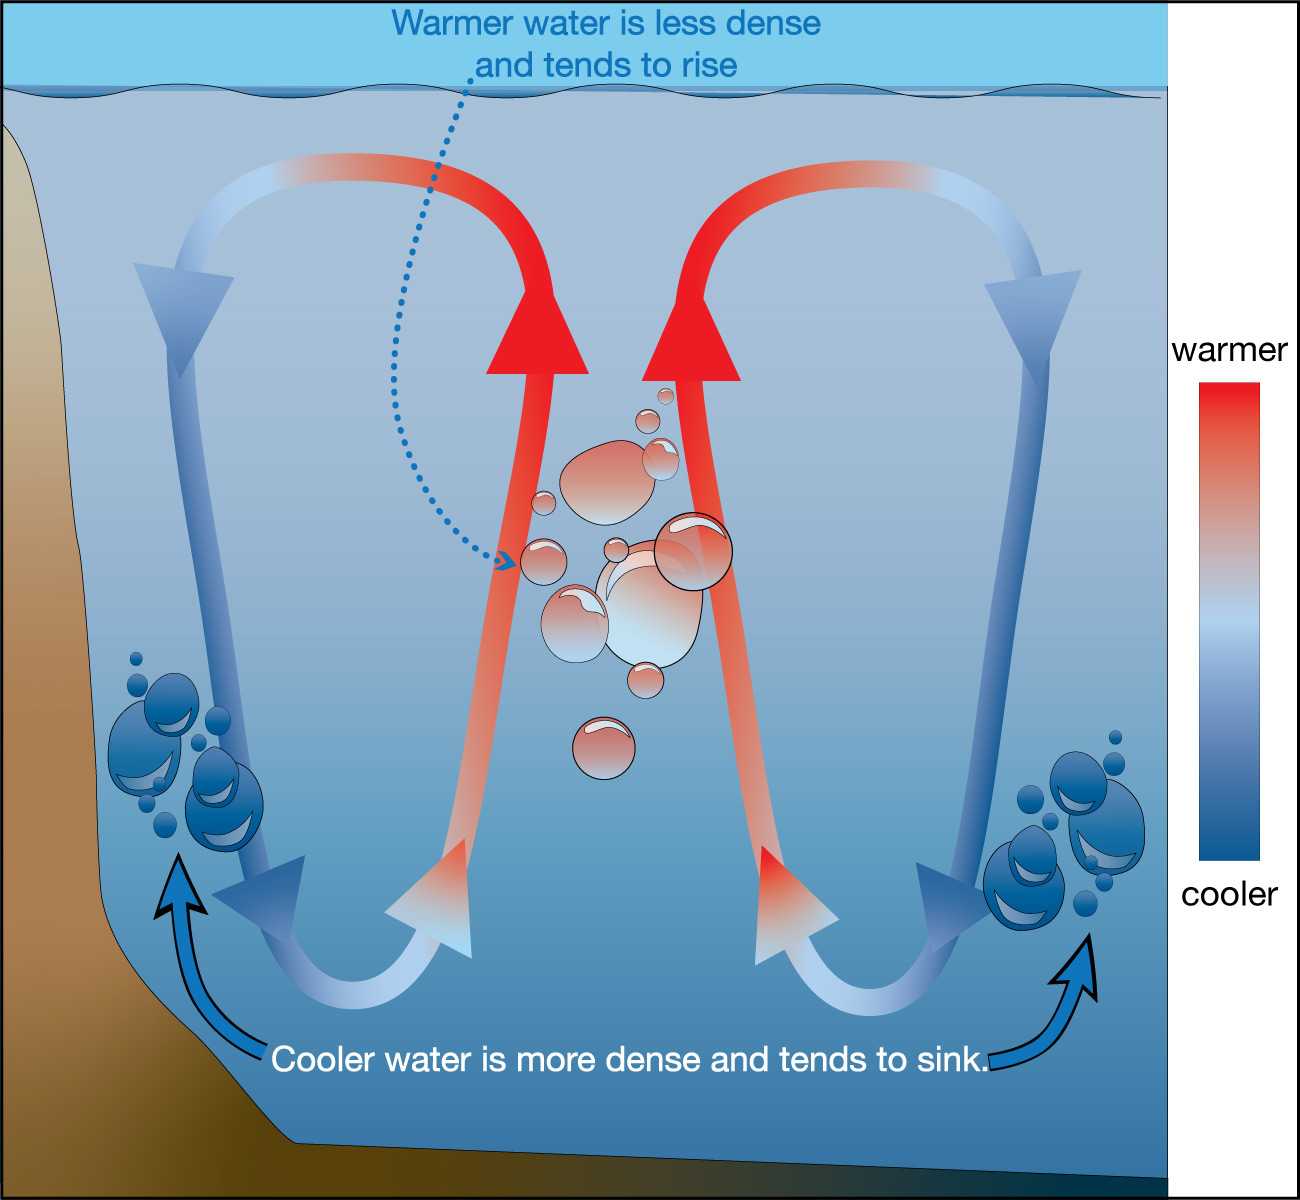
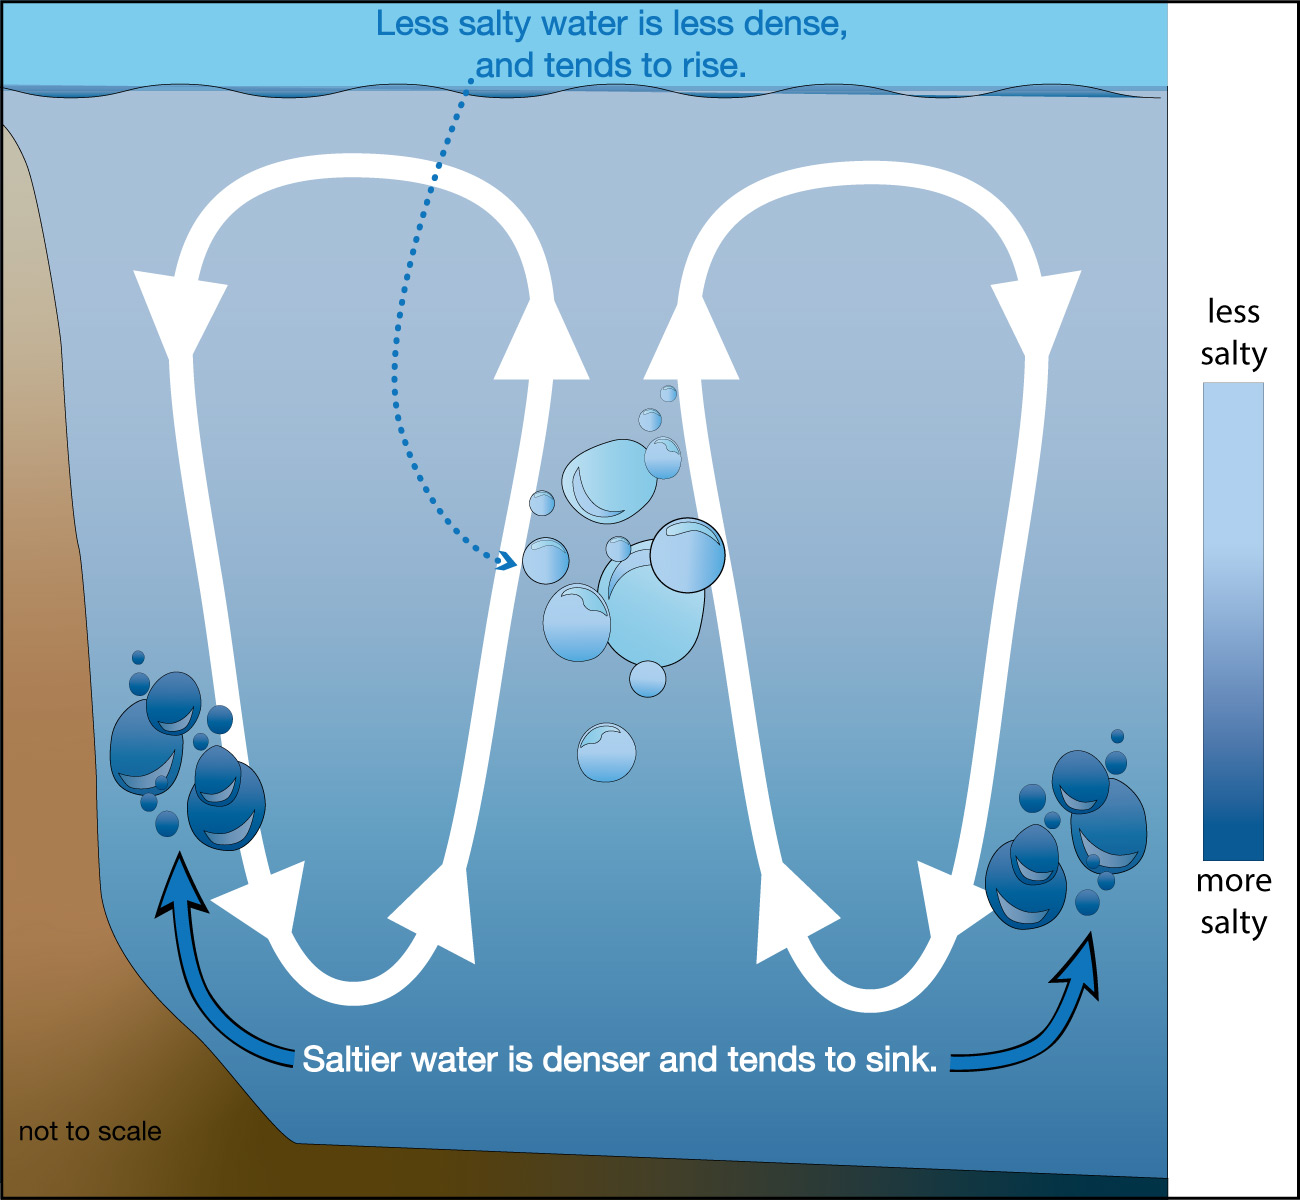
If you looked only at the surface currents we’ve studied so far, you might think that water moves only near the ocean surface, circulating around in the gyres. However, as you already know from our discussion of density differences caused by temperature and salinity, water also moves upward and downward in the oceans, with cooler and saltier water sinking and warmer and less salty water rising.
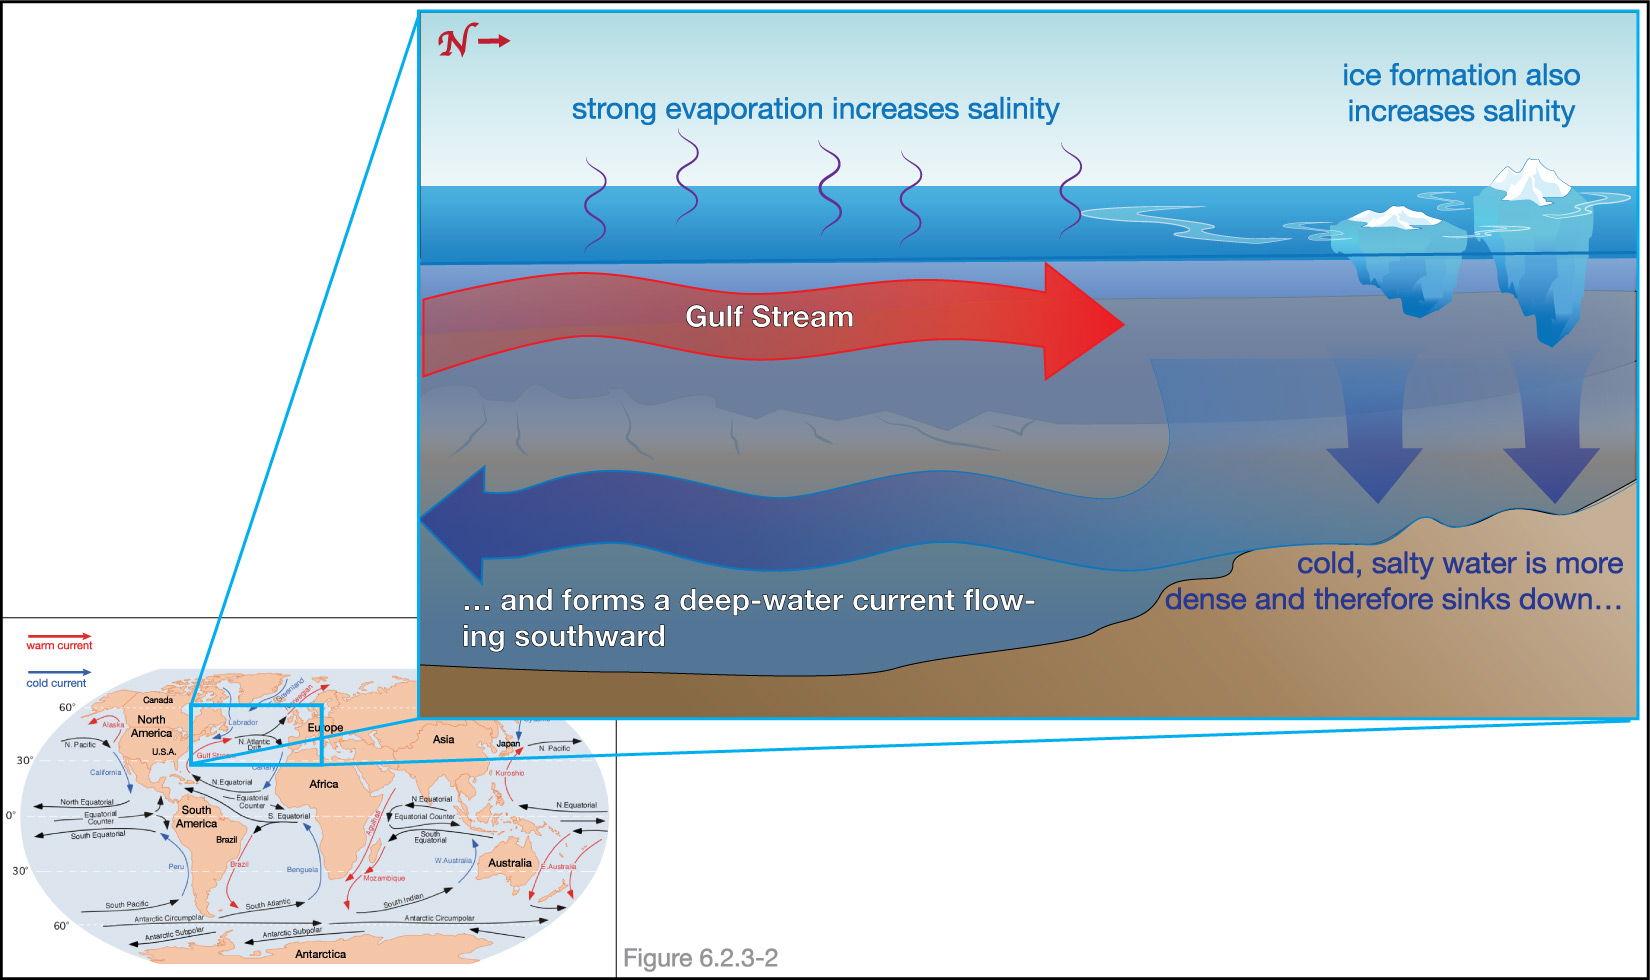
To understand how this vertical water motion affects the ocean currents, let’s focus in on one particular region: the North Atlantic, where the Gulf Stream meets the cold water of the Arctic Ocean. Use the following questions to help you understand why this is a region where there is a strong downward flow.
Discuss the following questions with a classmate. Then click to open the answers to see if they agree with what you came up with.
- The water flowing northward with Gulf Stream is warmer than its surroundings. How would you expect this to affect the amount of evaporation from the Gulf Stream compared to its surroundings?
The warmer temperature of the water should mean more evaporation.
- How does evaporation affect the salinity of the Gulf Stream water?
Evaporation increases the salinity of the remaining water. You’ll understand this fact if you recall that evaporation leaves salts behind, which is why you can make salt by evaporating seawater (see the Activity “Making Salt Through Evaporation”).
- Parts of the Arctic Ocean freeze into ice, especially in winter. Does this cause the Arctic water to be less salty or more salty than it would be otherwise?
If you’ve answered the above questions successfully, you’ll notice that both the extra evaporation in the Gulf Stream and the presence of ice in the Arctic Ocean work together to give the water in the North Atlantic a significantly higher salinity than average for the oceans. This water is also cold because it is so far north (the warm waters of the Gulf Stream cool as they go northward).
To summarize, the North Atlantic water is both cold and high in salinity. Both of these factors make the water more dense (see Figure 6.2.1–16), which causes it to sink downward. Once this water sinks down, it must go somewhere, so it flows as a deep, cold current headed back toward the south. Figure 6.2.3–5 shows the flow pattern created in this North Atlantic region.
The Global Ocean Conveyor Belt
Look again at Figure 6.2.3–5. One way to think about what you are seeing is to imagine following a small parcel of water as it moves with the currents shown in the figure. For example, consider a parcel of water that is just under the surface near the beginning of the red arrow in the figure. The figure shows that the parcel would then follow this path:
- It would move northward with the Gulf Stream, staying just under the ocean surface.
- When it reaches the North Atlantic, it would plunge downward to great depth.
- Then it would remain at this depth and move southward.
The figure does not show what happens after that, but if you think about it, you’ll realize that the parcel must eventually return to the surface. But where? To answer this question, scientists have made detailed, careful measurements of both surface and deep-water currents around the world. In doing this, they have discovered that the water parcel would ultimately make a long circuit that would take it through all of Earth’s oceans, sometimes near the surface and sometimes at great depth.
Figure 6.2.3–6 shows a simplified model of the overall path that the water parcel would follow. Notice that, at least in this simplified model, the parcel would eventually return back to its starting point. For this reason, the overall circulation of ocean water along this path is sometimes called the global ocean conveyor belt , though it also goes by the fancy name thermohaline circulation . The circulation is fairly slow. On average, it is estimated that any small parcel of water takes about 1,000 years to complete a journey around the conveyor belt.
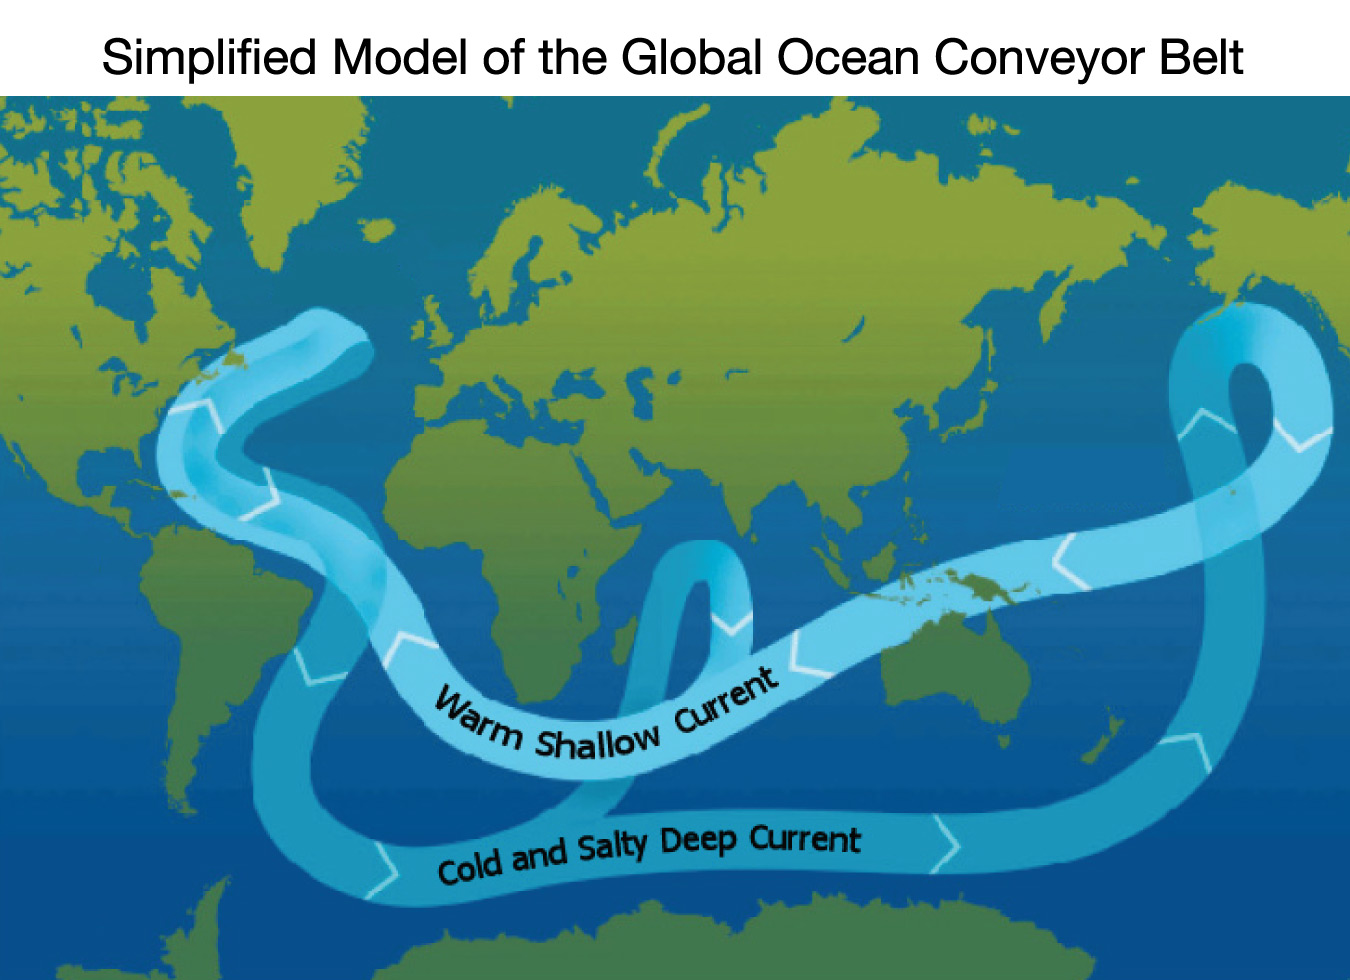
Keep in mind that the figure above shows a very simplified model of the actual circulation. There are many offshoots that are not shown. This means that, in reality, any particular parcel of water is unlikely to return to its exact starting point, even after “completing” a trip around the world’s oceans in the average time of 1,000 years. In case you are curious, Video 6.2.3–7 shows a more realistic view of what the global ocean conveyor belt would look like, if you could watch its motion for many centuries.
Video 6.2.3–7 - This NASA visualization, based on more detailed models of the global ocean conveyor belt, shows what you might see if you could watch its flow for many centuries. Notice, for example, that the actual flow in the North Atlantic is much more complex than shown in the simpler model of Figure 6.2.3–6. The colors in the ocean represent the density of the water: darker blue is denser and lighter blue is less dense. The arrows are shown brighter for surface currents and somewhat greyer for deep-ocean currents. Credit: NASA Scientific Visualization Studio.
Claim-Evidence-Reasoning Activity
Impact of Global Warming on The Global Ocean Conveyor Belt
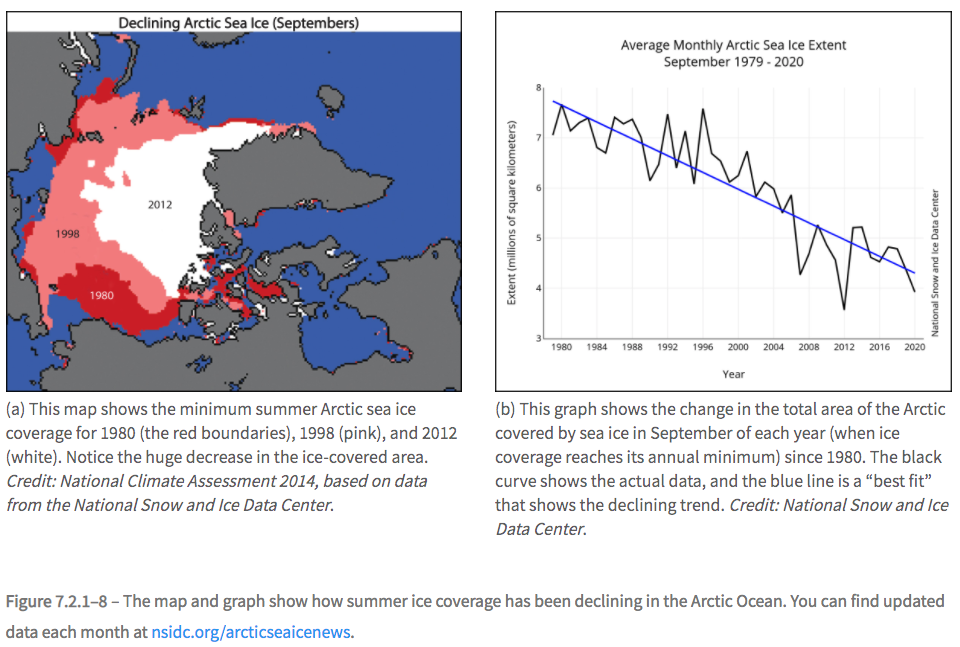
As we will discuss in Chapter 7, global warming is having a particularly strong impact on Arctic regions, causing higher temperatures and a dramatic decline in sea ice in the Arctic Ocean (see Figure 7.2.1-8). Based on what you’ve learned about the global ocean conveyor belt and how it depends on water density, decide which of the words strengthen, weaken, or have no effect on correctly fill in the blank in the following claim, and then support your claim with evidence and reasoning.
Claim: Global warming is likely to ___________ the flow of currents in the global ocean conveyor belt.
(Fill in the blank with the correct choice between the words strengthen, weaken, or have no effect on.)
This CER activity should be fairly straightforward if students have followed and understood the discussion this section. Key points:
- The warmer Arctic temperatures will tend to make the water in the North Atlantic less dense, since warmer water is less dense than colder water.
- As discussed in the Q&A under the heading “Deep-Water Ocean Currents” above (and in the box I was Wondering “Arctic ice is frozen seawater, so why is it fresh instead of salty?”), ice formation makes the water saltier and more dense. Therefore, melting ice makes the water less saline and less dense.
- Both of the above effects make the North Atlantic surface water less dense, which means it will sink downward less strongly, thereby reducing the strength of flow in the global ocean conveyor belt.
Fyi: While it seems clear that global warming could weaken these currents, there is great uncertainty about how much they would weaken, how fast the weakening could occur, and what consequences the weakening might have. Most scientists doubt that the weakening will be great enough to have major effects, but we cannot completely rule out that the possibility of reaching some “tipping point” that might have major effects. For example, remember that the Gulf Stream keeps the climates of the northeastern USA, eastern Canada, and northern Europe much warmer than they would be otherwise. Therefore, if the Gulf Stream were to weaken significantly, it might actually make these regions become colder, even while the world as a whole continues to warm.
Note: Some of you may also recall the science fiction film “The Day After Tomorrow” (2004), which imagined that the disruption of the ocean currents might plunge the entire Earth into an ice age. However, while this idea may have had some entertainment value, it is highly unlikely that it could actually occur.