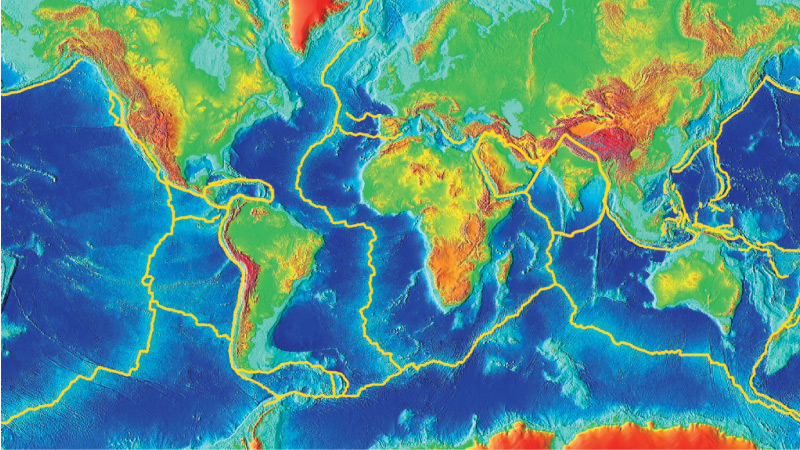
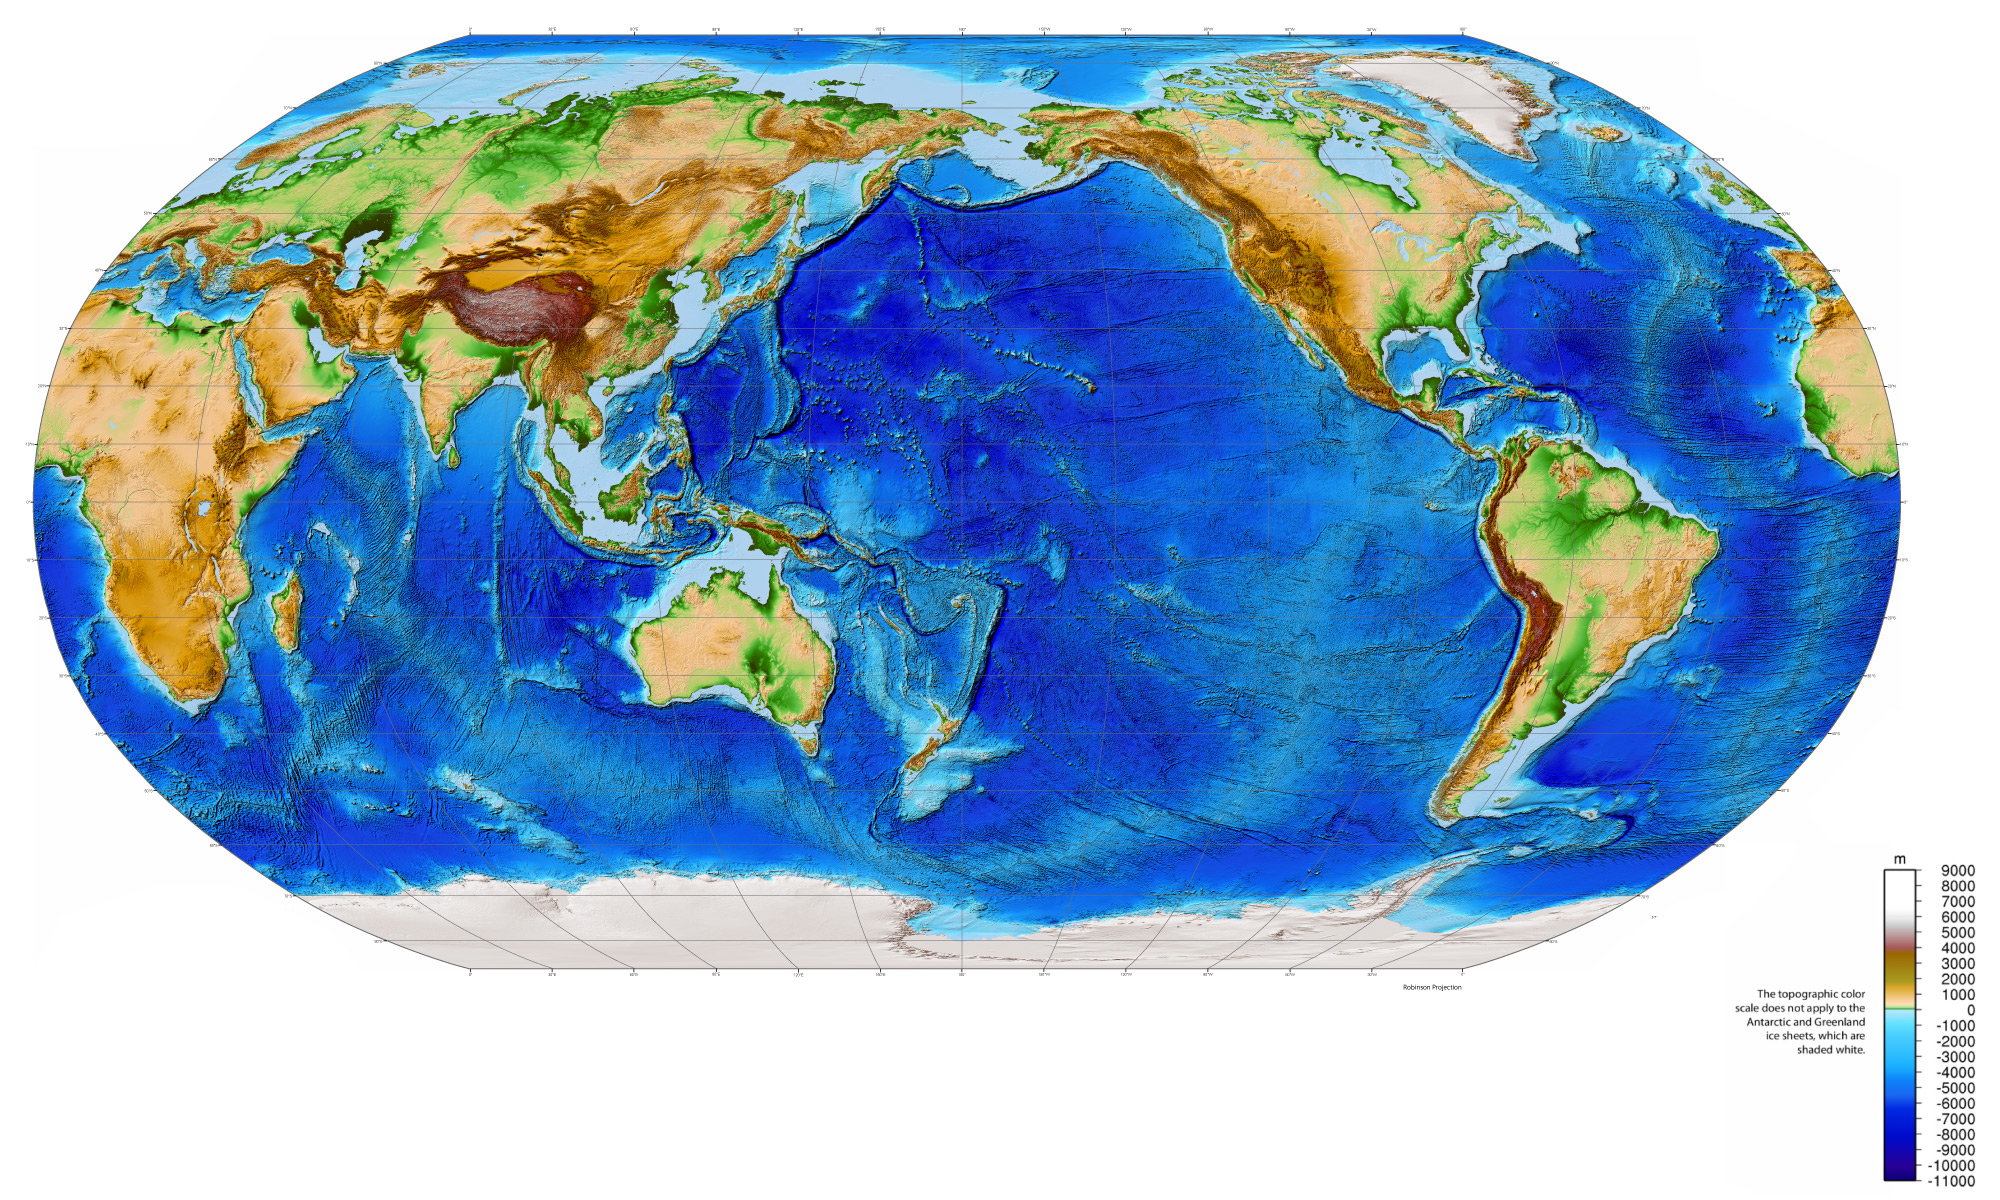
Take another look at the global relief map you first saw in Slide Show 4.8, repeated below. Spend a minute or two exploring the zoomable version of the map, focusing on how the features you see on the ocean floor compare to those you see on the continents.
Discuss the following question with a classmate. Then click to open the answer to see if it agrees with what you came up with.
- Based on study of the global relief map (Figure 5.2.2–1), which of the following best describes how the topography of seafloors compares to that of continents? Explain your choice clearly.
A. The overall topographies of the seafloor and the continents are very similar.
B. Overall, the seafloor is much more varied in its features than the continents.
C. Overall, the seafloor is much smoother and flatter than continents.
The answer is C: Aside from the mid-ocean ridges, trenches, and islands, most of the seafloor is much smoother and flatter than the continents.
The varied landscapes of the continents (compared to the smoother seafloors) reflect the fact that geological forces are continually transforming their surfaces. Some of these transformations occur rapidly, such as when a volcano erupts or landslide changes the shape of a mountain; we’ll discuss these rapid events — and the dangers they pose — in Section 5.2.3. Here, we’ll focus on three major types of change that generally occur much more slowly: (1) mountain building and uplift, (2) weathering and erosion, and (3) ice ages and glaciation. Keep in mind that because the continents are much older than the seafloor, these changes have been transforming the continents for a much longer period of time.
Mountain Building and Uplift
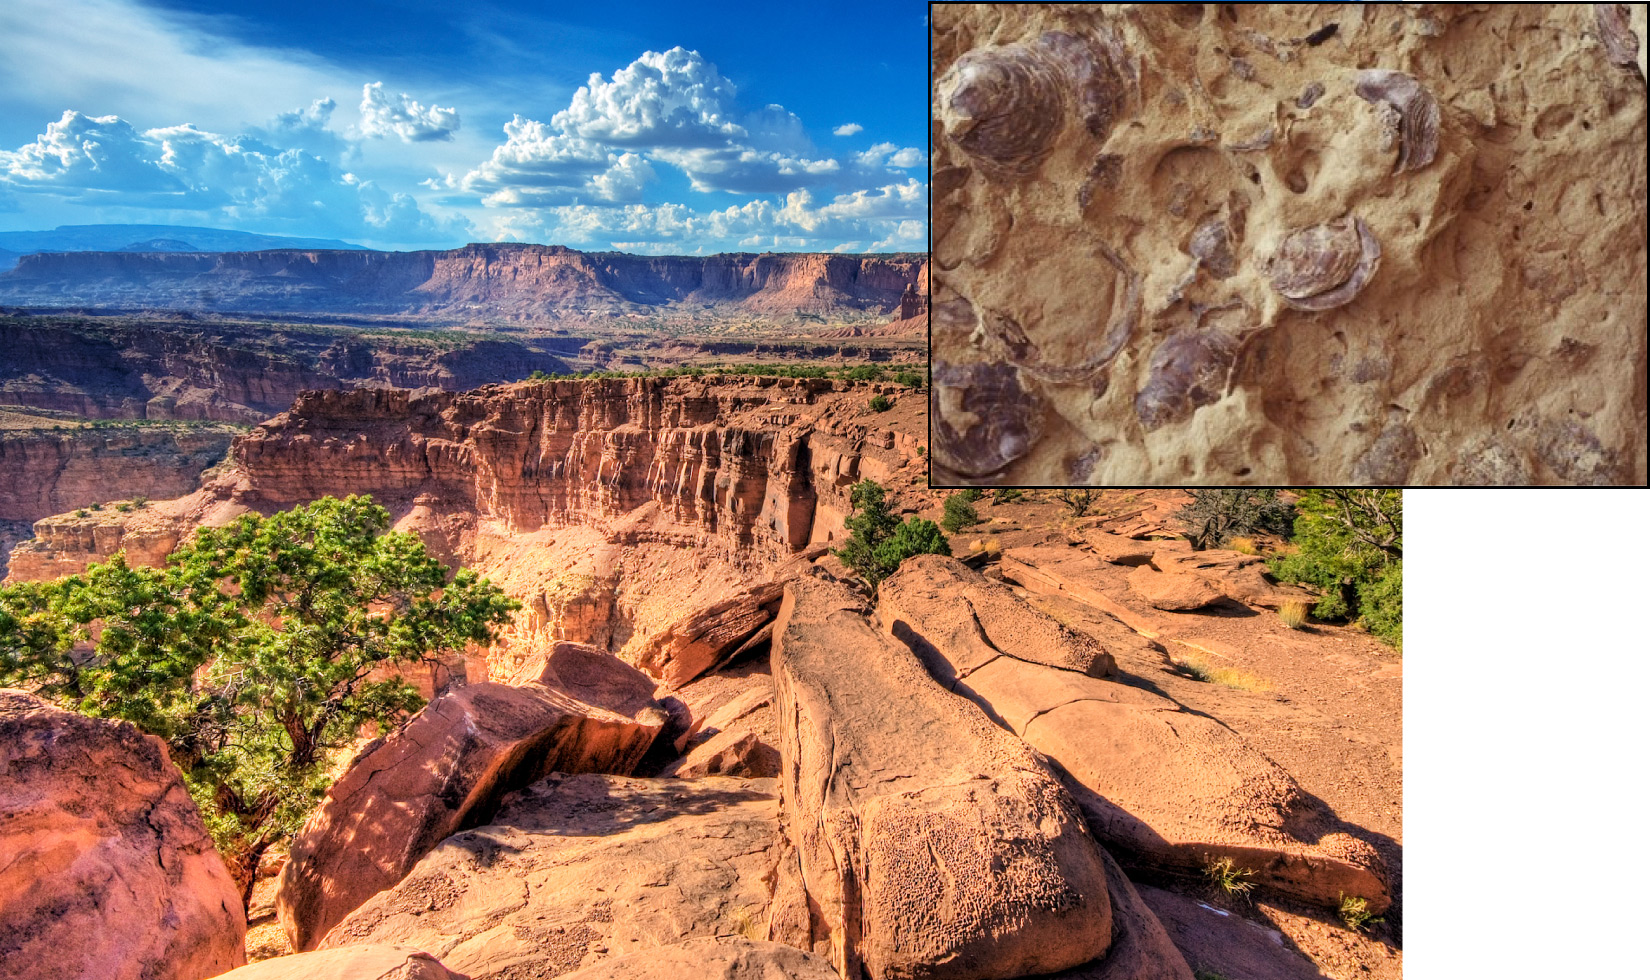
We’ve already discussed the fact that fossils of seashells have been found at high elevation in places like the Grand Canyon and Capitol Reef National Park (see Figure 5.2–1). In fact, seashells are found at high elevations and on mountain tops all over the world. Geologists have even collected fossils of sea animals from the top of Mt. Everest, the highest mountain in the world.
How can seashells end up on mountain tops? If you think about it, there are only two general possibilities, and only one of these makes sense for Earth:
- The first general possibility is that the mountains might have always been as they are, but the oceans were once much deeper, covering the mountain tops.
However, this possibility does not make sense for Earth, because there simply isn’t enough ocean water to have ever covered the highest mountains. - That leaves only one other possibility, which is that the mountains weren’t always mountains. Instead, their rock was once below sea level, and later was pushed up to high elevation.
Recall that we’ve already given this process a name: uplift , in which rocks are pushed upward from where they originally formed.
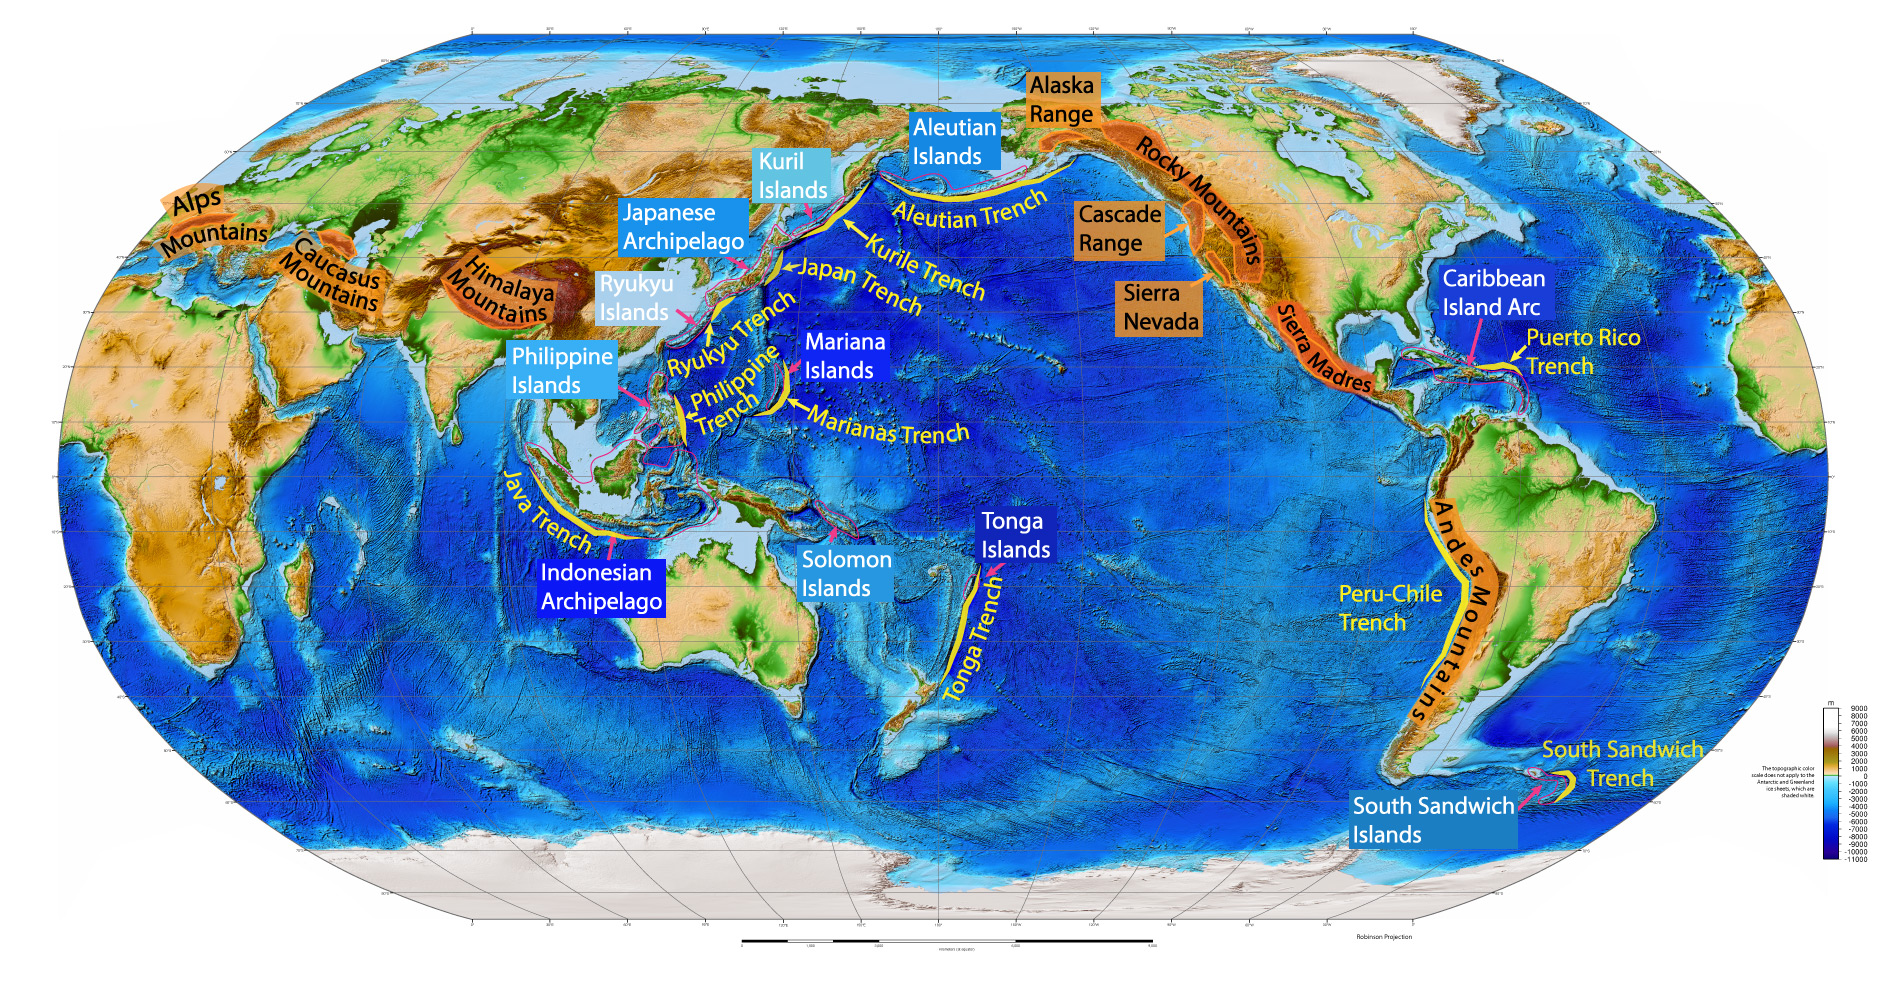
We conclude that mountains must be built over time through processes of uplift. But what causes the uplifting? We get another major clue from a fact that you saw in Figure 4.10 (repeated below): Mountains are not randomly scattered about, but instead are concentrated in mountain ranges, many of which are grouped together into two major mountain belts .
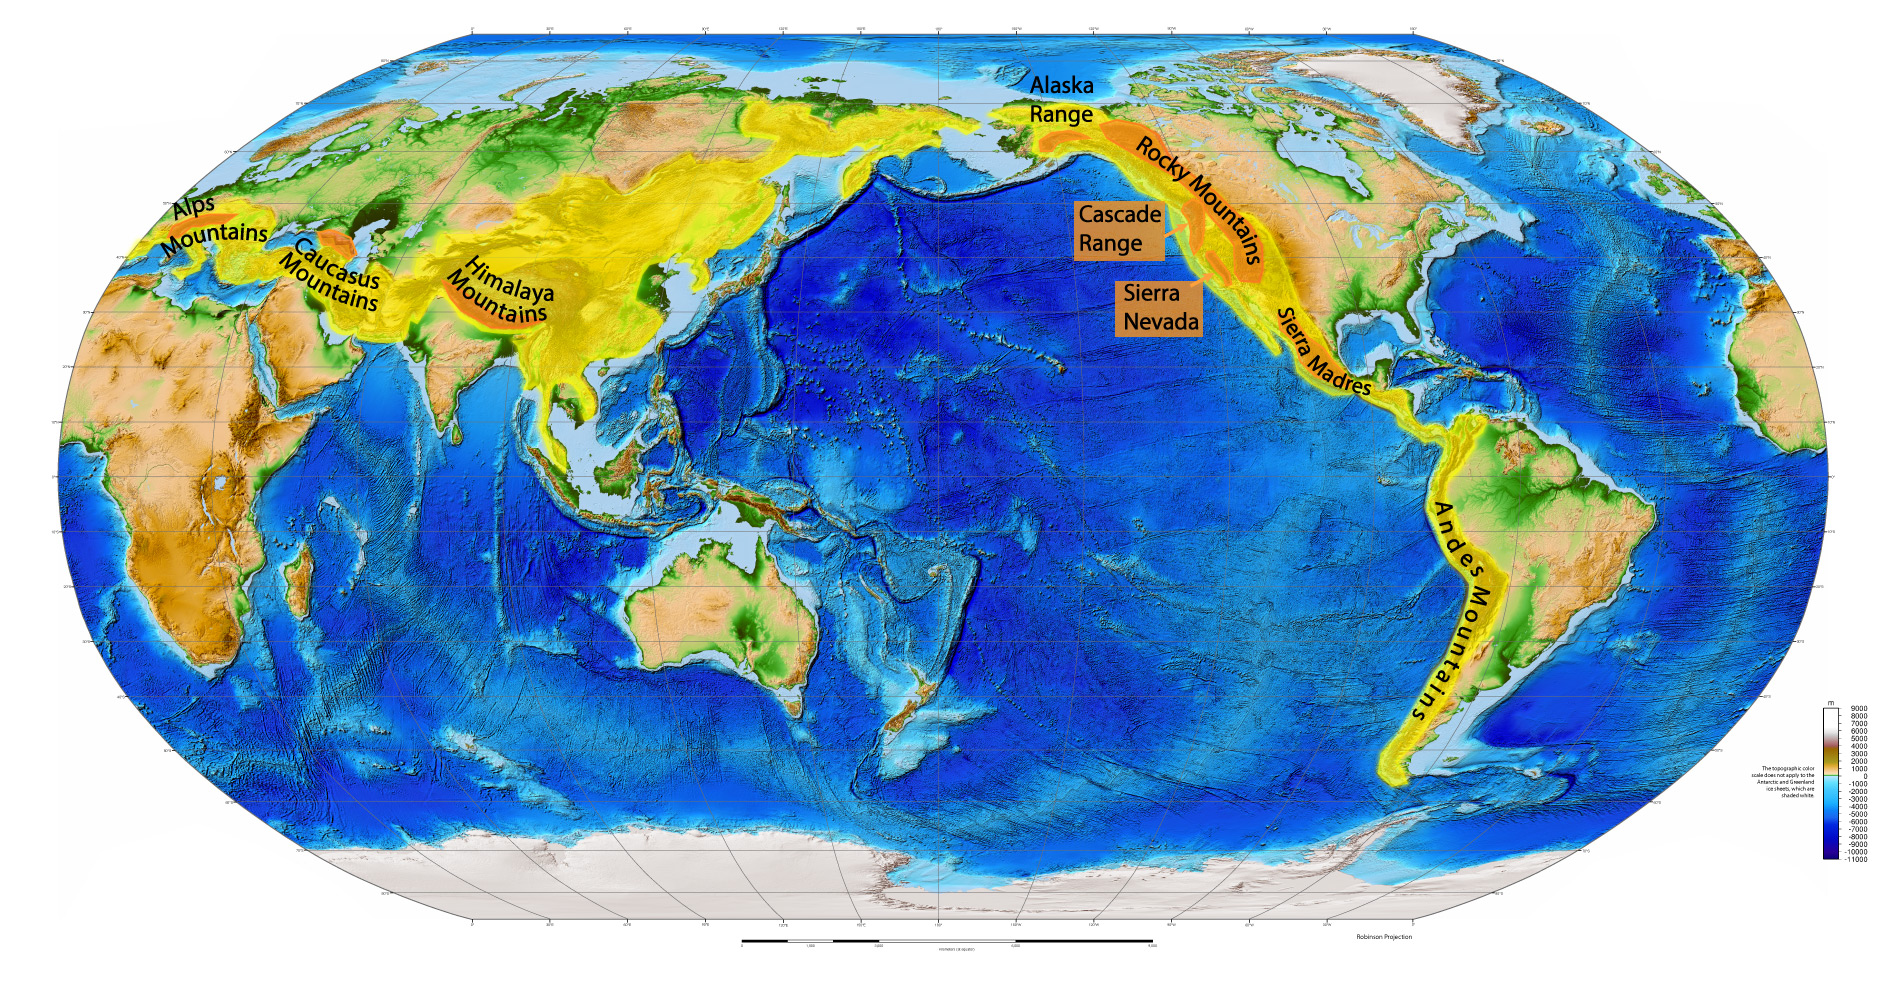
The clustering of mountains tells us that whatever builds them must act over very large scales on Earth, in order to affect such large regions all at once. Geologists have identified several ways in which mountain ranges can form. Two of the most important involve collisions of tectonic plates (Figure 5.2.2–3):
- When a plate consisting of seafloor subducts under a plate carrying a continent, it can force parts of the continent upward. This process usually also leads to melting of rock beneath the continent, which can create a chain of volcanoes along a mountain range.
Much of the mountain belt along the west coasts of North and South America formed in this way, and many of these mountains are active volcanoes. - When two continental plates collide, the collision can force rock upward in the collision zone.
Much of the Eurasian mountain belt formed in this way, including the Himalayas, which formed as the plate carrying India collided with the plate carrying the rest of Asia.
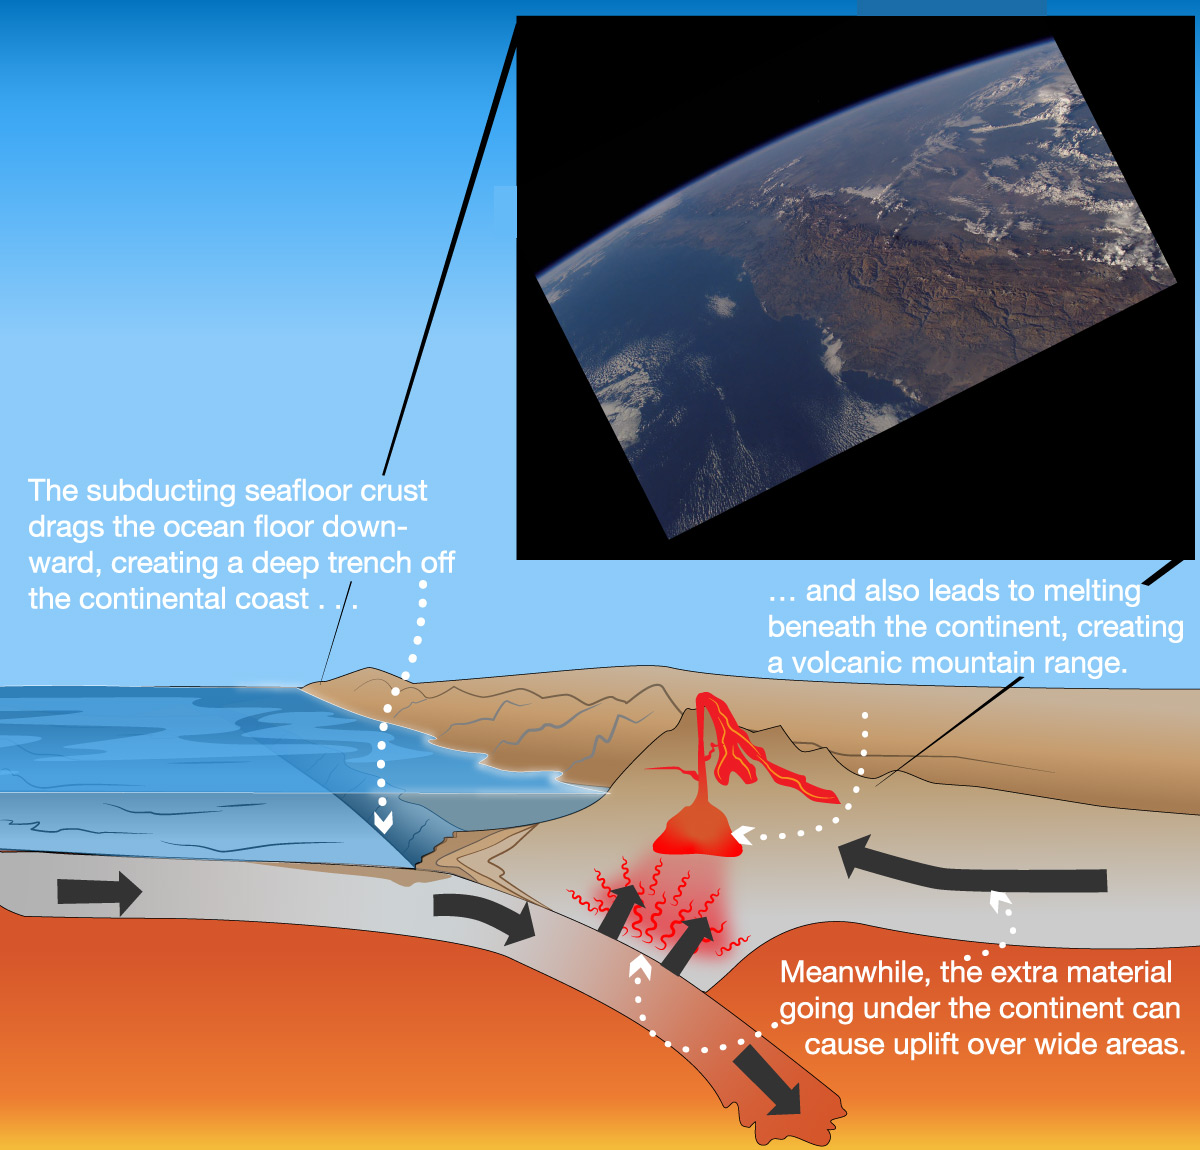
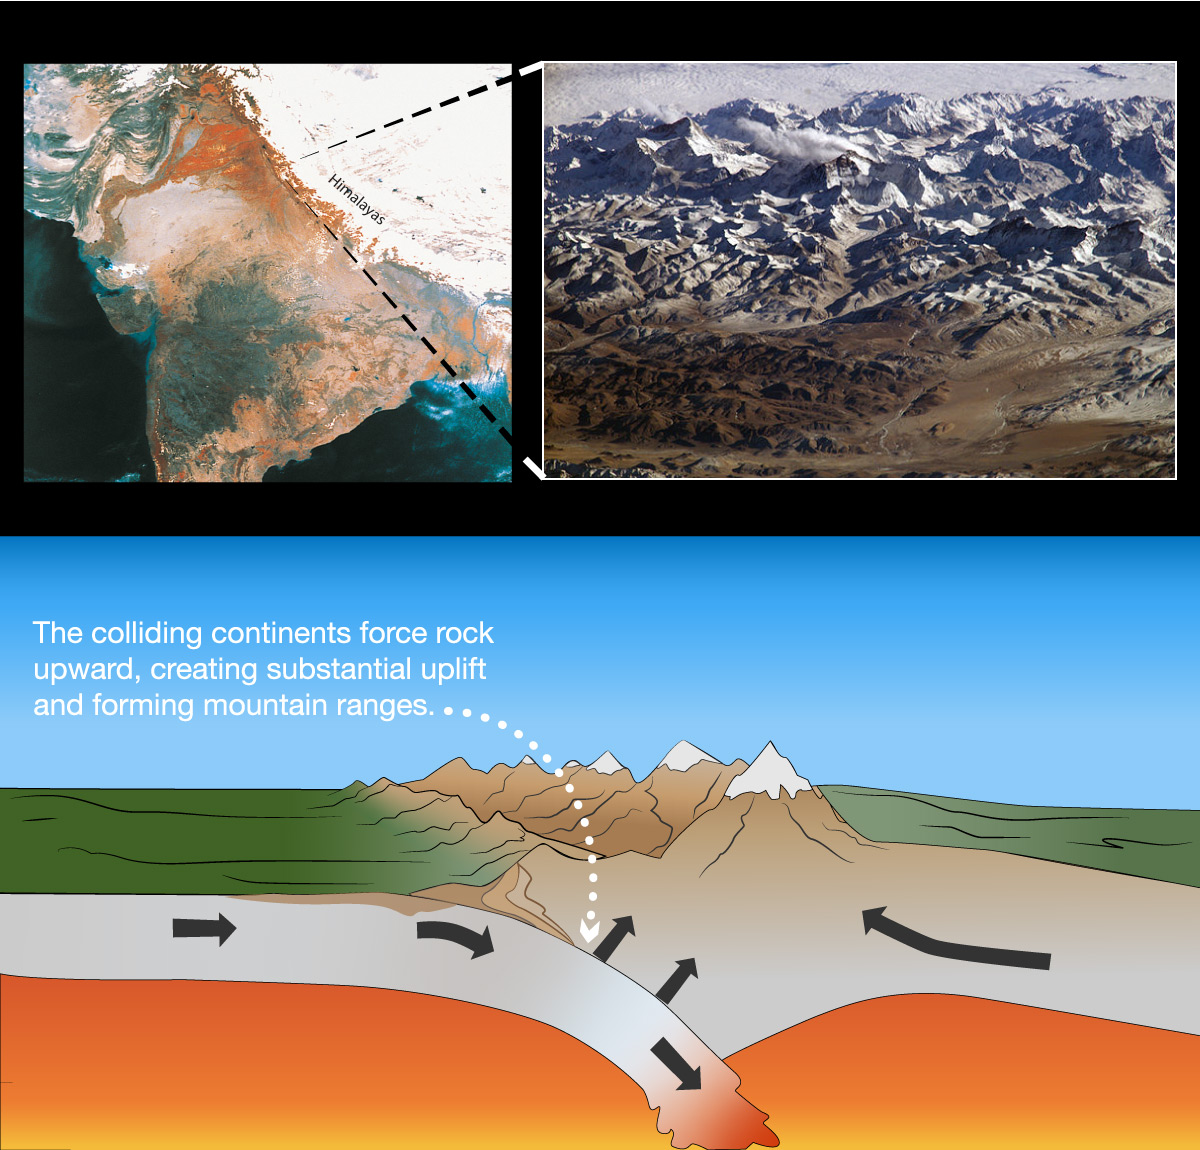
Figure 5.2.2–3 – These diagrams show two ways in which uplift can occur, forming mountain ranges and elevating nearby land on a continent. Credit: (illustration) Zofostro Science.
The uplift that occurs in these cases can not only build mountains, but it can also push up land in other regions of the continent. This is how the rock of the Grand Canyon and Capitol Reef ended up so high: These regions were once part of an inland sea (hence the fossil seashells) that was uplifted by processes like those shown in Figure 5.2.2–3.
Discussion
Trenches and Mountain Ranges
Discuss the following questions based on the processes illustrated in Figure 5.2.2–3a.
- Review Figure 4.11. Can you now explain the association of the Peru-Chile trench with the Andes mountain range?
- Would you expect to find active volcanoes in the Andes range? Explain.
- Look back at the plate boundaries shown in Figure 4.19, and find the Andes and the Himalayas on that map. What is happening along those plate boundaries?
This brief discussion will help prepare students for understanding the full implications of plate tectonics in Section 5.3, and also checks that students are correctly interpreting Figure 5.2.2–3. Notes:
- (1): The association is a very precise match to what is shown in Figure 5.2.2–3a. The Peru-Chile trench is the trench formed as the seafloor plate subducts under the South American continental plate, while the Andes are the mountains formed on the continent.
- (2) Yes, and there are indeed many active volcanoes in the Andes.
- (3) Students should use their geography skills to find the correct plate boundaries, then recognize from Figure 5.2.2–3 that the boundary near South America represents an ocean plate subducting under a continental plate (like Figure 5.2.2–3a), and the Himalayas represents the collision of two continental plates (like Figure 5.2.2–3b).
Weathering and Erosion
A second major way in which the continents have been shaped is through weathering and erosion . Recall that these are the names we give to processes that can break down rock and move the broken-down material to new locations.
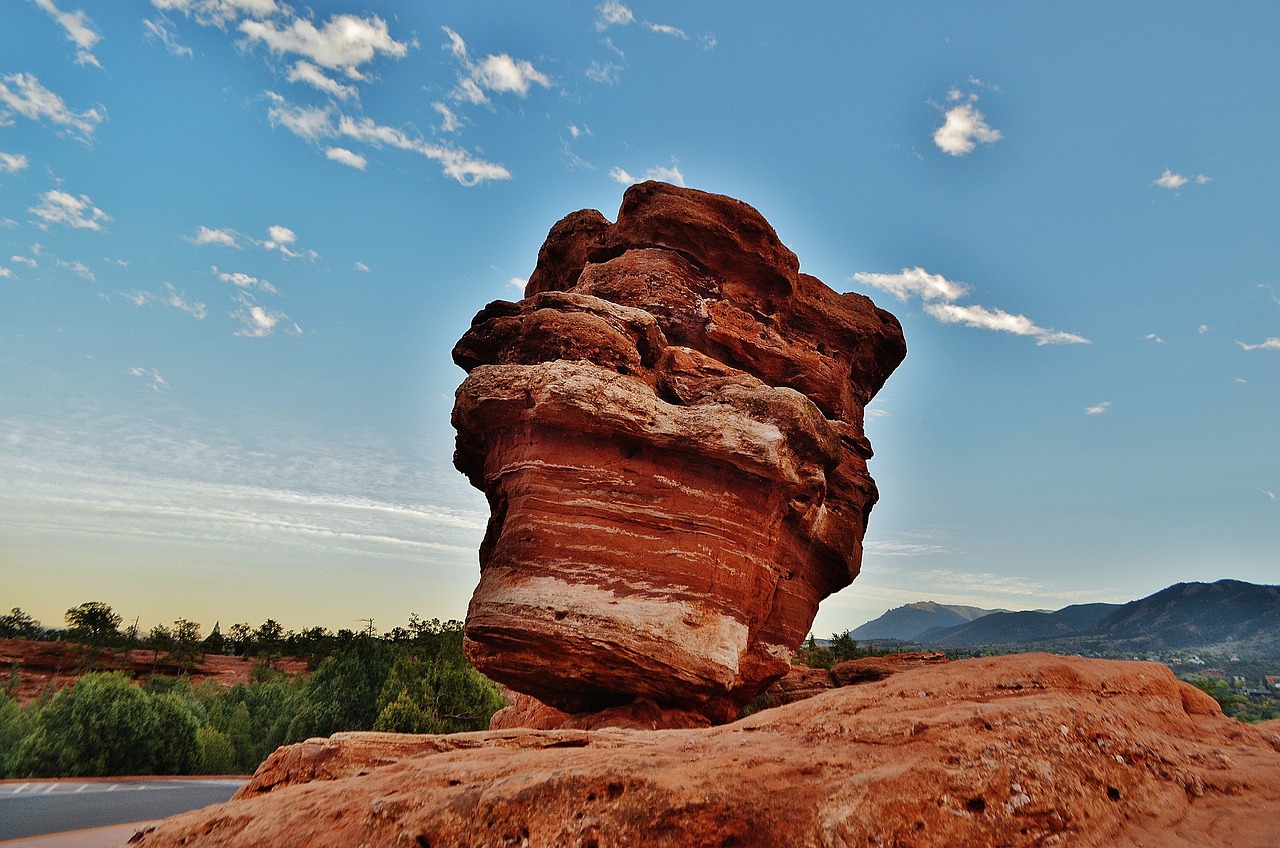
Many different processes can cause weathering and erosion. Some of these processes tend to break rock into smaller pieces. For example, because water expands when it freezes into ice, water that seeps into cracks in a rock can cause the rock to crack when it freezes. Similarly, tree roots can crack rocks as they grow. Other processes act on rock chemically . Rusting is a familiar example, in which iron combines with oxygen to make rust. The red colors of many rock formations are actually due to rusting of the iron in the rock (Figure 5.2.2–4).
Activity
Weathering by Freezing
Find a plastic bottle that you no longer need. Fill it completely with water, seal it tightly, and place it in the freezer. What happens to it after the water freezes? Explain how your observations relate to weathering of rock caused by cycles of freezing and thawing of water.
This is a simple activity in which students will see how water expands when frozen. They should be able to relate the cracking of the plastic bottle to the cracking of rock when water that has seeped into the rock freezes.
We can often see weathering and erosion occurring on small scales. Indeed, if you look around your home, school, or neighborhood, you can almost certainly find examples of weathering and erosion in action.
Activity
Agents of Weathering and Erosion
Weathering and erosion are happening all around us, all the time. How many ways can you think of in which these processes occur? Do the following to help you think about this question. Hint: Remember that weathering and erosion affects not only the natural landscape, but also human-built structures including sidewalks, roads, and buildings. Think about all of these as you consider the processes that can cause them to wear down.
- Working in small groups, make a list of at least 3 processes that can cause weathering or erosion of rock.
- For each of the processes you have identified, decide whether it is: (a) a process that you can see in action locally; (b) a process that occurs locally but that is not currently occurring; (c) a process that occurs locally but happens too slowly for you to notice in a short time; or (d) a process that occurs in other parts of the world but not locally. Explain your choice.
- For each of the processes you have identified, either take a photo (if it is something you can see locally) or find a photo that shows its effects. Write a caption for each photo that explains what you are seeing.
- Come together as a class and consolidate the lists and photos from each group. Discuss whether you think that the combined list is fairly complete, or if you can now think of other weathering and erosion processes that are missing from the class list.
The primary goal of this activity is for students to recognize the many ways in which weathering and erosion can occur. Notes:
- As we’ve noted previously, it is not important at this level to distinguish carefully between weathering and erosion here, which is why we use the terms together. (To review the technical distinction: weathering refers only to the breakdown processes, while erosion also includes the transport of material.)
- Your local climate will probably affect what processes students think of. For example, if you live in a cold climate, cycles of freezing and thawing will be fairly obvious. If you live in windy region, wind action may be what students think of first. At the end of the activity when you come together as a class, you might wish to discuss the impact of local climate on weathering and erosion.
- Be sure to have students think about weathering caused by plants and trees, which should be fairly easy to see. For example, almost anywhere you’ll be able to find pavement that has been cracked by tree roots.
- Another connection you may wish to make is with acids and acid rain, which are agents of chemical weathering.
- If you’d like for your students to have a chance to play with some erosion models/experiments, there are numerous activities you can find online. Here is one set from a group at the University of California, Berkeley, that you might find worthwhile: https://undsci.berkeley.edu/lessons/weathering_erosion.html. Although it is aimed at slightly younger students, 8th graders will probably still have fun with it.
Weathering and erosion affect the landscapes we see in many different ways. Three of the most important are through soil production, the carving of landscapes by water, and in “battling” against the forces of mountain building and uplift. Let’s briefly discuss each.
Soil Production
Weathering and erosion are critical to producing the soil that promotes plant growth and agriculture (Figure 5.2.2–5). “Good” soil, meaning soil that can support a lot of plant growth, contains many mineral nutrients, all of which ultimately got into the soil as a result of weathering and erosion. Of course, erosion can also carry good soil away, which can lead to failures of agriculture that can have enormous human impacts.
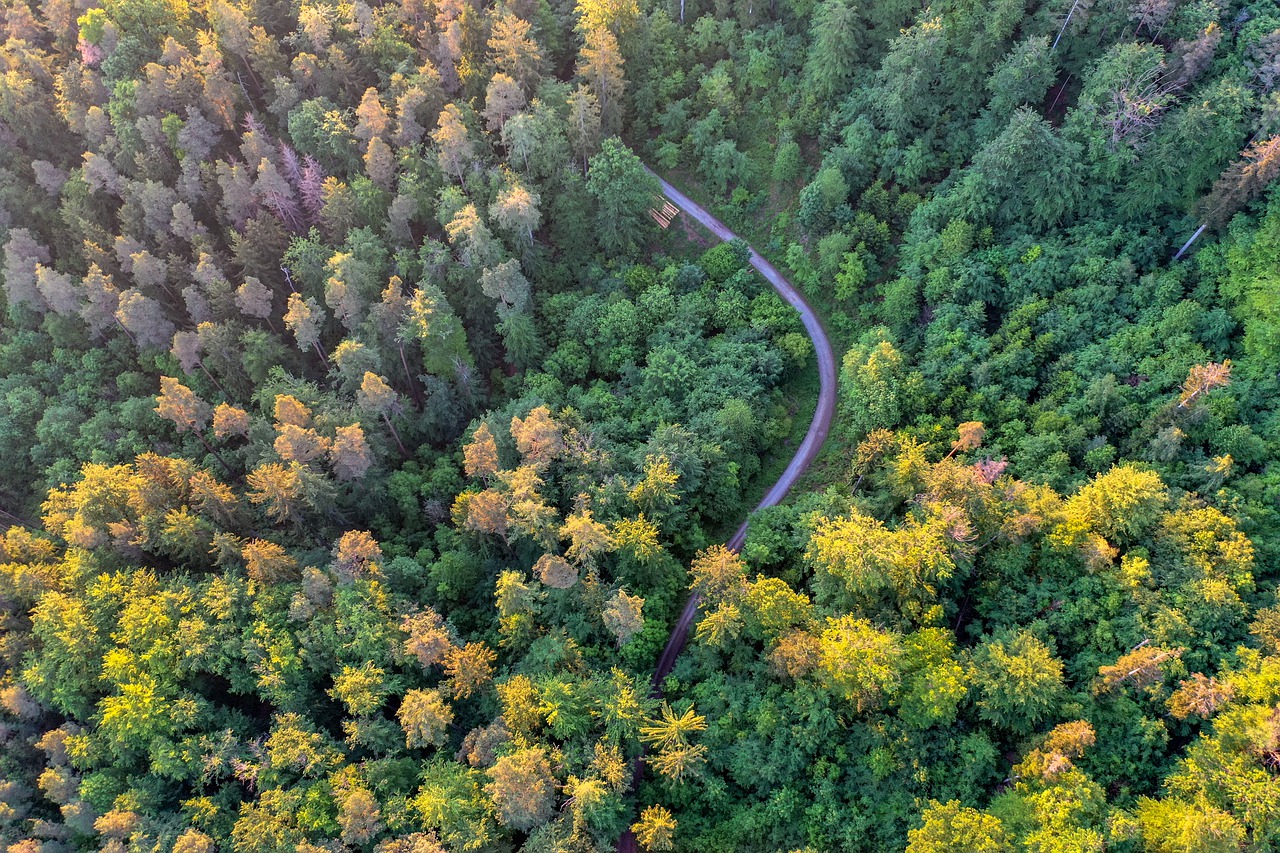
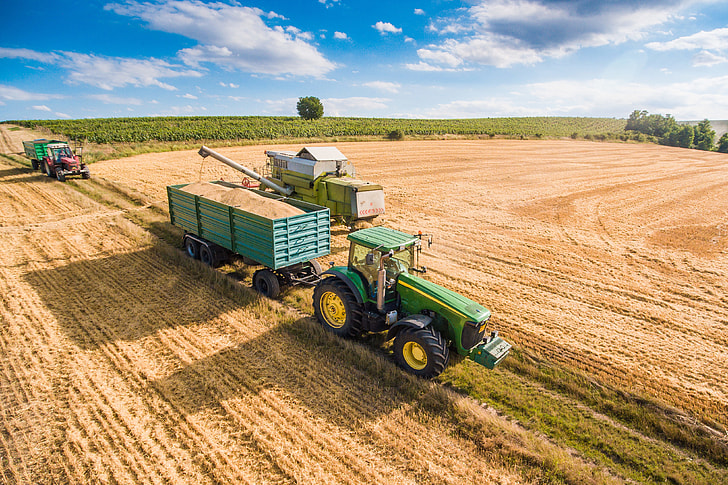
Figure 5.2.2–5 – Weathering and erosion play a critical role in the production of the soil in which plants can grow.
Erosion-Carved Landscapes
Acting over thousands and millions of years, weathering and erosion can dramatically reshape landscapes. As you already know, the Grand Canyon was carved out over the past few million years by the Colorado River and subsequent erosion of the canyon walls exposed by the river. Indeed, many of the world’s most spectacular landscapes have been sculpted by the ongoing action of weathering and erosion (Slide show 5.2.2–6.) (Glaciers — which of course are frozen water — can also carve landscapes, but we’ll consider them separately below.)
 Slide 1 - This aerial photo shows a portion of the Grand Canyon, carved largely by water erosion from the flow of the Colorado River. You can see the river running through the middle of the canyon. Credit: Steven Severingha.


Slide Show 5.2.2–6 – Take a quick tour of a few spectacular landscapes carved by weathering and erosion.
Weathering/Erosion vs. Mountain Building and Uplift
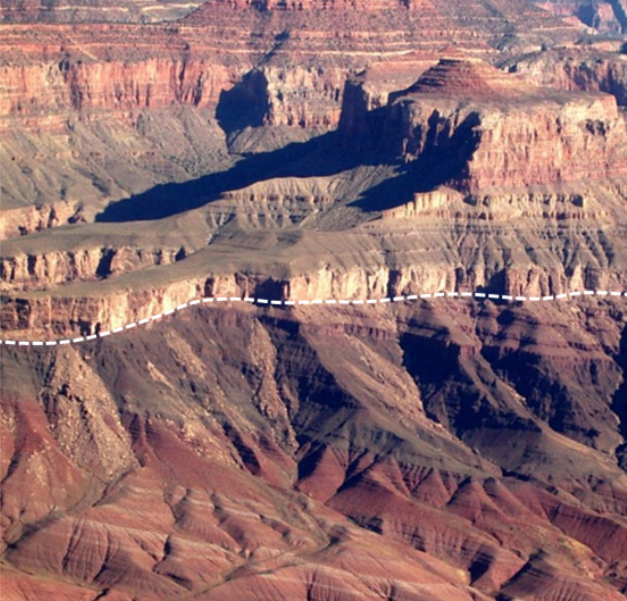
Over many millions of years, weathering and erosion are in a constant “battle” with the forces of mountain building and uplift. We’ve discussed some of these effects already. Recall, for example, that the Grand Canyon’s “great unconformity” (see Figure 5.1.3–5) marks a place where millions of years’ worth of rock is “missing” from the canyon walls, almost certainly because it was eroded away.
This “missing” rock would have been quite thick — probably many hundreds of meters — if it had not been eroded away, which means the entire landscape around the Grand Canyon would be at an even higher elevation if not for the erosion that has occurred. In other words, the uplift that raised the Grand Canyon high above sea level has been partially countered by the forces of weathering and erosion.
Weathering and erosion are also constantly grinding away at mountain ranges. The peaks of the Himalayas, for example, are being slowly eroded away, yet these mountains overall are still rising because continued uplift is occurring slightly faster than the down-cutting action of erosion. In other places, weathering and erosion are winning out. This is the case with North America’s Rocky Mountains (Figure 5.2.2–7), which are thought to have once been more than 2 kilometers taller than they are today. They’ve been cut down to their current size by millions of years of weathering and erosion.
Journal Entry
Weathering/Erosion and Me
Think briefly about how your own life — and that of your family — has been affected by weathering and erosion. Be sure to consider all three of: (1) geological effects that may have created the landscape around you; (2) effects on sidewalks, roads, and buildings that you use; and (3) the role that weathering and erosion play in agriculture and soil, and how that affects your daily life. After you spend a few minutes thinking about these effects, write a paragraph or two about how your own life has been affected by the geological forces of weathering and erosion.
The goal with this journal entry is for students to draw a connection between a seemingly abstract idea of geology and our daily lives. Since it is a journal entry, students can of course choose to emphasize any connection they wish. However, you may wish to encourage them to think in particular about the impact of weathering and erosion on soil creation and destruction, since that connects directly the food we consume every day.
Ice Ages and Glacial Action
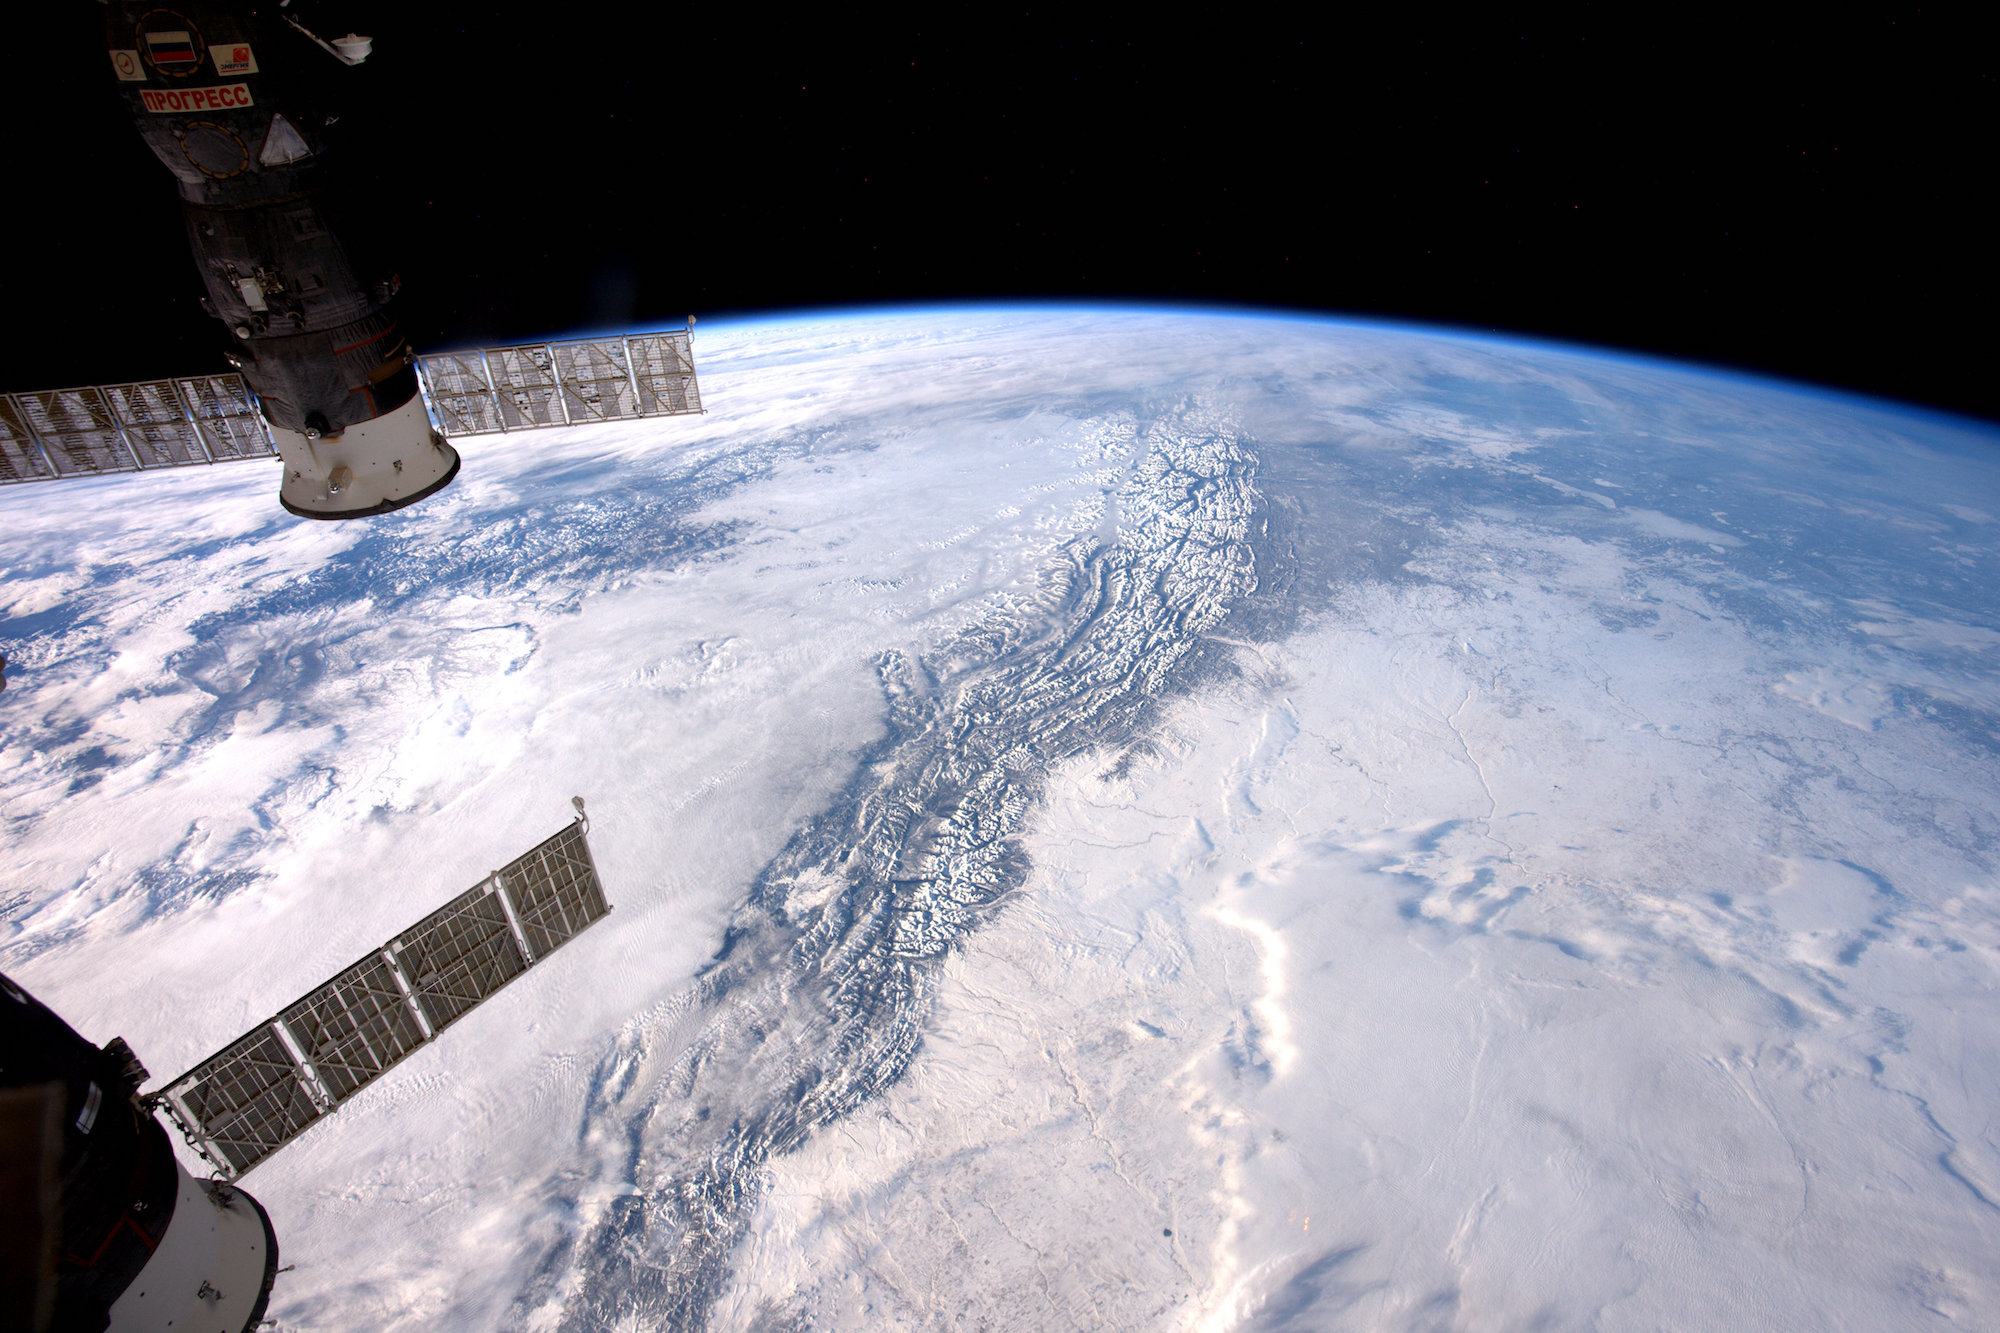
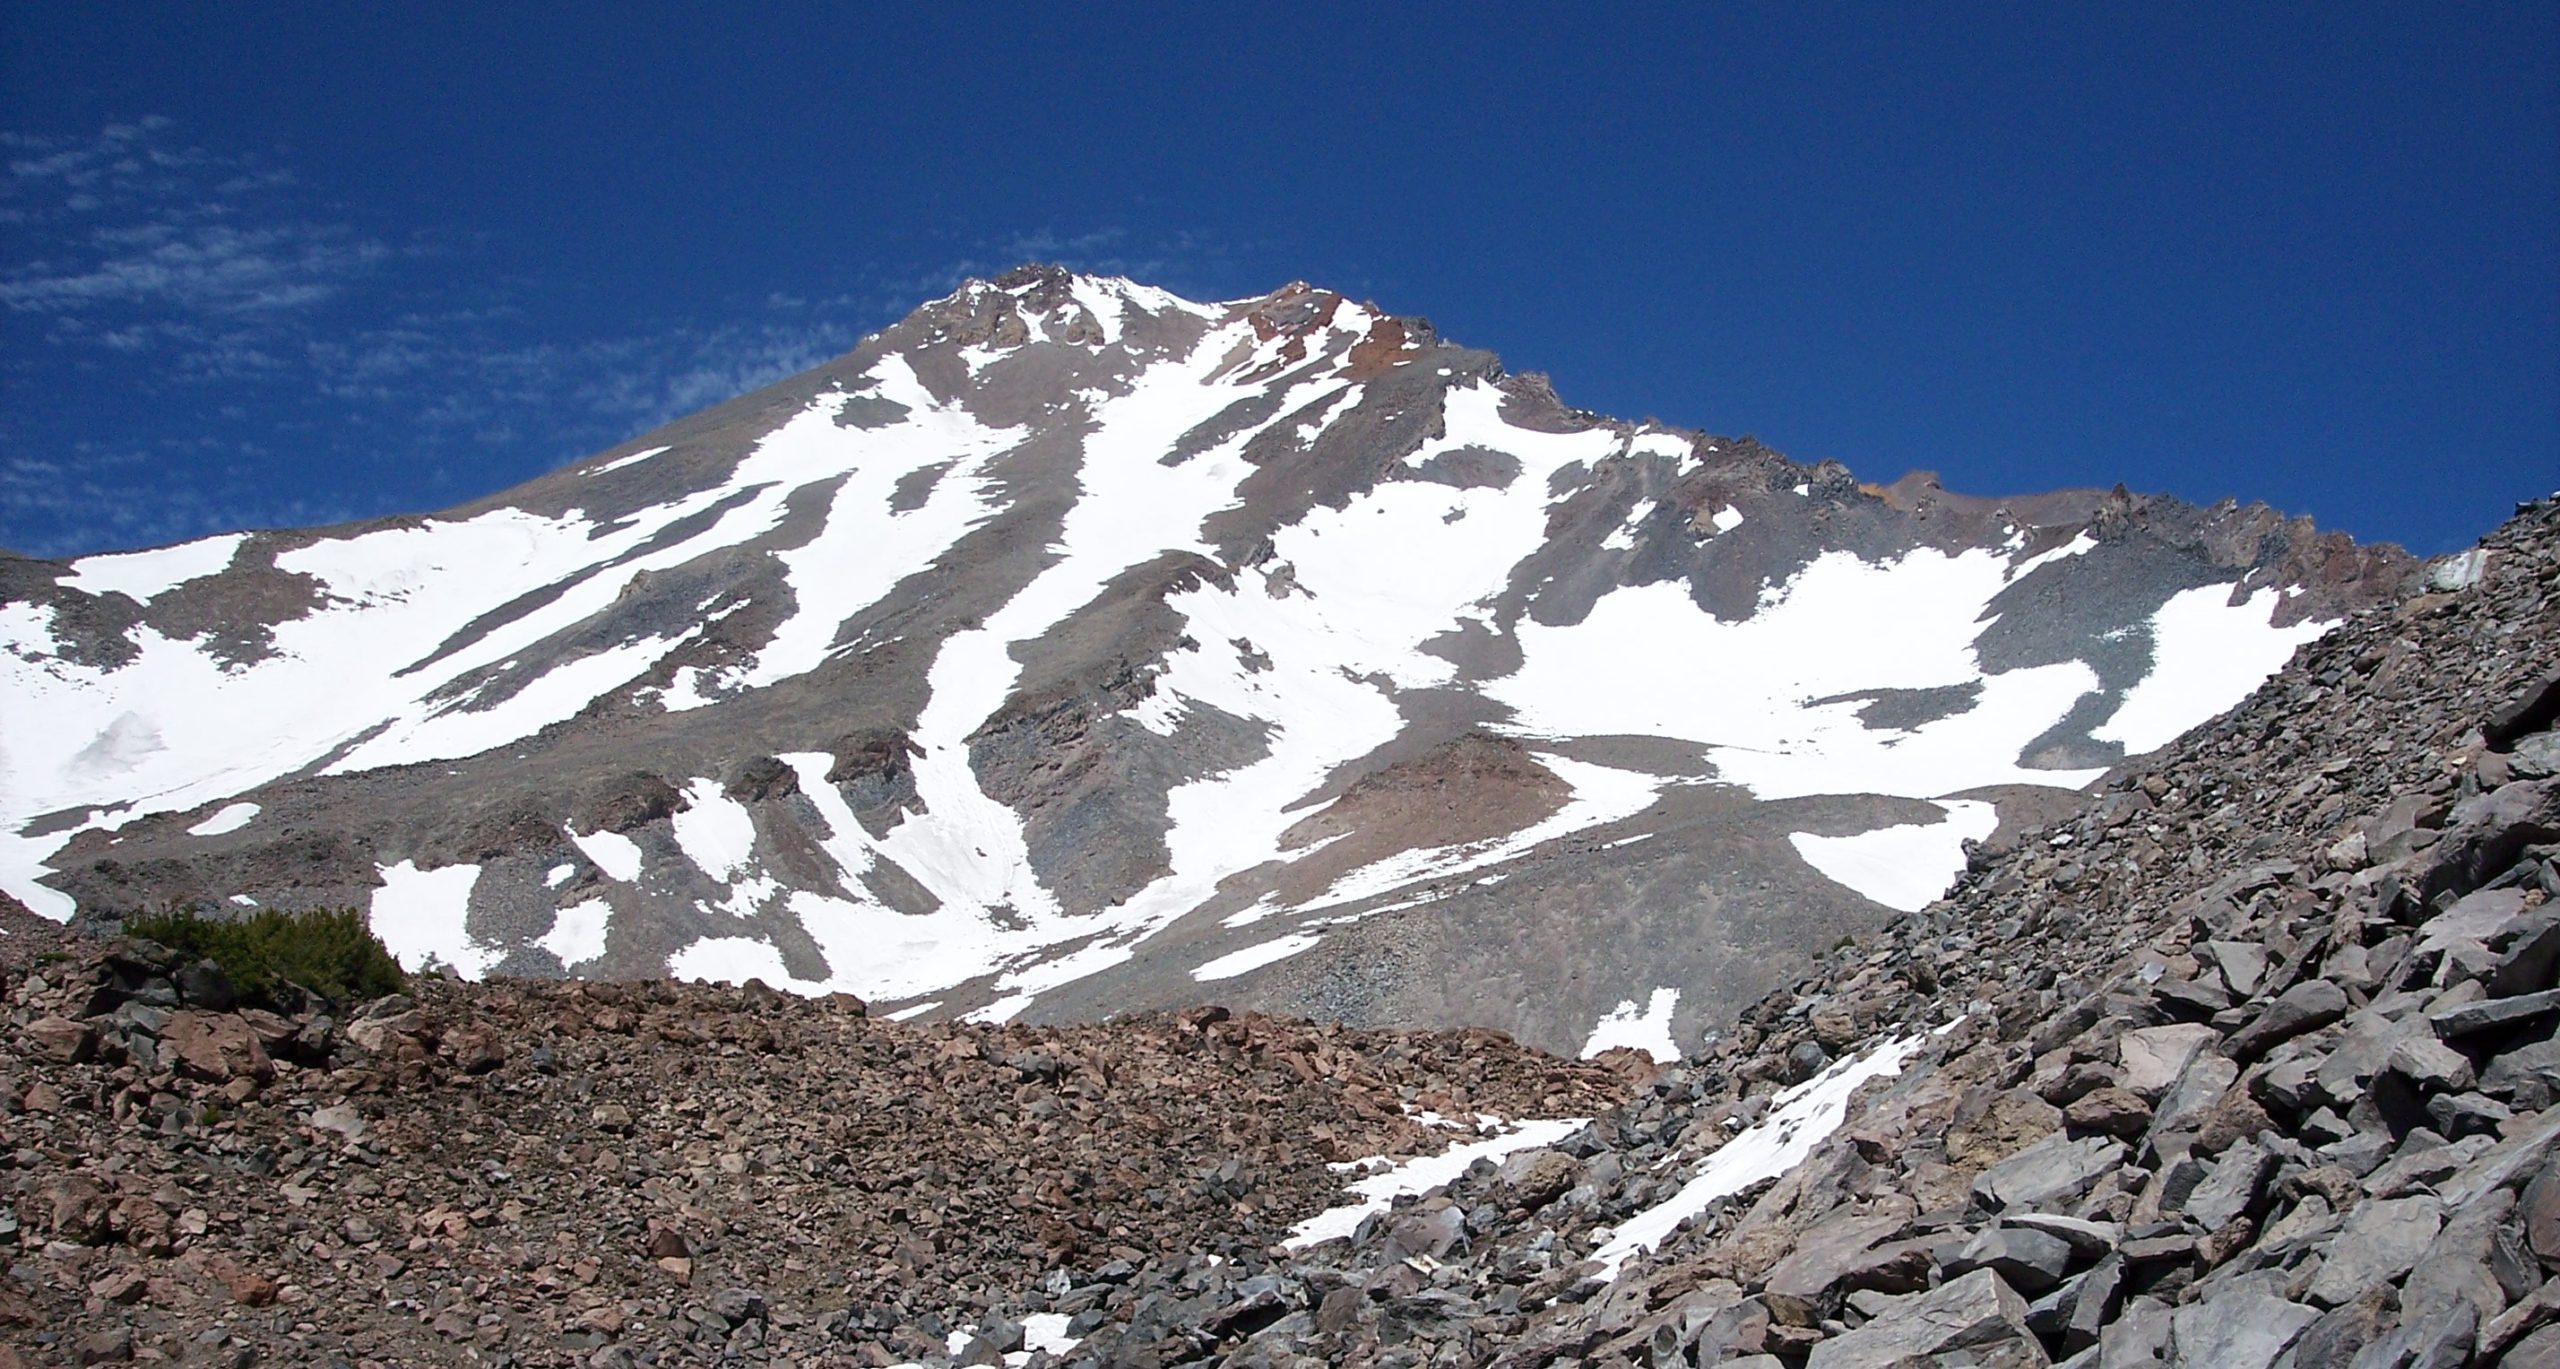
Most of us don’t see glaciers on a regular basis. Today, almost all of Earth’s glacial ice is in Antarctica and Greenland. At most latitudes, you can see a glacier only if you go hiking high in the mountains (Figure 5.2.2–8). Nevertheless, glaciers have been a powerful force in shaping the landscapes of the continents as we see them today.
Glaciers may look like they are “just sitting there,” but careful observations show that they can flow much like a river, but much more slowly. This was first proven by an experiment carried out on Switzerland’s Rhone Glacier starting in 1874. People living in the area had long known that the edges of glaciers could advance or recede, but there was debate about whether the ice itself could flow. In 1874, the Swiss established a “Glacier Commission” to answer the question. They placed a series of stakes in a horizontal line across the glacier, then observed how their positions changed over the next decade (and more). Figure 5.2.2–9 illustrates the results. The movement of the stakes provided clear proof that the ice itself was in motion.
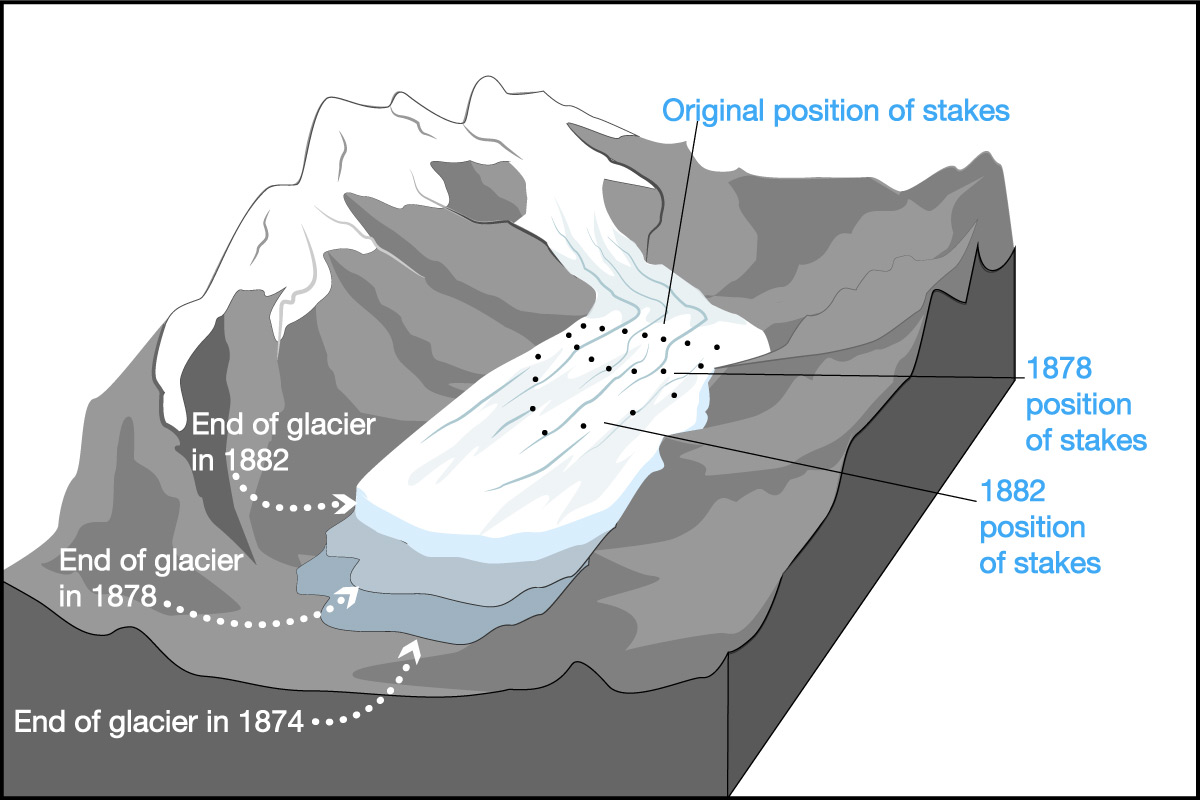
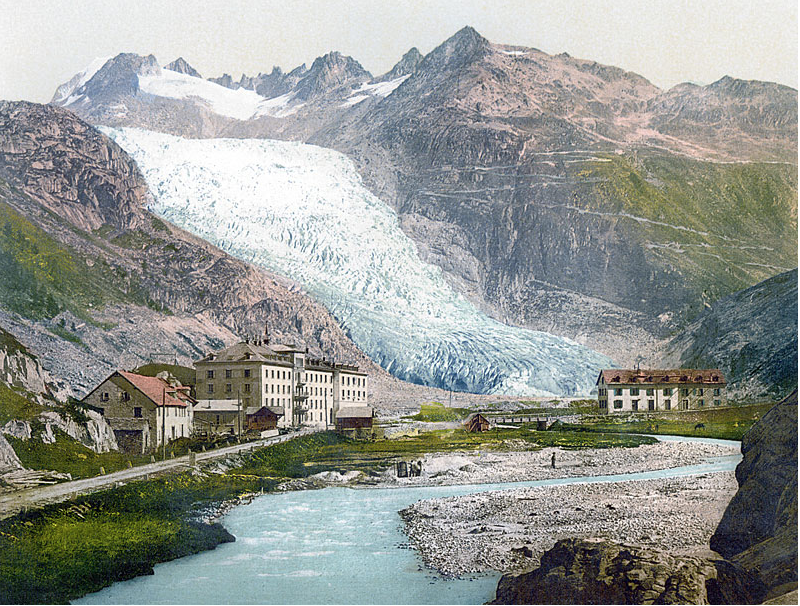
Figure 5.2.2–9 – This diagram shows the movement of stakes planted in Switzerland’s Rhone Glacier from 1874 to 1882. The photo is a postcard from around 1900, showing what the glacier looked like at that time. Photo Credit: Glaciers Online (swisseduc.ch).
Discussion
Glacial Flow
Discuss the following questions as you study Figure 5.2.2–9.
- Does the entire glacier flow at the same rate, or do some regions flow faster than others? Explain how you know.
- Is the entire glacier moving downhill, or is ice flowing within the glacier? Explain how you know.
- Look back at our brief discussion in Chapter 3 about how solid rock can flow. How is glacial flow similar to the flow of solid rock? What role does gravity play in the glacial flow?
- Form a hypothesis about why the sides of the glacier flow slower than the center.
Use these discussion questions to help students consider the implications of the experiment shown in Figure 5.2.2–9. Answers:
- (1) The stakes in the center of the glacier are clearly moving faster than those near the sides, proving that different parts of the glacier flow at different rates.
- (2) Ice is flowing within the glacier. If the entire glacier were moving downhill, then the advancing edge would need to keep advancing. Instead, we see that the edge actually retreated from 1874 to 1882, which means the entire glacier did not shift downhill.
- (3) Ice is a solid, so the glacial flow is the flow of solid material, just like that of solid rock but at much lower temperature. Gravity causes this glacial flow, just as gravity makes rivers flow downhill.
- (4) There are at least two factors in the different rates of flow: (1) along the sides of the glacier, the ice is essentially “caught” on the rock, slowing its flow; (2) the glacier is deeper in the middle than at the sides, and the added pressure allows the solid ice to deform and flow more easily.
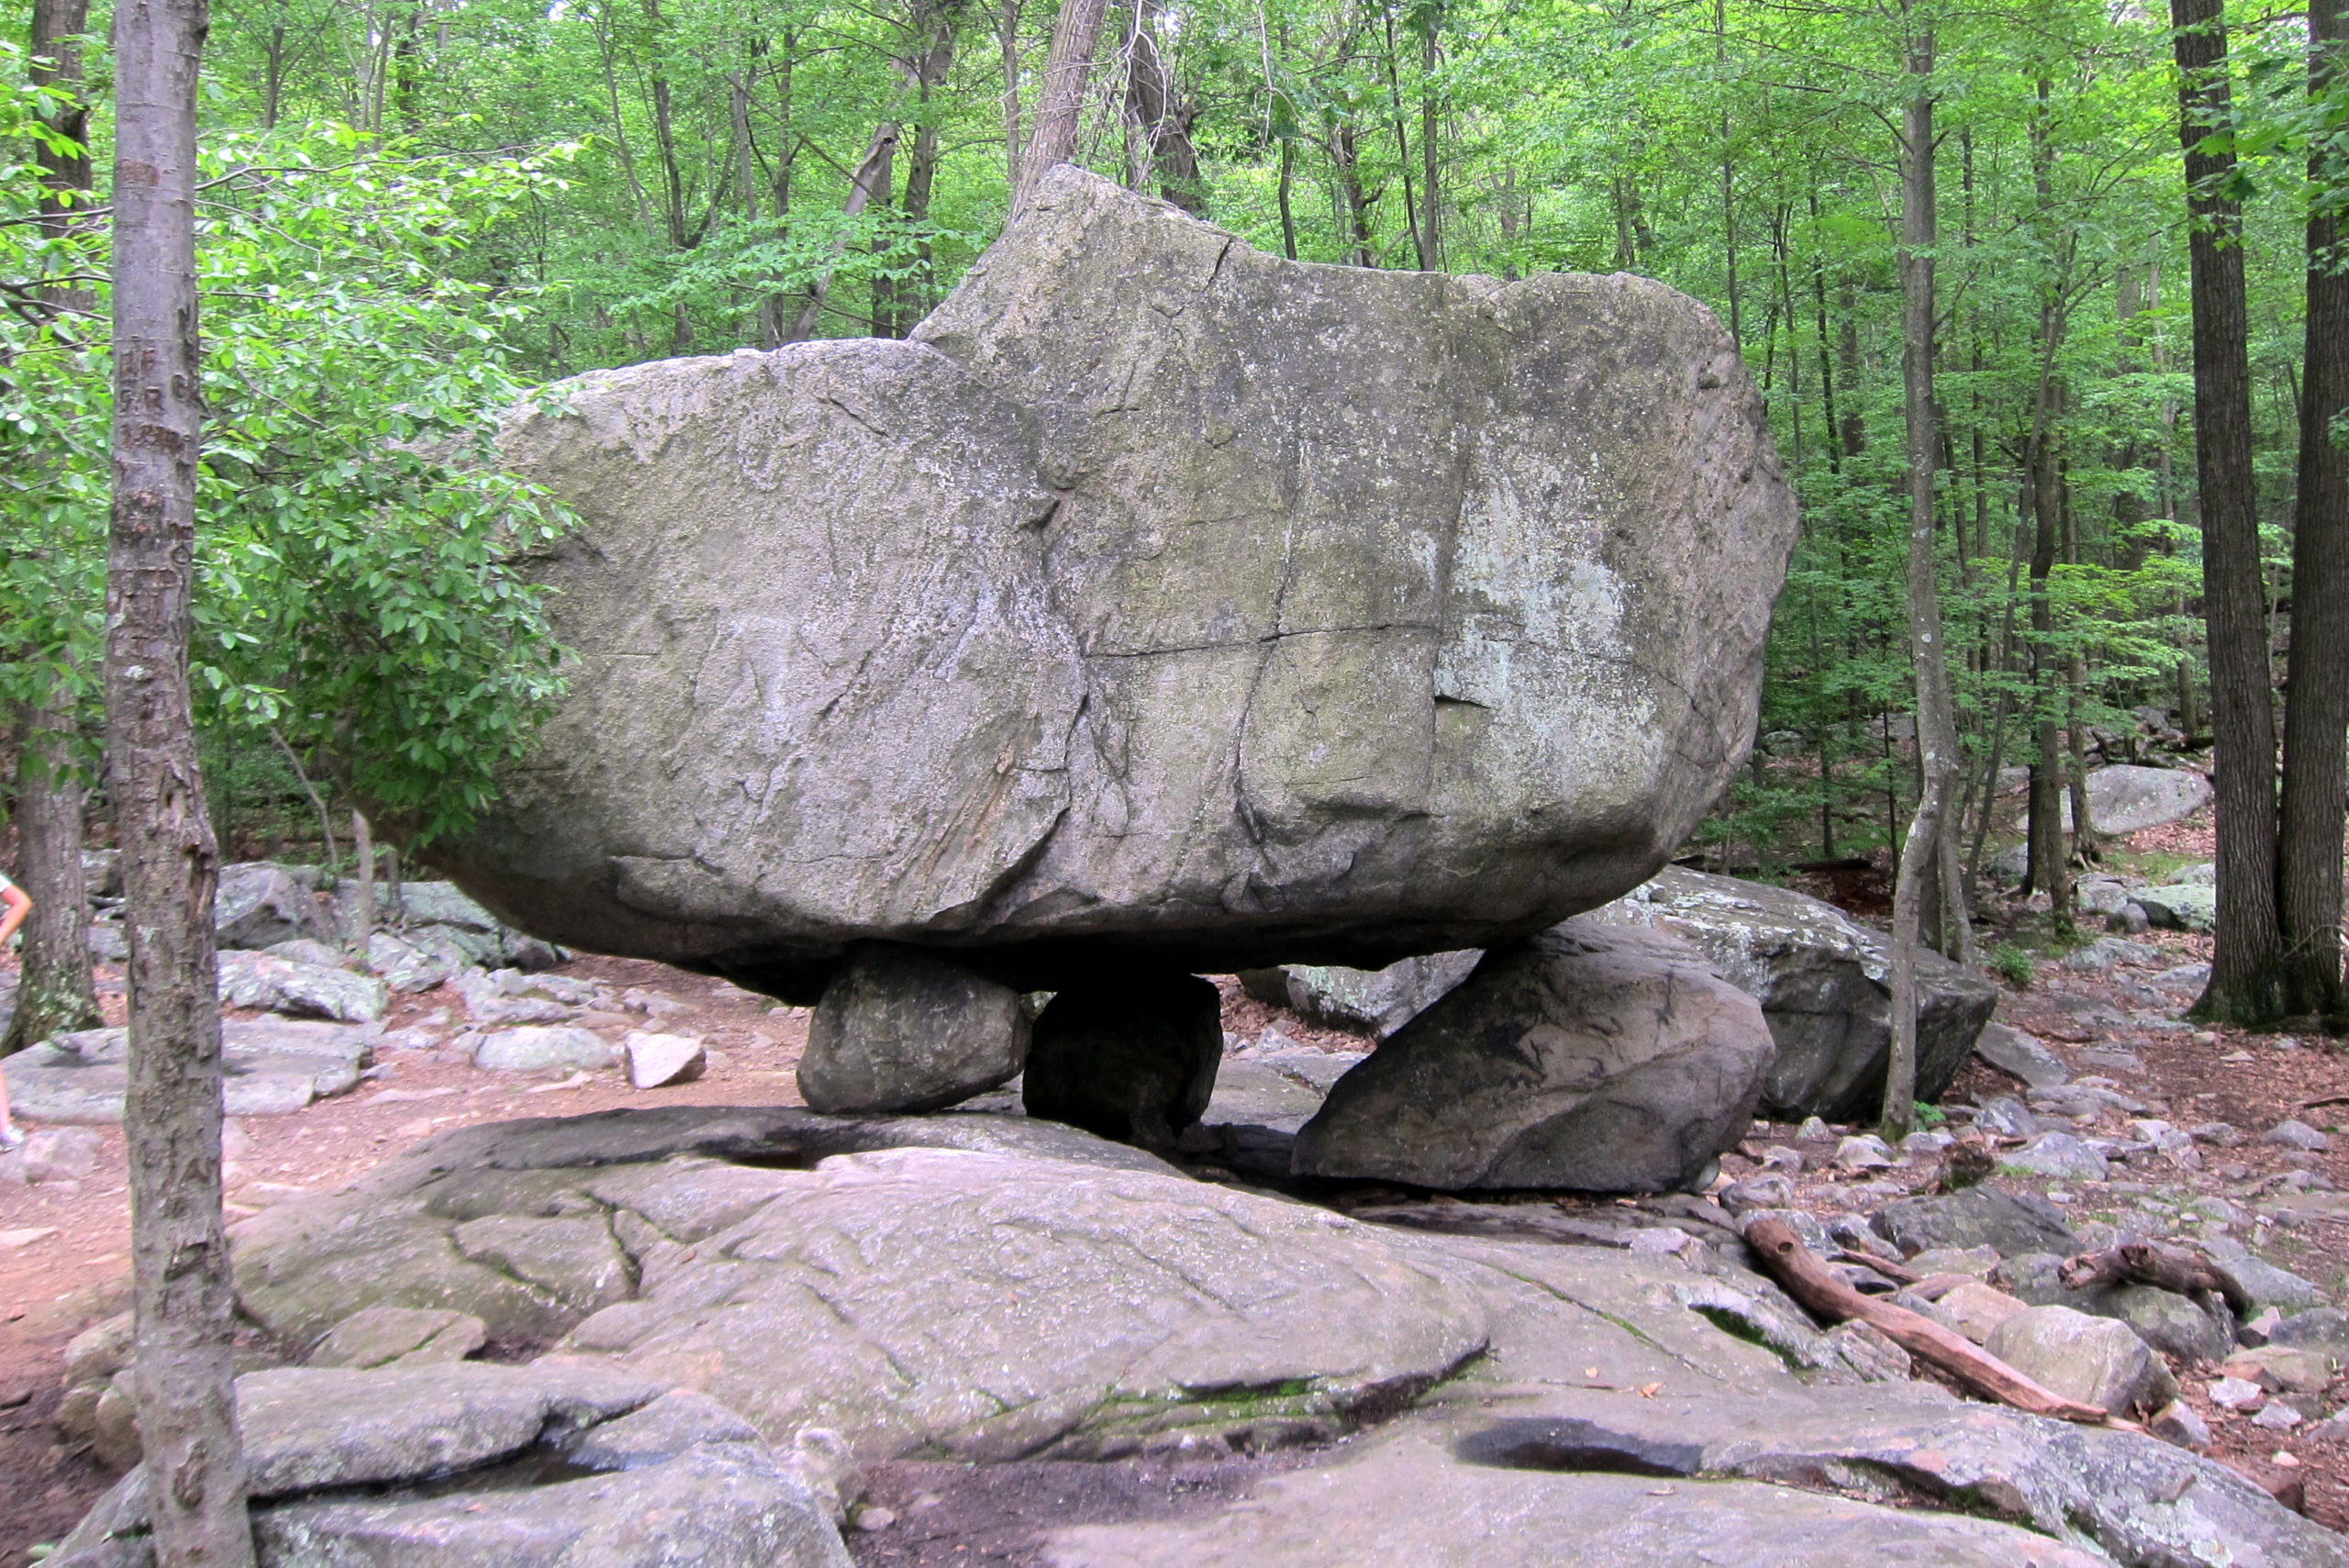
Once scientists recognized that glaciers could flow, they also began to notice many pieces of evidence pointing to the fact that glaciers were once much more common than they are today (or than in the late 1800s, when this work was first being done). One key line of evidence comes from huge boulders that have apparently been moved hundreds of kilometers (Figure 5.2.2–10). It must have taken tremendous power to move such large rocks, and geologists realized that glaciers had the necessary power.
Glaciers can move smaller rocks as well as huge boulders, and by looking for rocks that have been moved by glaciers, scientists of the late 1800s came to realize that much of North America and Europe had once been completely covered by ice. This is how scientists first discovered that there have been ice ages in Earth’s past. Today, we know that Earth has been cycling in and out of ice ages for the past 2 million years, and that there were also many other ice ages in Earth’s more distant past. We’ll discuss why ice ages occur in Chapter 7; here, we’ll focus on the tremendous impact that the ice ages have had in shaping the continents.
Figure 5.2.2–11 shows the vast extent of the ice sheets during the peak of the most recent ice age. Much of this ice sheet was an astonishing 3 to 4 kilometers thick — more than about six times as high as New York’s One World Trade Center. This glacial ice affected the continents in three major ways: through erosion, through its sheer weight, and through its effects on sea level. We’ll discuss each briefly.
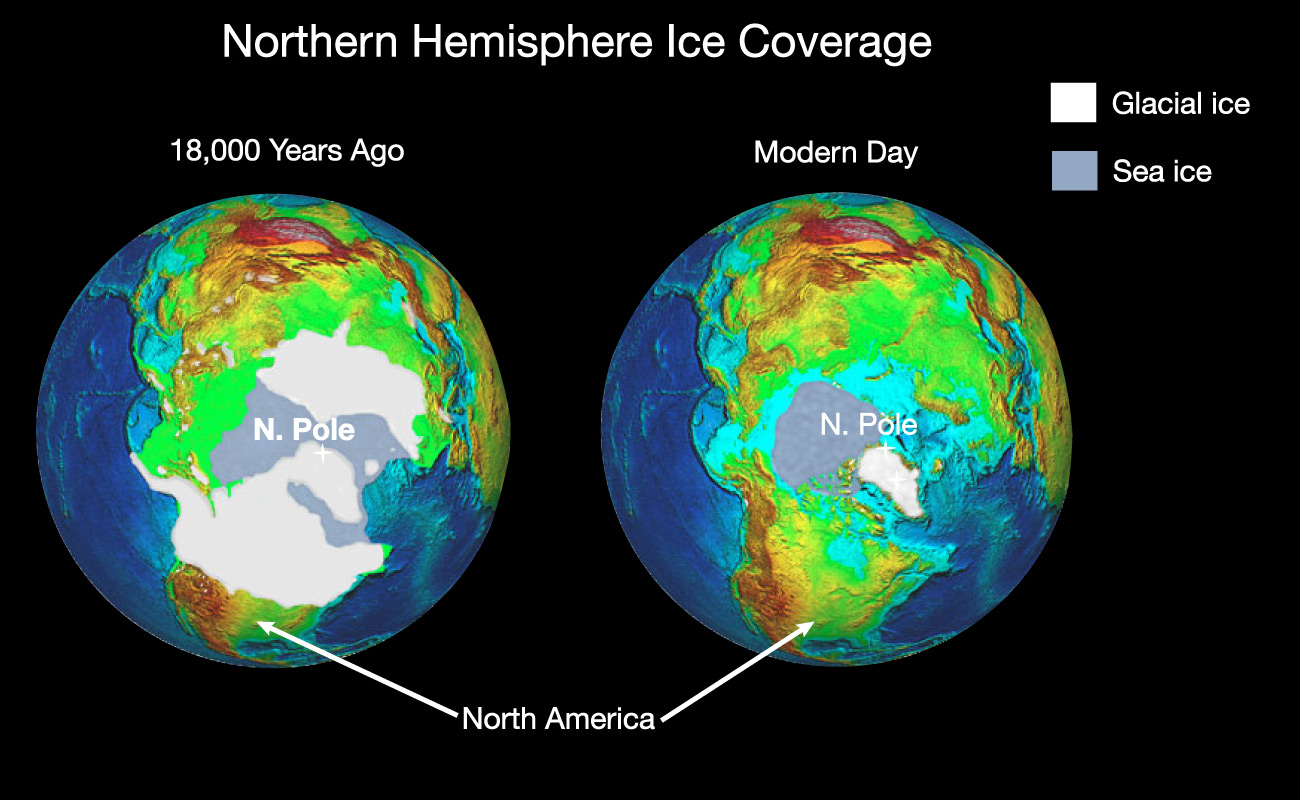
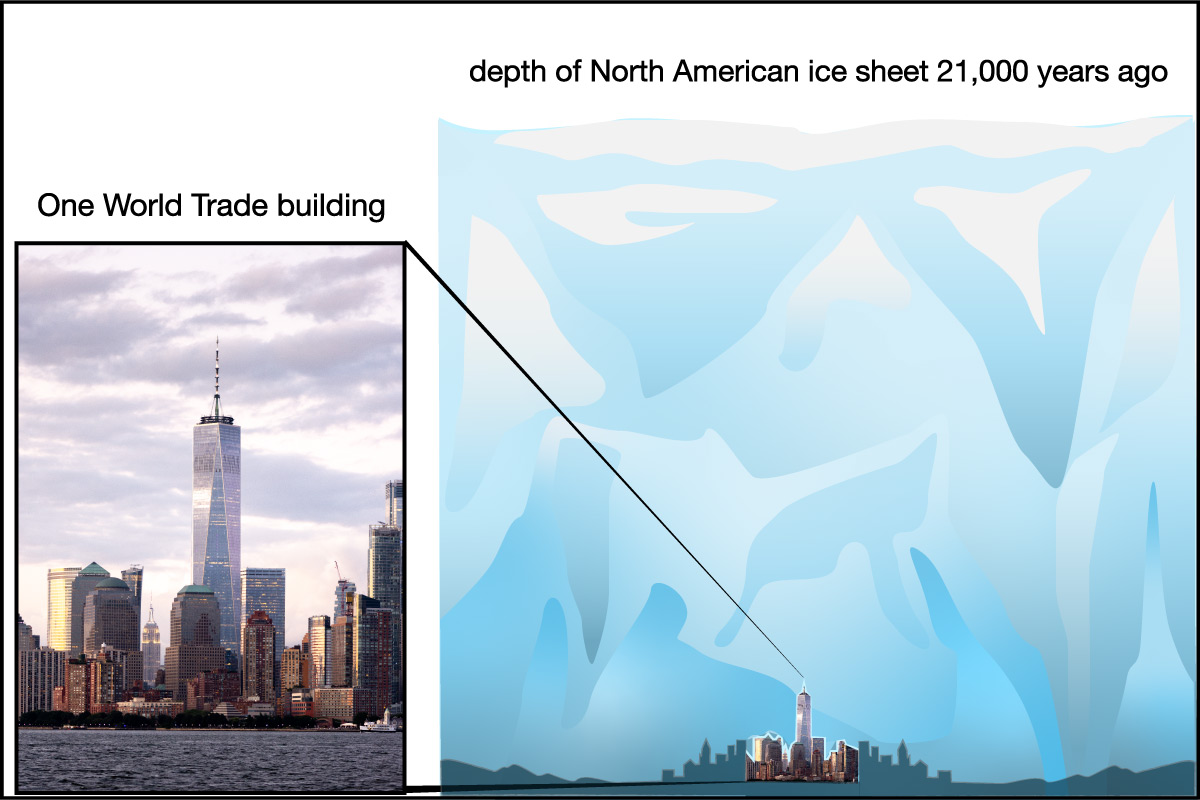
Figure 5.2.2–11 – Large portions of North American and Europe were buried under a thick ice sheet during recent ice ages.
Discussion
Ice Age Glacial Thickness
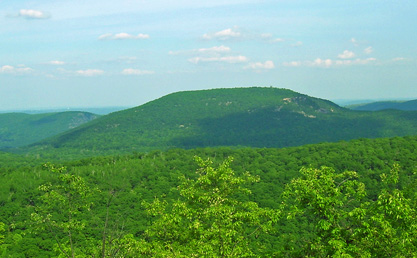
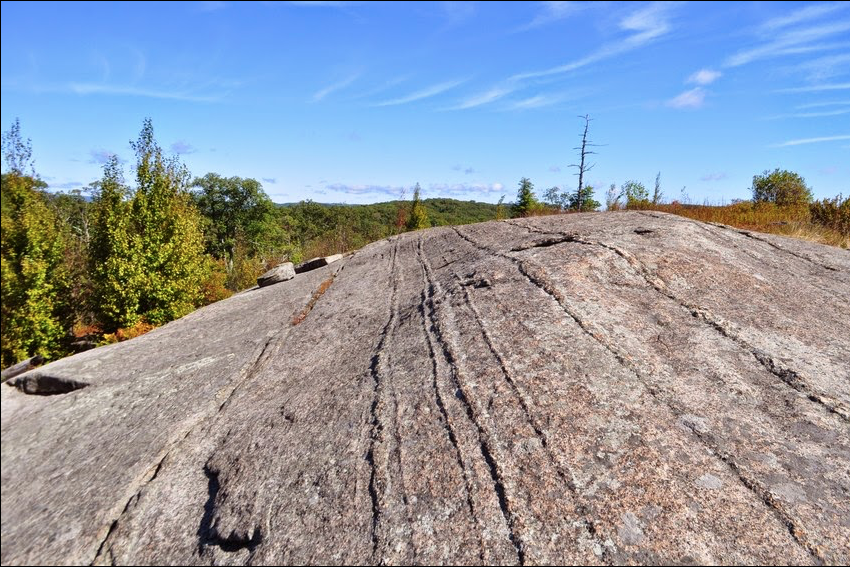
One key piece of evidence that tells scientists the thickness of the ice sheet during the last ice age comes from study of rocks on the top of mountains such as New York’s Bear Mountain. These rocks show clear evidence of having been deeply buried under ice; for example, many of these rocks have grooves that were gouged in them as the glacier carried small rocks across their faces. This tells geologists that the ice sheet was thick enough to rise high over these mountains. But you also know that mountains can be built up over time. How do you think scientists know that the ice covered the mountains after the mountains formed, rather than having the mountains rise up after the ice retreated? Discuss your ideas. Hint: think about the time scales involved.
This discussion requires students to think about geological time scales. The key ideas that you should help them recognize:
- In general, the time scale for mountain building is millions of years. The only exception is with active volcanoes, but since these mountains are not volcanic, we expect the mountains to be millions of years old. Note that scientists can verify this in other ways, using dating techniques.
- As Figure 5.2.2–11 shows, the ice sheets were in these locations only 18,000 years ago.
- So the time scales indicate that the mountains would not have grown during the time since the ice sheets retreated. Therefore, we can use the current height of the mountains to tell us how thick the ice sheets must have been.
Glacial Erosion
Scientists studying landscapes where glaciers once were (or still are) find abundant evidence of their power to cause erosion. A flowing glacier can essentially scrape off rock along its bottom and sides. In places where glaciers are oriented downhill (such as in Figure 5.2.2–9), the glacier will carve out a valley with a relatively flat bottom, sometimes called a “U-shaped” valley because of its resemblance to the letter U . Glaciers can also cut away rock that results in leaving behind sharp peaks (called “horns”) and jagged ridges, which explains why we see such features in many mountain ranges.
The advance and retreat of glaciers with the ice ages has also altered the landscape of flatter ground. We’ve already seen how glaciers have transported huge boulders. In addition, they’ve deposited rock that has built up hills, and created depressions that later fill with water to make lakes. The Great Lakes of North America were created by glaciers, as were most of the many thousands of smaller lakes found in the northern United States and in Canada.
Slide show 5.2.2–12 shows examples of landscapes sculpted by glacial erosion.
 Slide 1 - The famous sharp peaks of the Alps, including the Matterhorn (shown here), were once more rounded. The sharp peaks formed as glaciers scraped away surrounding rock. Credit: Buaidh.


Slide Show 5.2.2–12 – Take a quick tour of a few spectacular landscapes carved glacial erosion.
Glacial Weight Effects
Have you ever picked up a large block of ice? If so, you’ll know that it can be pretty heavy. Now, imagine what the weight of a gigantic ice sheet must be like. In fact, an ice sheet about 3 kilometers thick — similar to that at the peak of the last ice age — would press down on every square meter of land with a weight close to 3,000 tons. That’s like having a stack of 3,000 pickup trucks over every piece of land covered by the ice sheet. If you combine that with the area of the ice sheet, you’ll find that, during the last ice age, the total weight of the ice sheet over North America must have been close to 70 quadrillion (70,000,000,000,000,000) tons.
The enormous weight of this ice sheet pressed the crust beneath it down into the mantle (Figure 5.2.2–13a), lowering the surface elevation by as much as several hundred meters. This forced the underlying mantle rock to gradually move out of the way, which in turn caused uplift of the crust in other places. Later, as the ice sheet retreated, the land that had been pressed down by the ice sheet began to rise back upward , and land that had been pushed upward away from the ice sheet began to sink back down (Figure 5.2.2–13b).
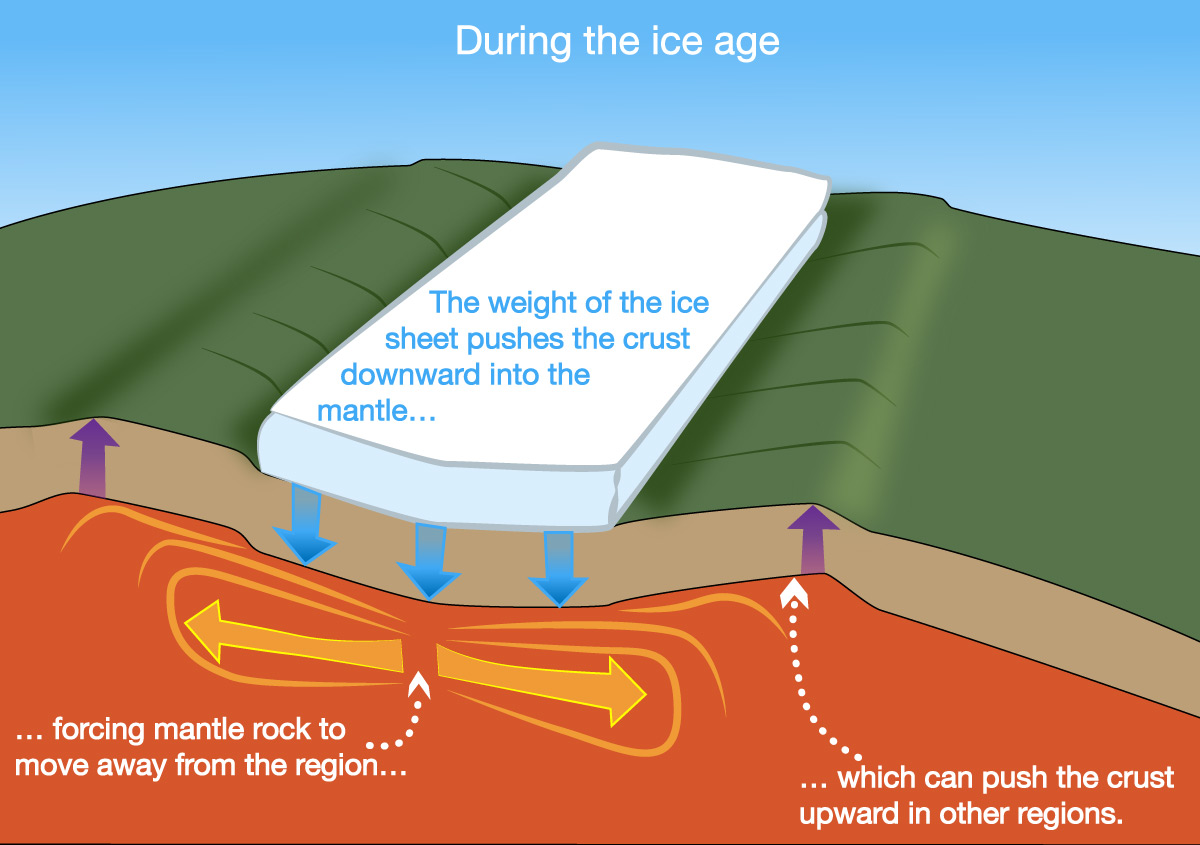
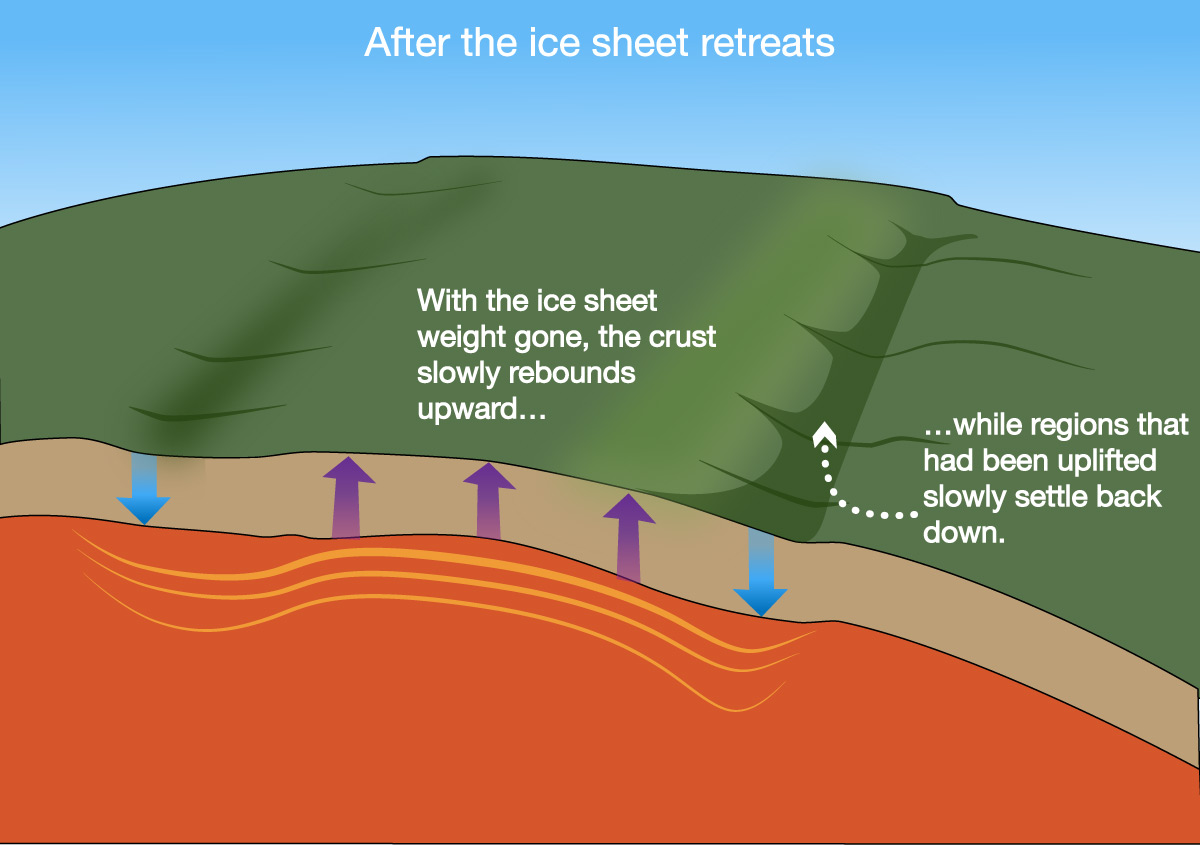
Figure 5.2.2–13 – These illustrations show the weight effects of the advance and retreat of ice sheets with the ice ages. Credit: Zofostro Science.
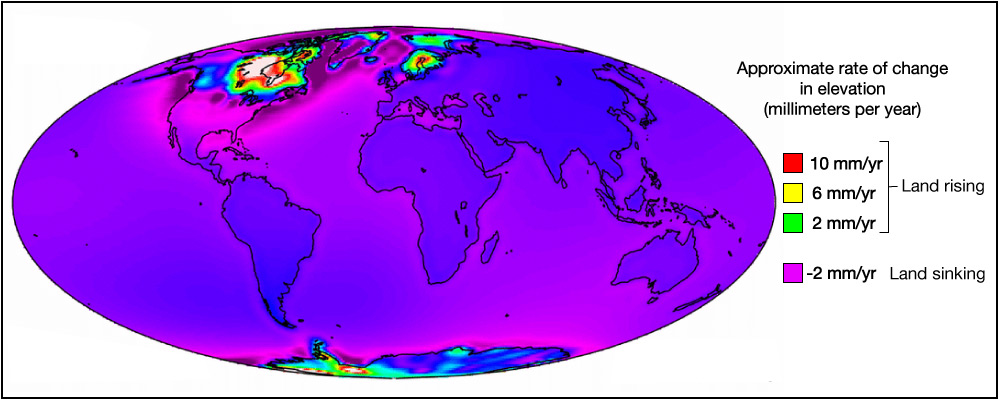
Amazingly, effects due to the lifting of the weight at the end of the last ice age are still being felt today (Figure 5.2.2–14): Careful measurements show that regions of North America and Europe that were covered by ice are still rising upward, while many regions that were away from the ice sheet — including the eastern coast of the United States and southern England — are still sinking down.
Glaciers and Sea Level
Where did all the water that made up the enormous ice sheets of the ice ages come from? It had to have come from the oceans, and that means that sea level must have fallen as all that water froze on the land. In fact, by studying evidence that can reveal the locations of past coastlines, scientists have confirmed that ice age sea level was more than 100 meters lower than it is today.
The lower sea level made coastlines around the world quite different than they are today (Figure 5.2.2–15). This is therefore the third major effect that glaciers have had on the continents, along with glacial erosion and the effects of glacial weight.
 This map shows the world during the last ice age. Click to compare to modern coastlines.

Figure 5.2.2–15 – The first map shows coastlines during the last ice age. Click to compare to modern coastlines. Notice the dramatic differences, including the fact that the connection between Asia and North America is now the Bering Strait. Credit: NOAA.
Connections—Human History
Reaching the Americas
The human species first arose in Africa, but people gradually spread throughout most of the world. It’s easy to understand how humans migrated from Africa to Europe and Asia, since they are connected by land. But how did people get to the Americas?
Archaeological evidence indicates that humans had established a presence in the Americas by at least 14,000 years ago. Remarkably, geological evidence shows that it would have been possible for people to have walked from Asia to the Americas at that time (and for a few thousand years before that as well).
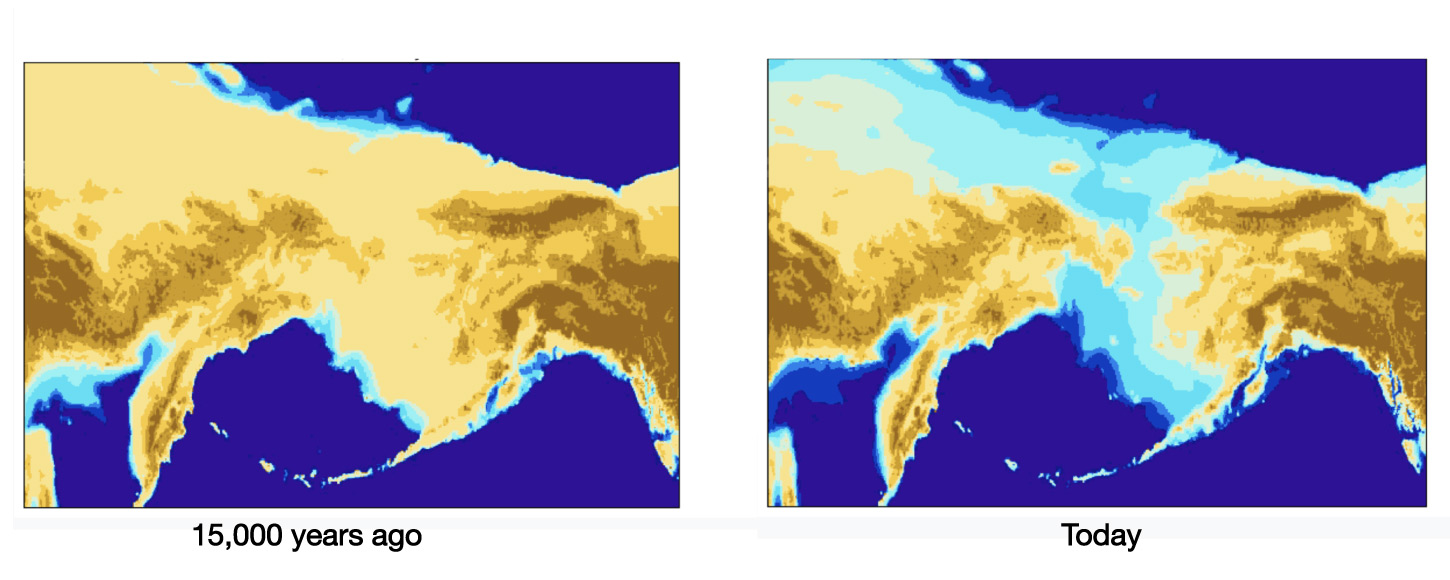
Walking was possible because the lower sea level during the last ice age connected Asia and North America across what is now the Bering Strait. The figure below compares the geography of the region — sometimes called Beringia — around 15,000 years ago to its geography today. In addition to allowing humans to cross between the continents, the land bridge also allowed the migration of many other species.
One question you might still have is whether walking would really have been feasible during the ice age, since you might guess that this northerly region would have been covered by an ice sheet. However, careful study of the region indicates that it received very little rain or snowfall at that time. As a result, it was probably grass-covered rather than ice-covered, making it a viable migration route despite low temperatures.
Discussion
Ice Ages and the Water Cycle
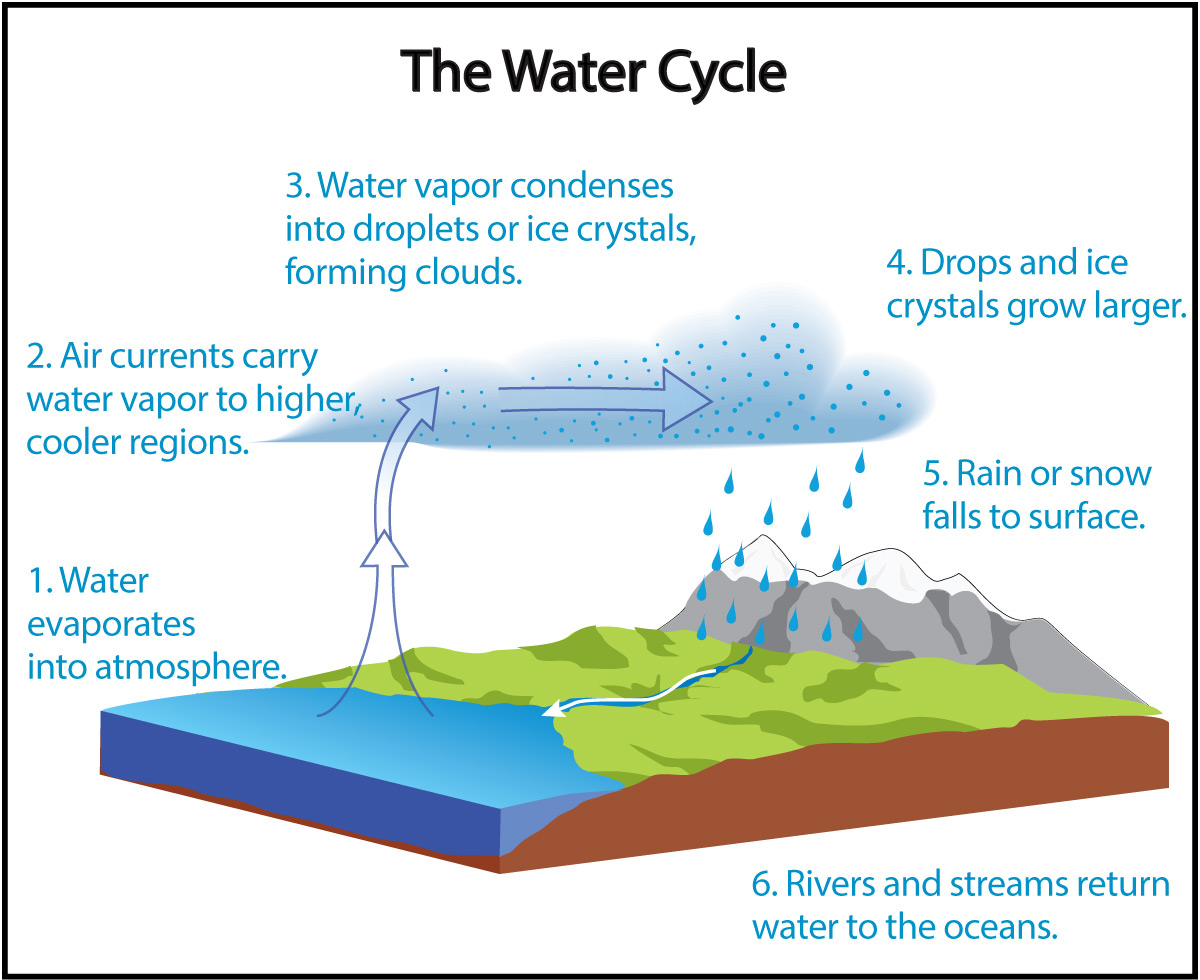
Look back at Figure 4.39 showing the water cycle. How would the water cycle differ as glaciers advance during an ice age compared to what happens when they retreat at the end of the ice age? Explain.
This simple discussion asks students to relate the water cycle to the ice ages.
- The basic answer is that as an ice age builds, step 6 (rivers carrying water to the ocean) is suppressed because the water stays frozen on the land. Therefore, step 1 (evaporation) out paces the return of water to the oceans, causing sea level to drop. When the ice age ends, step 6 moves at a greater rate than step 1, so water returns to the oceans, causing sea level to rise.
- You can use this opportunity to connect with what is happening with climate change today, as melting ice is causing sea level to rise further. We’ll discuss this in detail in Chapter 7.
Activity
Coastlines Near You
Where is your nearest coastline? Find a map showing how that coastline differed during the peak of the last ice age compared to where it is now. Make a list of major differences that you identify. Then discuss how your local community would be different if the coastline were still in its ice age location.
This activity will require students to do some online research, since the map above does not have enough resolution to give students details about local coastlines. In general, students will find that their nearest coastline was farther away during the ice age, due to the lower sea level. How that would affect your local community will of course depend on where you are located. For example, the effects would be quite large if you live in a coastal community that would instead be inland, and presumably less if you already live well inland.
Optional Video
Evidence of the Ice Age
If you have time and access to the series, watch the episode “America’s Ice Age” of the series “How the Earth was Made,” available here on Amazon. After watching the video, hold a brief class discussion about how scientists use evidence and reasoning in their work to learn about glaciation and the ice ages.
Students are usually very interested in the ice ages, so if you can spare the class time and have the access through Amazon, we recommend showing the video referenced in this activity. It is sure to spur some great discussion about the “detective work” of geology and how it helps us understand the ice ages.