We have now completed a general overview of what Earth looks like today. But Earth has not always looked as it does now. Moreover, it is not only Earth’s geological features that change with time, but also its atmosphere, oceans, and climate.
Understanding how and why our planet has changed through time is very important, because scientists have learned that for much of its history, Earth was not a place where we humans could have survived. Therefore, if we hope to ensure our continued survival, it is critical that we understand both natural and human-caused changes.
Time Scales of Change on Earth
Different types of change occur on different time scales. To get started, try the following discussion.
Group Discussion
Changes on Different Time Scales
Discuss the first 4 questions below in small groups, then come together as a class for question 5. For this discussion, focus only on natural changes, not human-caused changes.
- Identify and make a written list of at least 3 different types of change that can occur on Earth on time scales of just a few minutes or less.
- Identify and make a written list at least 3 different types of change that can occur on Earth on time scales between about a day and about a year.
- Identify and make a written list at least 3 different types of change that are generally only noticeable on time scales between tens to thousands of years.
- Can you identify any changes that are noticeable only on time scales of millions or billions of years? Try to make a written list at least three.
- After you’ve answered the prior questions in small groups, come together as a class to share your lists. Does seeing the lists from other groups give you further ideas? If so, work as a class to add to the lists.
This discussion relies on students’ prior knowledge, and some students will have more ideas than others. Notes:
- For all the questions: The specific content of the lists is not that important, since we will discuss changes later in the text. Here, the goal is simply to get students thinking about the fact that changes occur in many ways on many different time scales. Your primary role should be to help guide students who have difficulty thinking about the different time scales, so that they at least get some items on their initial lists.
- For (1): There are many different changes that students may think of for the time scales of minutes or less. For example: earthquakes, volcanic eruptions, landslides, sudden weather events (such as lightning strikes or downpours).
- For (2): Again, with a bit of guidance, students should be able to identify many changes with time scales of a day to a year. Examples might include: the advance of lava flows from a volcano, shifts in sand dunes, tides, weather changes, seasonal changes.
- For (3): Students are likely to have more difficulty coming up with ideas for changes noticeable on scales of tens to thousands of years, but some examples include: changes in local or global climate, growth of a forest, advance or retreat of glaciers, changes in the pathways of streams or rivers or sedimentation in deltas, extinctions of species. Note: Be sure that students don’t include changes that require longer time scales of millions to billions of years.
- For (4): This one is likely to be even more difficult for students, but here are some examples of changes that are generally noticeable only over millions to billions of years: rearrangement of the continents, rise or erosion of mountain ranges, changes in the oxygen content of the atmosphere, major changes in evolution leading to different species. For students thinking in long enough terms, they may even point out that the formation of our planet was a major “change.”
- For (5): We suggest that you as the teacher write a list in the front of the classroom that consolidates the student lists. Then ask if seeing the consolidated lists gives them any additional ideas to add to the lists.
As you should now realize, our planet changes on many different time scales. The shorter ones — minutes, days, years — are easy for us to see and understand. In contrast, it is much more difficult to wrap our heads around changes that occur on times scales longer than a human lifetime, and even more difficult to comprehend changes that take place on time scales longer than our civilization has existed. So, before we move on, let’s take a little time (a short time scale!) to try to put longer time scales in perspective.
Thousands, Millions, and Billions of Years
As a middle school student, you’ve probably only been alive for between 12 and 15 years. So how can you make sense of a time period of thousands, millions, or billions of years? Much as we did with the scale of space in Chapter 1, the best approach is to try to come up with scale models or analogies to make sense of time.
Let’s start by reviewing what these numbers mean:
- One thousand, or 1,000, is 1 followed by three zeros. We can also write 1,000 using powers of 10 notation as 103. (Because 103 means 10 × 10 × 10 = 1,000.)
- One million, or 1,000,000, is a 1 followed by six zeros, which means it is 1,000 times as large as one thousand. With powers of 10 notation, 1 million = 106.
- One billion, or 1,000,000,000 is a 1 followed by 9 zeros, which means it is 1,000 times as large as 1 million, and 1 million times as large as one thousand. With powers of 10 notation, 1 billion = 109.
The following questions require multiplying by 1,000 or 1 million, and for the latter two they require also converting metric units (millimeters into centimeters and meters, meters into kilometers). Some students may still struggle with these tasks. If that is the case, you might wish to pair up students who are good at these calculations with those who struggle, asking the good students to help the struggling ones to understand.
Use these ideas to answer the following questions either individually or working with a classmate. Then click to make sure you have found and understand the answers.
- Suppose you are earning $1,000 per month at your job. How long would it take you to earn $1 million?
Notice that $1 million is 1,000 times as much money as $1,000. Therefore, it would take you 1,000 months, which is the same as
1000 12 ≈ 83 years, to earn $1 million. - Suppose a star athlete earns $1 million per year. How long would it take her to earn $1 billion?
Notice that $1 billion is 1,000 times as much money as $1 million. Therefore, if she earns $1 million in 1 year, she would need 1,000 years to earn $1 billion.
- The thickness of a $1 bill is about 0.1 millimeter. (You can check this by measuring the thickness of a stack of 10 bills, then dividing the result by 10). Suppose you had one thousand $1 bills. How thick of a stack would they make?
The thickness of the stack of 1,000 bills would be 1,000 x 0.1 mm = 100 millimeters, which is the same as 10 centimeters or 0.1 meter.
- Suppose you could make a stack of $1 bills with one billion bills in the stack. How high would it rise?
Because 1 billion is 1 million times as much as 1,000, the stack of 1 billion bills would rise 1 million times as much as the stack of 1,000 bills. That means its height would be 1 million x 0.1 meter = 100,000 meters, or 100 kilometers. An altitude of 100 kilometers is generally considered to be the “edge of space” (where you can see stars in the daytime), so a stack of 1 billion bills would be tall enough to reach into space!
Journal Entry
Million and Billion
Many people mix up the words million and billion; after all, they look and sound almost the same, since the words differ only in their first letter. Suppose someone were to tell you that “million and billion are pretty much the same thing.” How would you convince them that the two numbers are in fact very different? Write a few sentences in your journal that explain the difference between the numbers million and billion. If you can, try to come up with your own example(s), different from the ones in the questions above.
This journal entry is designed simply to make sure that students are recognizing the tremendous difference (the factor of 1,000) between a million and a billion.
One way to try to put the big differences between time scales into perspective is to use a type of scale model sometimes called a “cosmic calendar,” which compresses the history of our universe into 1 year. The cosmic calendar begins with the birth of our universe (in the Big Bang) at the stroke of midnight on Jan. 1, and ends at with the present time being the stroke of midnight on December 31.
Figure 4.20 shows such a cosmic calendar, based on current scientific estimates that place the age of the universe at about 14 billion years. (Recall that this estimate is based on the observed rate of expansion of the universe, as discussed in Section 1.3.3.) Other events marked on the cosmic calendar are also based on current scientific evidence of when they occurred. (We’ll discuss the evidence for the timing of those relating to Earth in coming chapters.)


Slide Show 4.20 – The cosmic calendar compresses the 14-billion-year history of the universe into 1 year, so each month represents a little more than 1 billion years. Each step in the slide show zooms toward the present time (the stroke of midnight on Dec. 31). Credit: This version is adapted from The Cosmic Perspective, which is in turn adapted from the cosmic calendar developed by Carl Sagan (1934-1996).
As you explore the cosmic calendar, answer the following questions either individually or working with a classmate. Then click to make sure you have found and understand the answers.
Quick Quiz
Note: As always, after you finish the quiz, be sure you read the feedback that explains the correct answers, to make sure you understand the reasons for these answers.
Formation of the Earth
Scientific study of our solar system has revealed very strong evidence that the Sun and the planets all formed at about the same time, about 4½ billion years ago. (We’ll discuss how scientists know this age in Chapter 5.) The cosmic calendar shows that this was about 2/3 of the way through the history of the universe to date.
Because we will focus our attention in the rest of the book on our planet Earth, it’s useful to make a timeline that starts with Earth’s birth rather than at the beginning of the universe. The following activity will help you make such a timeline.
Activity
Time Line for Earth
Working in small groups or as a class, make a time line for Earth’s 4½-billion-year history, using a length that is available to you at your school, such as the length of your classroom, the length of a hallway, the length of the school cafeteria or gym, or the length of an outdoor play field. Proceed as follows.
Materials needed: (1) Roll of string; (2) ribbon or tape that you can attach to the string and write on to mark key events on the time line; (3) ruler, meter stick, or other measuring device.
- Use the roll of string to stretch a piece of string across the length of your chosen time line. Then cut the string to the correct length. Put a piece of tape or ribbon on each end, with one end labeled “Earth’s birth” and the other end labeled “the present.”
- Measure the length of your time line. Hint: One way to do this is to use a ruler or meter stick to measure the length of the string you have already cut.
- If you’ve moved the string, lay it back out along the length of your chosen time line. The full length represents Earth’s history of 4½ billion years. What length represents 1 billion years? Working back from the end of the string representing the present, put tape or ribbon to mark 1 billion years ago, 2 billion years ago, 3 billion years ago, and 4 billion years ago. Label each of those times.
- What length represents 1 million years? Place and label pieces of tape or ribbon to represent 1 million years ago, 10 million years ago, and 100 million years ago.
- What length represents 1000 years? Would it be possible for you to accurately put a piece of tape at a position marking 1000 years ago? How about 100 years ago? Hint 1: Finding the lengths should be easy if you remember that 1 millimeter = 1,000 micrometers (a micrometer is a millionth of a meter). Hint 2: For comparisons, the average thickness of a human hair is about 100 micrometers.
- Discuss how the time scale of human history compares to the length of Earth’s history.
- Carefully roll up your string and save it, so that you can use it again as a time line later.
This activity creates a timeline for Earth that you can continue to use for geologic time. Choose your group size based on how much string you have available for making the timelines. If you have multiple groups, you can allow them to choose their own length; for example, one group might do the length of a classroom, while another does the length of a hallway or a cafeteria, etc.
- Step 1: You may need to remind students that they don’t need to worry about being perfect with the length. We are dealing such large numbers (billions of years) that approximations will be fine.
- Step 2: Be sure that students measure the length in meters (not feet or yards), so the division in subsequent steps will be easy.
- Step 3: Students can find the length representing 1 billion years simply by dividing the total length by 4.5. Then they can find the length for 1 million years by dividing that result by 1,000. For example: If their timeline is 10 meters long, then 10/4.5 ≈ 2.2 meters corresponds to 1 billion years. Be sure that students place the tape for the past times correctly; for example, be sure they put “1 billion years ago” at the correct distance from the end labeled “the present” and not from the end representing Earth’s birth.
- Step 4: This step should be very easy if students remember that there are 1,000 millimeters in a meter. For example, if the distance from Step 3 representing 1 billion years is 2.2. meters, then the distance representing 1 million years is 2.2 millimeters. They would then place their tape for 1 million years ago just 2.2 mm from the end representing the present, 10 million years ago at 2.2 cm, and 100 million years ago at 22 cm. Encourage your students to pay attention to the differences in factors of 10 from 1 million to 1 billion years.
- Step 5. The first hint reminds students that the division is easy given that there are 1000 micrometers in a millimeter. Continuing with the example numbers above: If 1 million years is 2.2 millimeters, then 1,000 years is 2.2 micrometers and 100 years is 0.22 micrometers. The second hint tells them that these lengths are much smaller than the thickness of a human hair, which means there is no realistic way of putting tape at the correct places.
- Steps 6 and 7. You can guide the discussion for the length of time you feel appropriate. Save the student’s pieces of string so that they can work with them again later.
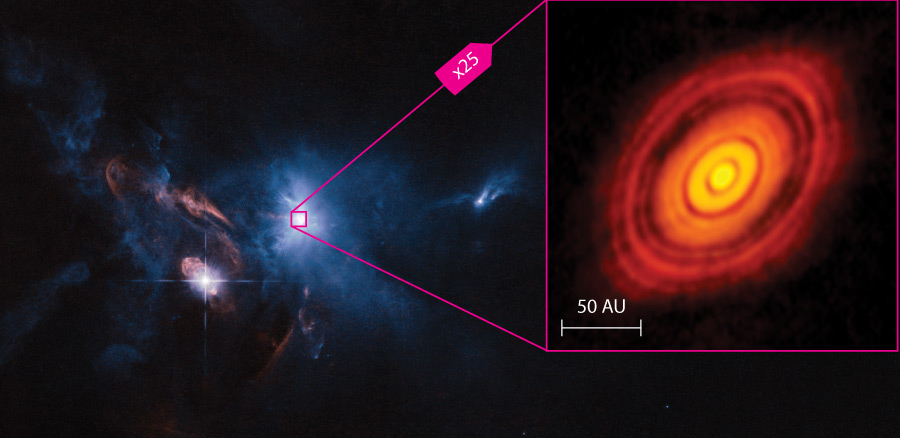
Your timeline has Earth’s birth at one end, and you already know a little bit about how that happened. Recall from Section 3.4.3. that telescopic observations of star-forming clouds in space show that stars form as gravity causes huge clouds of gas and dust to contract in size. Moreover, as part of this process, the cloud flattens into a disk around the young star (see Figure 3.36-3 for a real example of this process in action, and Figure 3.37 to review why it occurs). Planets can then form in this disk. This is exactly what scientists presume happened as our solar system formed.
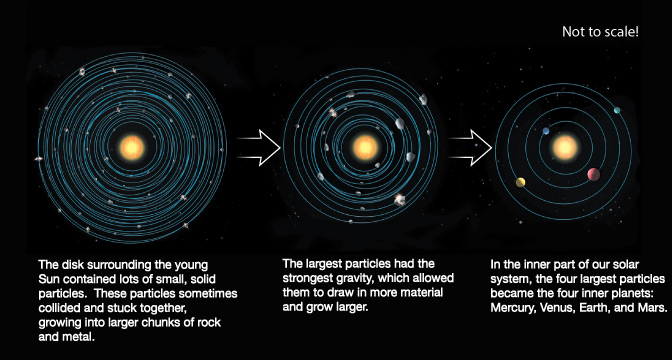
The actual formation of planets is thought to have begun with small, solid particles condensing within the disk-shaped cloud of gas, in much the same way that solid snowflakes or hail stones form in clouds on Earth. These particles collided with each other frequently, sometimes sticking together and growing larger . As they grew, their gravity strengthened, drawing in more material and allowing some of them to grow into the planets we see today, including Earth (Figure 4.21).
It’s worth noting that not all of the solid particles in the disk became part of a planet during this process. In other words, there were plenty of “leftover” particles (with a wide range of sizes) still orbiting the Sun. You might wonder what happened to these, and they basically had two possible fates:
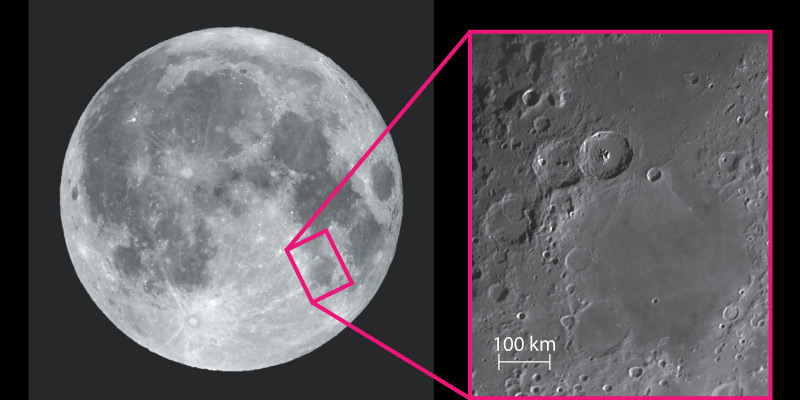
- Most of those leftover particles long ago crashed into one of the planets. The impact craters we see on the Moon and many other worlds are the scars of some of these crashes (Figure 4.22).
- Some of the leftovers still remain orbiting the Sun, including those that we call asteroids and comets , and those that occasionally fall to the ground as meteorites .
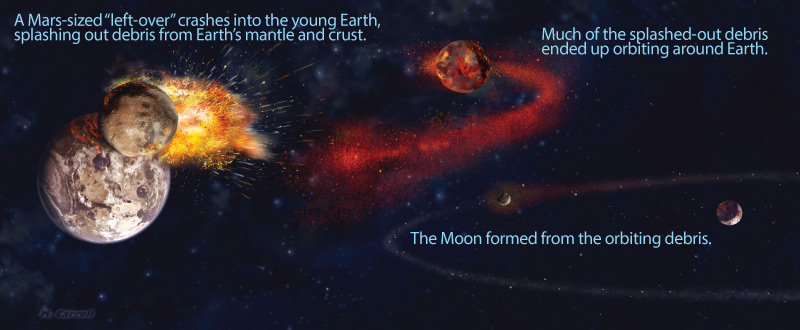
Regardless of exactly how the Moon formed, careful analysis of Earth rocks, Moon rocks, and meteorites has led scientists to conclude that both Earth and the Moon had essentially finished forming within 50 million years after the formation of the rotating disk of gas. While 50 million years is a very long time for us humans, it is very short compared to the time that Earth has been around since.
Discussion
Earth’s Formation on the Cosmic Calendar
Working in small groups, figure out how long 50 million years would be on the cosmic calendar (in which the history of the universe is compressed to one year). Then look back at the cosmic calendar in Figure 4.20 and discuss what it means to say Earth “formed” on September 3 of the calendar.
Optional: Also figure out how long 50 million years is on your time line, and label a piece of tape at the correct position to represent “Earth and Moon fully formed.”
This discussion requires students to do a simple calculation similar to those we have done already, followed by interpretation on the cosmic calendar of Figure 4.20. In particular:
- Earlier, students learned that 1 month on the cosmic calendar is about 1.2 billion years (14 billion years divided by 12 months). Therefore, 1 day is about 1.2 billion years 30 ≈ 40 million years. Therefore, 50 million years of real time is a just a little over 1 day on the cosmic calendar.
- So when the cosmic calendar shows that Earth “forms” on Sept. 3, it’s really essentially an “all day” event. This points out that while the formation was “quick” compared to the time Earth has been around since, it is still much longer than the many events relating to human civilization that have unfolded in just the last 30 seconds or so of the cosmic calendar.
- For the optional part: In the activity above, students have already figure out how long a length represents 100 million years, so half of that is 50 million years. Be sure they then put “Earth and Moon fully formed” on the correct end of their string (the Earth’s birth end).
The Geological Time Scale
The timeline you’ve been making for Earth’s history so far shows only its beginning with Earth’s birth, its end at the present time, and a few labels for different amounts of time in the past (1 billion years ago, 2 billion years ago, etc.). As you might guess, there is a lot more to fill in.
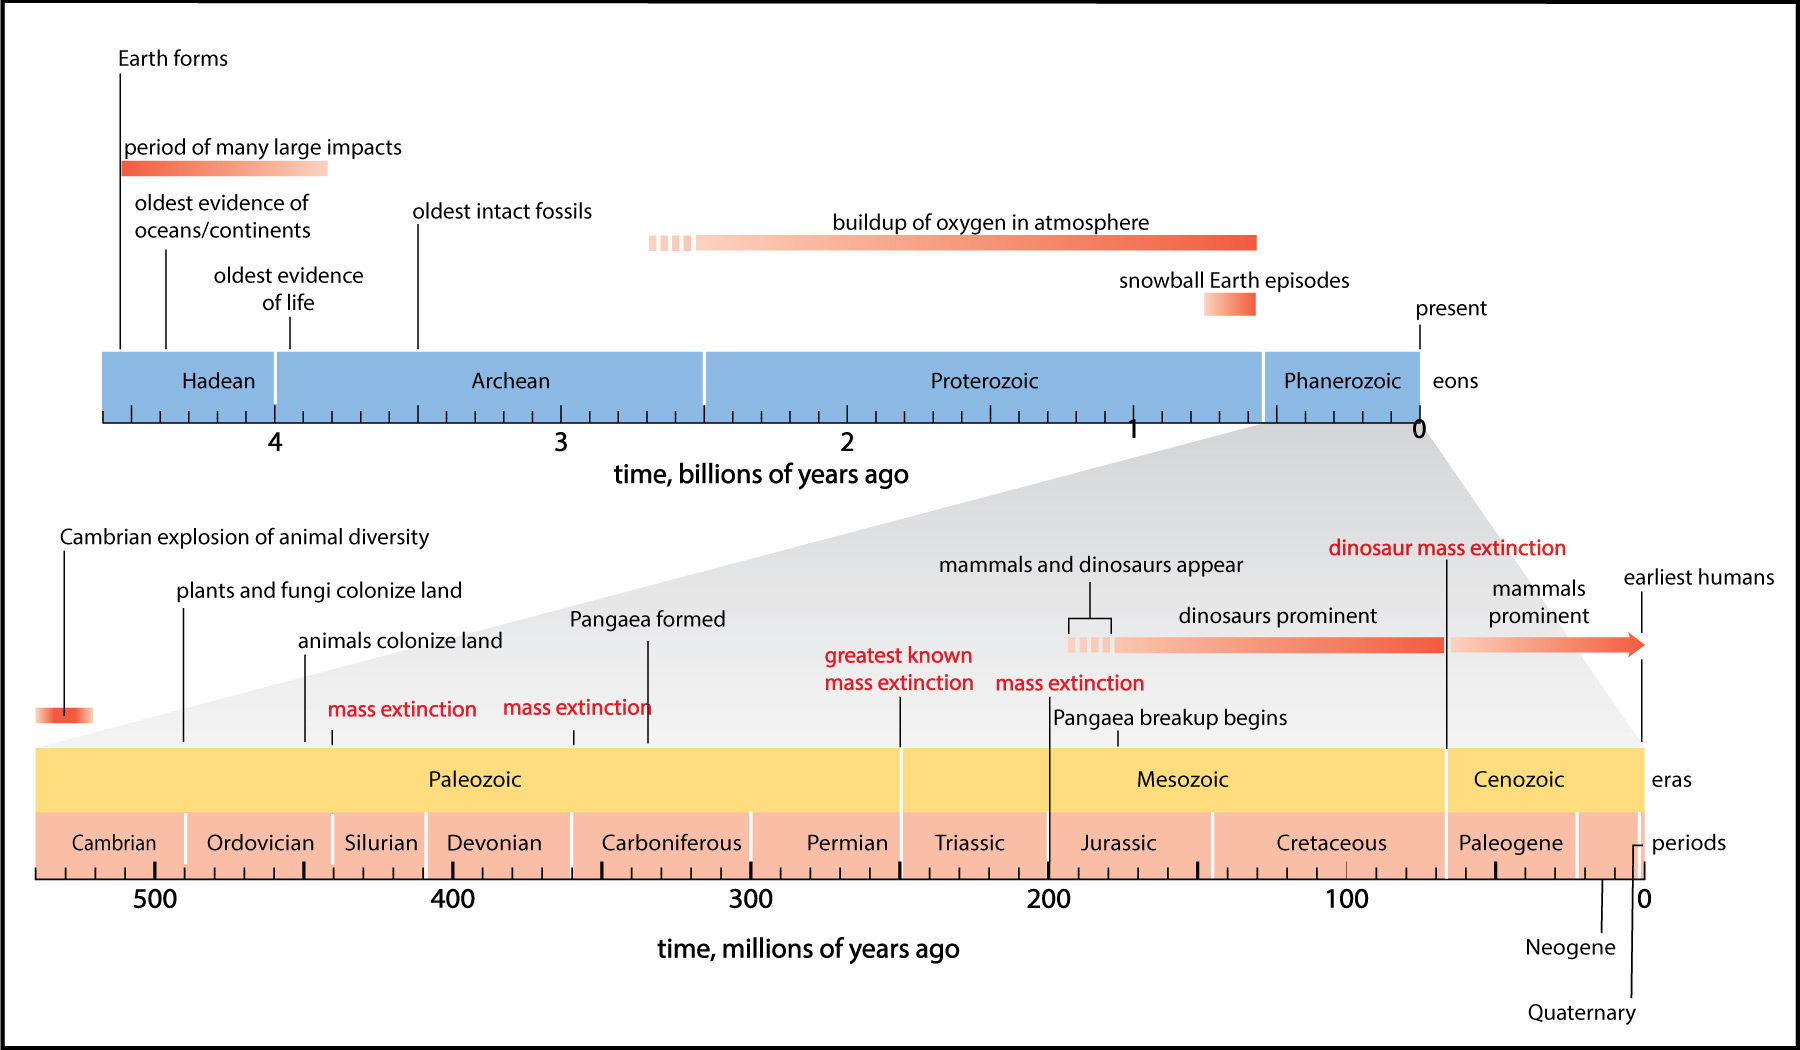
Figure 4.24 shows some of these additional events that make up what we call the geological time scale . (Notice that some of these events are also marked on the cosmic calendar in Figure 4.20.) The geological time scale is much like the timeline you have already been making, except that it gives names to many different time intervals in Earth’s past. These names are not important for our purposes, so please don’t feel obligated to memorize them. What is important is that each named interval represents some significant change on Earth that scientists have identified by careful study of rocks and fossils.
We will discuss many of the details of the geological time scale in later chapters, including how scientists identify the changes that have occurred in the past. For now, just spend a couple minutes examining the time scale, so that you’ll begin to have some context for our discussions later. You should also try the following activity and journal entry.
Activity
Time Line Part 2
Return to the time line you made earlier for Earth’s 4½-billion-year history, again stretching your string down the room, hallway, or other place you are using. Add and label pieces of tape or ribbon for at least 6 of the events labeled in Figure 4.24, putting them in the correct places on your time line. Be careful: remember that the zoomout is labeled in millions of years ago, compared to billions of years for the main timeline.
This activity builds on the earlier timeline activity. The biggest challenge for students is likely to be placing the events correctly. Help them remember that:
- The main timeline is labeled in billions of years ago, so they should be measuring back from the present. Or, for early events, they can work forward from Earth’s birth, but they’ll have to subtract to get the correct positions. For example, if they are labeling “earliest evidence of life” that is at 3.95 billion years ago, that means it is 4.5 – 3.95 = 0.55 billion years after Earth’s birth. Then they will need to multiply by whatever length represents 1 billion years on their timeline to put the marker in the correct place.
- The zoomout of the Phanerozoic eon shows millions of years ago, so definitely work back from the present for events shown there.
Journal Entry
A Major Event in Earth’s History
Read of the names of the key events shown on the geological time scale in Figure 4.24 (that is, the names of the events marked above the time line, such as “earliest evidence of life” or “snowball Earth episodes,” not the names given to different time intervals). These events probably don’t mean much to you yet, since we haven’t yet talked about any of them in detail. Choose one event with a name that interests you, and spend about 10 to 15 minutes learning about it by searching for information about it on the web. Then write 1 or 2 paragraphs in which you briefly explain what the name means, and why you might want to learn more about it.
This journal entry is meant to be kept simple, since students could, of course, spend hours researching each event named in Figure 4.24. That is why we suggest spending only about 10 to 15 minutes on their independent research before writing a short summary of what they’ve found and what more they’d like to learn. As an example, an entry on “snowball Earth episodes” might simply note that these are times when Earth went into extremely deep ice ages, and then state this makes them curious about how these events happened and how they might have influenced the evolution of life.