Throughout history, people around the world have paid close attention to the seasons, because their lives depended on it. Even before the advent of agriculture, hunters and gatherers needed to understand the seasons to know when migration would bring different animals their way and when native fruits would be available for collection. Once agriculture began, tracking the seasons was critical for people to know when to plant and harvest crops. That is why many of the most ancient structures in the world were designed in ways that helped people track the seasons.
Seasons in the Local Sky
It is possible to track the seasons because of the way the Sun’s path through the local sky changes over the course of the year. You can see the idea by looking back at Figure 2.5 (Section 2.1.1), which shows Sun paths at different times of year for latitude 40°N. Notice, for example, that the Sun rises due east and sets due west only on the dates of what we call the equinoxes (which we’ll discuss shortly). This fact means that ancient people could determine when those dates occurred by building structures that helped them to know when the Sun rose due east and set due west. They could similarly determine other special dates, such as when the Sun rises to its highest or lowest points of the year in the local sky.
Group Discussion
Seasons in the Local Sky
What does the path of the Sun look like during different seasons for your location? Discuss what you know about the Sun’s path at different times of year, and work together to try to make a diagram similar to Figure 2.5 for your latitude.
Teacher Notes: The goal of this discussion is for students to be able to understand how the daily path of the Sun through your local sky changes with the seasons for your location. The difficulty will depend on how much your students have paid attention to the seasons in the past. You should help steer the discussion to help students make their local version of Figure 2.5, showing the Sun’s path as it appears locally on the solstices in June and December and on the equinoxes in March and September. Answers will depend on your latitude, and for this discussion the goal is only to do your own latitude. However, in case you are unsure, here are the answers that you should come up with at different latitudes:
- For all latitudes: the Sun rises due east and sets due west only on the dates of the equinoxes.
- For all latitudes, the June solstice is the date when the Sun rises at its farthest north of due east and sets at its farthest north of due west. However, the exact amount to the north of due east/west depends on your latitude (and if you are inside the Arctic Circle, the Sun becomes circumpolar around the June solstice).
- For all latitudes, the December solstice is the date when the Sun rises at its farthest south of due east and sets at its farthest south of due west. Again, the exact amount to the south of due east/west depends on your latitude (and if you are inside the Arctic Circle, the Sun never rises around the December solstice).
- The midday altitude of the Sun varies with latitude. For most of the northern hemisphere, it is highest on the June solstice, and for most of the southern hemisphere, it is highest on the December solstice. The exceptions are in the tropics between latitudes 23½°N and 23½°S. At the Tropic of Cancer (23½°N) the Sun reaches the zenith on the June solstice, and at the Tropic of Capricorn (23½°S) the Sun reaches the zenith on the December solstice. In between those latitudes, the Sun reaches the zenith twice each year on dates that vary with latitude; for the equator, the Sun reaches the zenith on the two equinoxes.
Activity
Ancient Structures for Tracking the Seasons
There are many ancient structures that were built at least in part to keep track of the seasons. A few of the more famous ones include Stonehenge in England, the Sun Dagger in New Mexico, the Temple of Karnak in Egypt, the city of Machu Picchu in Peru, Angor Wat in Cambodia, and many more. Divide your class into small groups, with each group doing a little research to learn about an ancient structure that was used to track the seasons. Each group should then report back to the whole class, using pictures or scale models as needed to describe what you learned.
Teacher Notes: This activity is optional but can be fun and is a good way to bring in multicultural connections to the topic of the seasons. One recommended strategy is to give students a few minutes in class to work with their groups to find basic information about the structure they will report on, then as homework ask them to put together their report including pictures and scale models. The reports could either be oral to the class or poster presentations on display boards.
Ancient people probably assumed that the reason the Sun’s path changed throughout the year had something to do with the Sun itself. In particular, the ancient Greeks attributed the changing path to the fact that the ecliptic is tilted to the celestial equator on the celestial sphere (look back at Figure 2.6).
The Real Reason for Seasons
Today, we know that the real reason for seasons does not lie with the Sun itself, but rather with our own Earth: We have seasons because of the tilt of Earth’s axis relative to our orbit around the Sun.
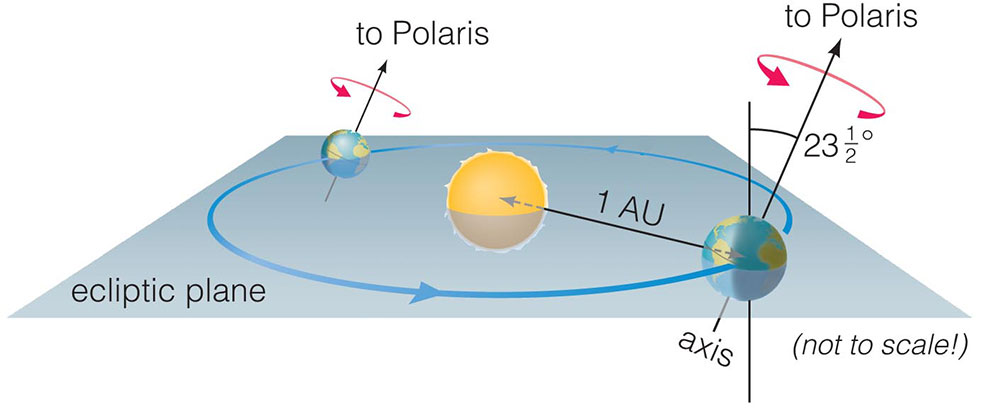
You are already familiar with the idea of axis tilt from Chapter 1, and for review we repeat Figure 1.28 (and its associated video) here. The key point for understanding seasons is that although the axis remains pointed toward Polaris (or more technically, the north celestial pole) throughout the year, the fact that Earth orbits around the Sun means that the tilt relative to the Sun varies.
Activity
Tilt Relative to the Sun
Put a bright light in the center of a table, then hold a globe with its axis titled correctly at 23½° relative to the table. Walk around the table holding the globe steady, so its axis always remains pointed in the same direction, just as Earth’s axis remains pointed toward Polaris as Earth orbits the Sun.
- At which point as you walk around the table is the Northern Hemisphere tilted most directly toward the Sun? At which point is it tilted most directly away from the Sun?
- What do you notice about the Southern Hemisphere at those same points?
- In your own words, now explain this statement: “Earth’s axis remains tilted in the same direction in space all year long, but its tilt relative to the Sun changes as it orbits the Sun.”
- Which point do you think represents summer for the Northern Hemisphere? Which point represents summer for the Southern Hemisphere? Explain your reasoning.
- Where do you think fall and spring are occurring? Is either hemisphere tilted toward the Sun at those points?
- Use what you’ve learned to explain why seasons are opposite in the northern and southern hemispheres.
Teacher Notes. This activity works best if you represent the Sun with a bright light bulb on a lamp (with no lamp shade) placed on the center of a table and represent Earth with a globe mounted on a stand with the correct axis tilt.
- If you don’t have access to those things, you can represent the Sun with a yellow ball on the table, and use a Styrofoam ball with a stick through it to represent Earth and its axis.
- Ideally, you’ll have multiple setups like this, so that each student would get a chance to do the activity of walking around the table with a globe themselves. If you don’t have enough lamps and globes, you can have one student do the walking while others watch and help answer the questions.
Here are a few notes on the activity questions:
- Be sure students are walking around the table correctly, keeping the axis oriented the same direction in space (e.g., toward some point in the classroom) at all times, and holding the globe roughly in the same plane as the table as they walk. If they do this, they should quickly notice and understand that there will be one side of the table where the Northern Hemisphere will be tilted most directly toward the Sun, and that it will be most directly tilted away on the opposite side of the table.
- Students should also quickly recognize that the situation is opposite for the Southern Hemisphere: it is tilted away from the Sun when the Northern Hemisphere is tilted toward it, and vice versa.
- Students should be able to explain that the part about remaining tilted in the same direction “in space” refers to the axis staying steady, and the part about changing “relative to the Sun” is arising because Earth is on different sides of the Sun at different times.
- This question jumps ahead a bit compared to what we’ve discussed so far, but most students will probably realize that Northern Hemisphere summer occurs at the point where the Northern Hemisphere is tilted toward the Sun and Southern Hemisphere summer at the opposite point. In terms of reasoning, students should be thinking about how direct the sunlight would be at the different orbital points.
- If they’ve understood so far, students should realize that fall and spring are at the in-between points as they go around the table; if they stand at the precise points representing the equinoxes, they’ll see that neither hemisphere is tilted toward the Sun at that time, and both have equal illumination. They should discuss why those are also opposite for the two hemispheres.
- They should now be able to explain that the seasons are opposite because axis tilt means that however one hemisphere is tilted relative to the Sun, the other is the opposite at the same point.
Remember the Scale!
The activity you’ve just done is very good for understanding the way in which Earth rotates on its axis and orbits the Sun, but it is way off in terms of scale. Look back at our scale model solar system in Chapter 1 and remember that on a scale on which the Sun is the size of a grapefruit, Earth is smaller than the ballpoint in a pen and located about 15 meters away.
Group Discussion
Earth Orbit to Scale
- Suppose we wanted to do the same activity as above with the correct scale. Given the light bulb used for the Sun, about what size Earth would we need, and about how far from the Sun would we need to walk around with it?
- Using the correct scale, would there be any noticeable difference in the distance of different parts of the Earth from the Sun at any particular moment?
- A common misconception holds that summer occurs when Earth is closer to the Sun and winter when Earth is farther from the Sun. How does the fact that the two hemispheres have opposite seasons prove this misconception to be wrong?
Teacher Notes. You are probably aware that the most common misconception about seasons is that they have to do with varying distance from the Sun. This misconception actually takes two forms. The first focuses on the fact that Earth’s elliptical orbit means we really are at different distances at different times; however, for reasons explained later in this section, the difference in distance is not enough to make any difference for Earth. The second comes from activities (and illustrations) like we are doing in this section: For example, when you walk around a table with a globe, it can look like the Northern Hemisphere is actually closer to the Sun than the Southern Hemisphere on one side of the table. This discussion about scale is designed to dispel both versions of the misconception. Notes on the questions:
- The exact answer would depend on the size of the light bulb (or ball) you use for the Sun, but we only need an approximate answer here; students should recognize that Earth would be very tiny and quite a few yards/meters from the Sun.
- Once they understand the correct scale, they should realize that all parts of Earth (even the day and night sides) are for practical purposes all at the same distance from the Sun at any given moment.
- Because all parts of the Earth are at the same distance at any given moment, if the seasons had anything to do with distance, then the entire Earth would have to have the same season at the same time. The fact that the seasons are opposite in the two hemispheres proves that this cannot be the case.
Seasons Explained
From the activity above, you already understand how Earth’s axis tilt leads the two hemispheres to have opposite seasons. Figure 2.18 and its associated video go through these ideas in a little more depth. Study the figure and watch the video, then make sure you understand the following key points explained in the four steps outlined in the figure.
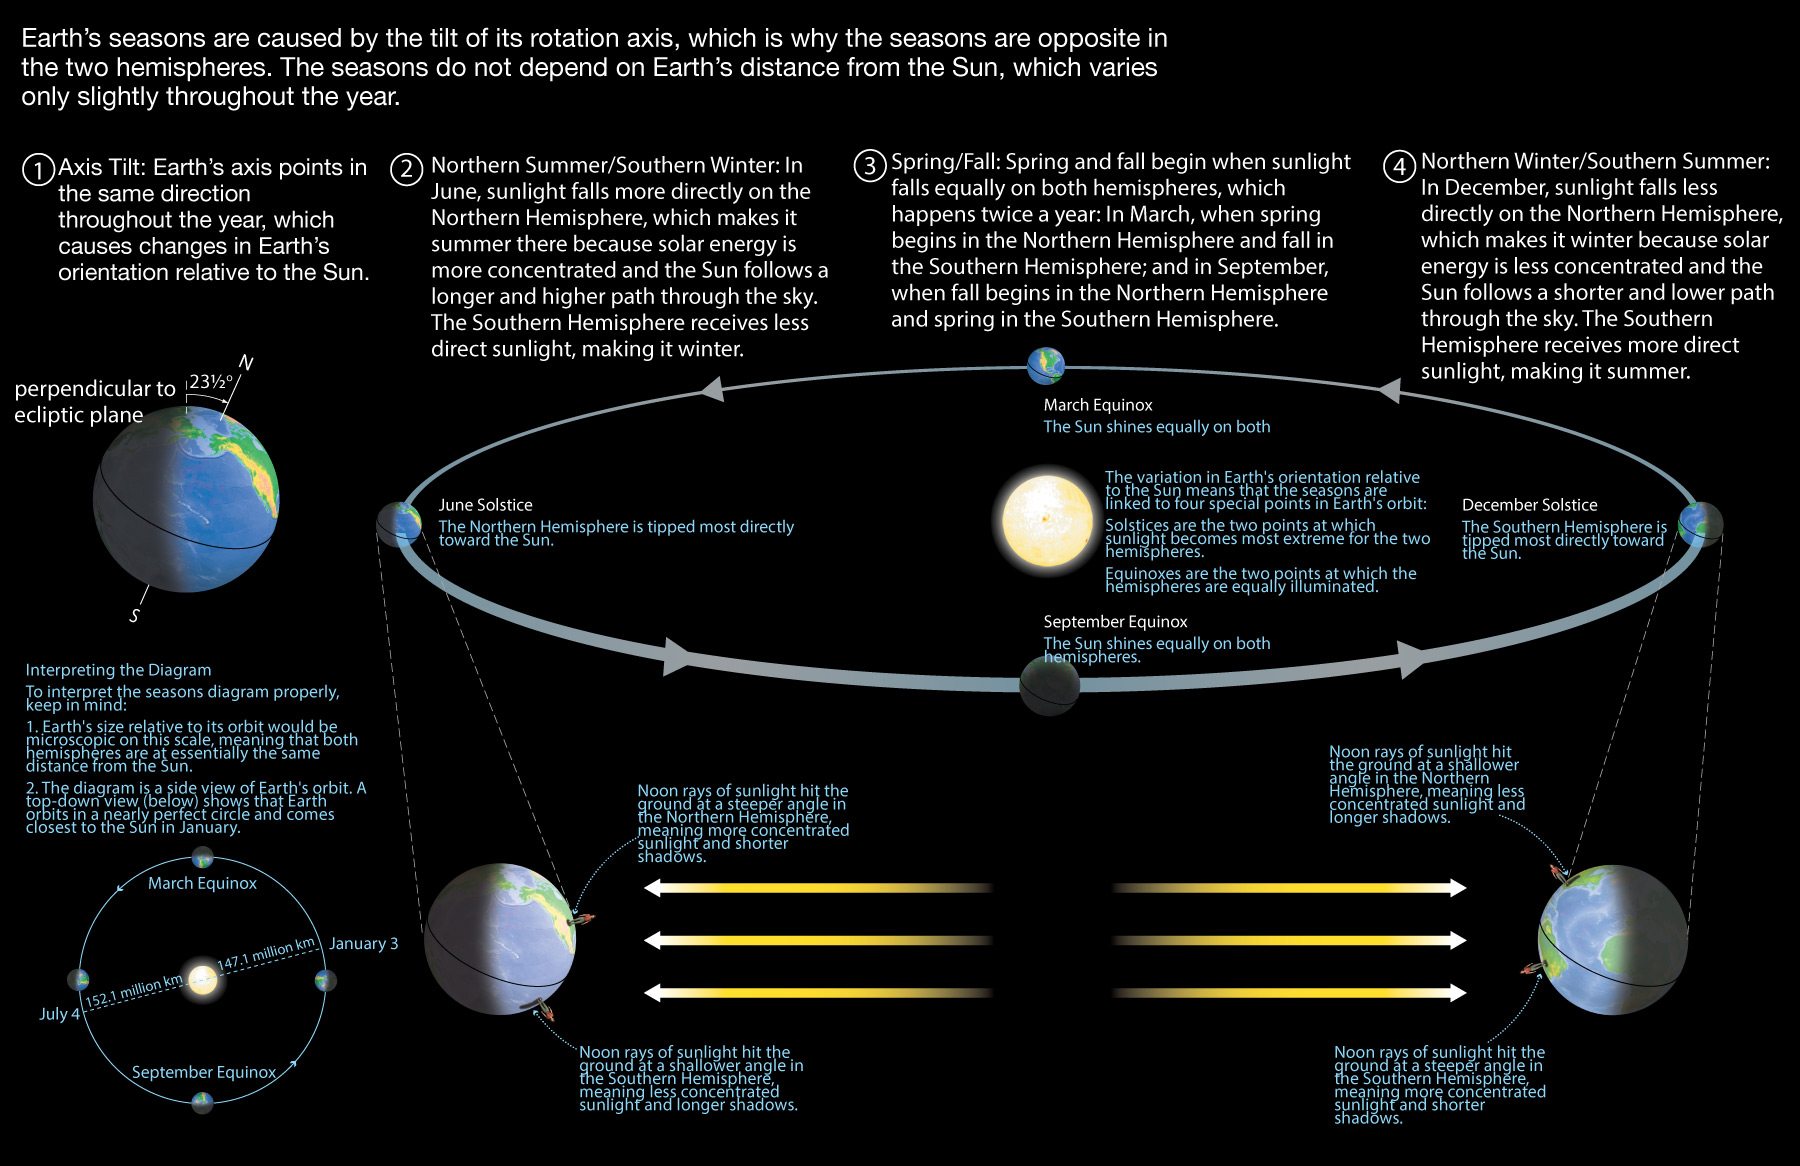
Step 1 illustrates what you already know: Earth’s axis remains titled in the same direction in space at all times throughout the year. It also shows (at the lower left of the figure) that Earth’s distance from the Sun varies slightly over the course of each year, but not by enough to make a difference in our seasons.
Step 2 shows Earth in June. As you can see in the zoomed out view toward the bottom of the illustration, this is the time when the axis tilt causes sunlight to strike the Northern Hemisphere at a steeper angle than the Southern Hemisphere. The steeper sunlight angle makes it summer in the Northern Hemisphere for two reasons.
- First, as you can tell from the smaller midday shadow, the steeper angle means more concentrated sunlight, which tends to make it warmer.
- Second, if you visualize what happens as Earth rotates each day, you’ll see that the steeper angle also means the Sun follows a longer and higher path through the sky, giving the Northern Hemisphere more hours of daylight during which it is warmed by the Sun.
The opposite is true for the Southern Hemisphere in June: The shallower sunlight angle makes it winter there because sunlight is less concentrated and the Sun follows a shorter, lower path through the sky.
Notice that the sunlight angle gradually changes as Earth orbits the Sun, and Step 3 shows Earth at its March and September positions while Step 4 shows Earth at its December position. As you already know, the December situation is just the reverse of June: It has become winter for the Northern Hemisphere and summer for the Southern Hemisphere. Step 3 represents the intermediate positions between the June and December extremes, at which times both hemispheres are illuminated equally. It is therefore spring for the hemisphere that is on the way from winter to summer and fall for the hemisphere on the way from summer to winter.
Key Concepts: The Reason for Seasons
Many people incorrectly guess that seasons are caused by variations in Earth’s distance from the Sun. But if this were true, the whole Earth would have summer or winter at the same time, and it doesn’t: The seasons are opposite in the Northern and Southern Hemispheres. As you should now understand, the real cause of seasons is Earth’s axis tilt, which causes the two hemispheres to take turns being tipped toward the Sun over the course of each year
Solstices and Equinoxes
Figure 2.18 also shows that we give special names to four special positions in Earth’s orbit, each of which corresponds to particular moment in time during the year:
- The June solstice (often called the summer solstice in the Northern Hemisphere) occurs around June 21 and is the moment when the Northern Hemisphere is tipped most directly toward the Sun and receives its most direct sunlight.
- The December solstice (or winter solstice in the Northern Hemisphere) occurs around December 21 and is the moment when the Northern Hemisphere receives its least direct sunlight.
- The March equinox (or spring equinox in the Northern Hemisphere) occurs around March 21 and is the moment when the Northern Hemisphere goes from being tipped slightly away from the Sun to being tipped slightly toward the Sun.
- The September equinox (or fall equinox in the Northern Hemisphere) occurs around September 22 and is the moment when the Northern Hemisphere first starts to be tipped away from the Sun.
Note: We say “around June 21” (and so on) because the exact dates and times can vary by up to a couple of days, depending on where we are in the leap year cycle. In fact, our modern calendar includes leap years (usually adding one day — February 29 — every fourth year) specifically to make sure that the solstices and equinoxes will always occur around the same dates. (Fyi, our modern calendar, also called the Gregorian calendar, was invented in 1582. Before that, the dates of the solstices and equinoxes moved gradually through the calendar over the centuries.)
Notice that the two equinoxes are the dates at which the Sun shines equally on both hemispheres. As a result, we find that the dates of the equinoxes are special in two important ways:
- The dates of the equinoxes are the only two dates when the Sun rises exactly due east and sets exactly due west.
- For all locations on Earth (except the poles), the Sun is above the horizon for 12 hours and below the horizon for 12 hours on the dates of the equinoxes. (In fact, the word equinox means “equal night.”)
The solstices are the dates of the extremes of the Sun’s path through the sky, with the Sun following its northern-most path on the June solstice and its southern-most path on the December solstice.
First Days of Seasons
You’ll often hear people say that each equinox and solstice marks the first day of a season. For example, the day of the June solstice is often called the “first day of summer” in the Northern Hemisphere. Notice, however, that the Northern Hemisphere has its maximum tilt toward the Sun at this time. You might then wonder why we often consider the solstice to be the beginning of summer rather than the midpoint of summer. The answer stems from two ideas.
First, it was much easier for ancient people to identify the days on which the Sun reached extreme positions in the sky—such as when it reached its highest point on the summer solstice—than other days in between. Many famous ancient structures were built to help mark these dates, which were in turn used to keep track of the changing seasons.
Second, we usually think of the seasons in terms of weather, and the warmest summer weather tends to come 1 to 2 months after the solstice. To understand why, think about what happens when you heat a pot of cold soup. Even though you may have the stove turned on high from the start, it takes a while for the soup to warm up. In the same way, it takes some time for sunlight to heat the ground and oceans from the cold of winter to the warmth of summer. “Midsummer” in terms of weather therefore comes in late July and early August for the Northern Hemisphere, which makes the June solstice a pretty good choice for the “first day of summer.” Similar logic applies to the starting times for spring, fall, and winter.
Group Discussion
Temperature
You may notice a similar phenomenon on many individual days. For example, on a clear, sunny day, it is typically warmer in the mid- to late-afternoon than it is around noon, even though the Sun is higher in the sky around noon. Explain why, and discuss why this is not always the case.
Teacher Notes. For this discussion, the main point is for students to realize that the Sun is highest in the sky around noon (or 1pm for daylight saving time), but it tends to keep warming up through much of the afternoon because the ground is still absorbing more sunlight. This is analogous to the cup of soup and the timing of the warmest seasonal weather as discussed in the paragraph above. For why it is not always the case: students should be thinking about how rapid changes in weather can change the general pattern. For example, if a storm is coming in, the temperature might rapidly drop. Thinking about weather like this will help prepare students for our discussions of weather and climate later in the course.
The Rate of Seasonal Change
Teacher Notes. We include this optional subsection because it is so obviously noticeable, and the optional activity will help students confirm its effects. However, we don’t do much with it here, since explaining it in detail is beyond the scope of middle school science. But since some of your students will probably want to know, here’s the reason: If you look at the ecliptic on the celestial sphere (as in Figure 2.6), you’ll see that the Sun crosses the celestial equator on the equinoxes at the 23½° angle of Earth’s tilt. This means that around that time, the Sun’s position relative to the celestial equator — which determines its path through the sky — changes rapidly from one day to the next. In contrast, if you look near either solstice, you’ll see that there is a period of a couple months during which the Sun remains very nearly at the same north or south position relative to the celestial equator (though still moving eastward relative to the stars day by day), which means the Sun’s path barely changes during this period.
You’ve probably noticed that around the times of the solstices, the days seem to stay long (in summer) or short (in winter) for many weeks. In contrast, around the times of the equinoxes, the days seem to get rapidly longer from one week to the next in spring, and rapidly shorter in fall. We won’t spend much time on this fact, but you should pay attention to it during your school year.
Activity
Hours of Daylight
This activity uses an online tool that allows you to see how the length of daylight changes over the course of each year.
- Open the tool at www.timeanddate.com/sun, then type your location into the search box for it. You should then see a screen that shows the amount of daylight (and sunrise and sunset times) for today at the top, and below that a “sun graph” for your location.
- On the “sun graph,” click the option at the right to view “daylight length.” Then notice how you can use the “sun graph” to find the amount of daylight for each day of the year. What are the shortest and longest amounts of daylight for your location?
- Can you see how the amount of daylight changes rapidly around the equinoxes, but remains fairly steady around the solstices? Explain.
- Repeat this for a few other locations, and notice how the amount of daylight depends on latitude.
Teacher Notes. This is an optional activity that will help students understand how daylight changes over the course of the year.
(1) If students follow the instructions, they should see a graph that shows how the length of daylight varies over the course of the year for their location; be sure to click the “daylight length” option at the right of the graph. For example, here is a screenshot of what you will see, including the graph, for Boulder, CO (latitude 40°N):
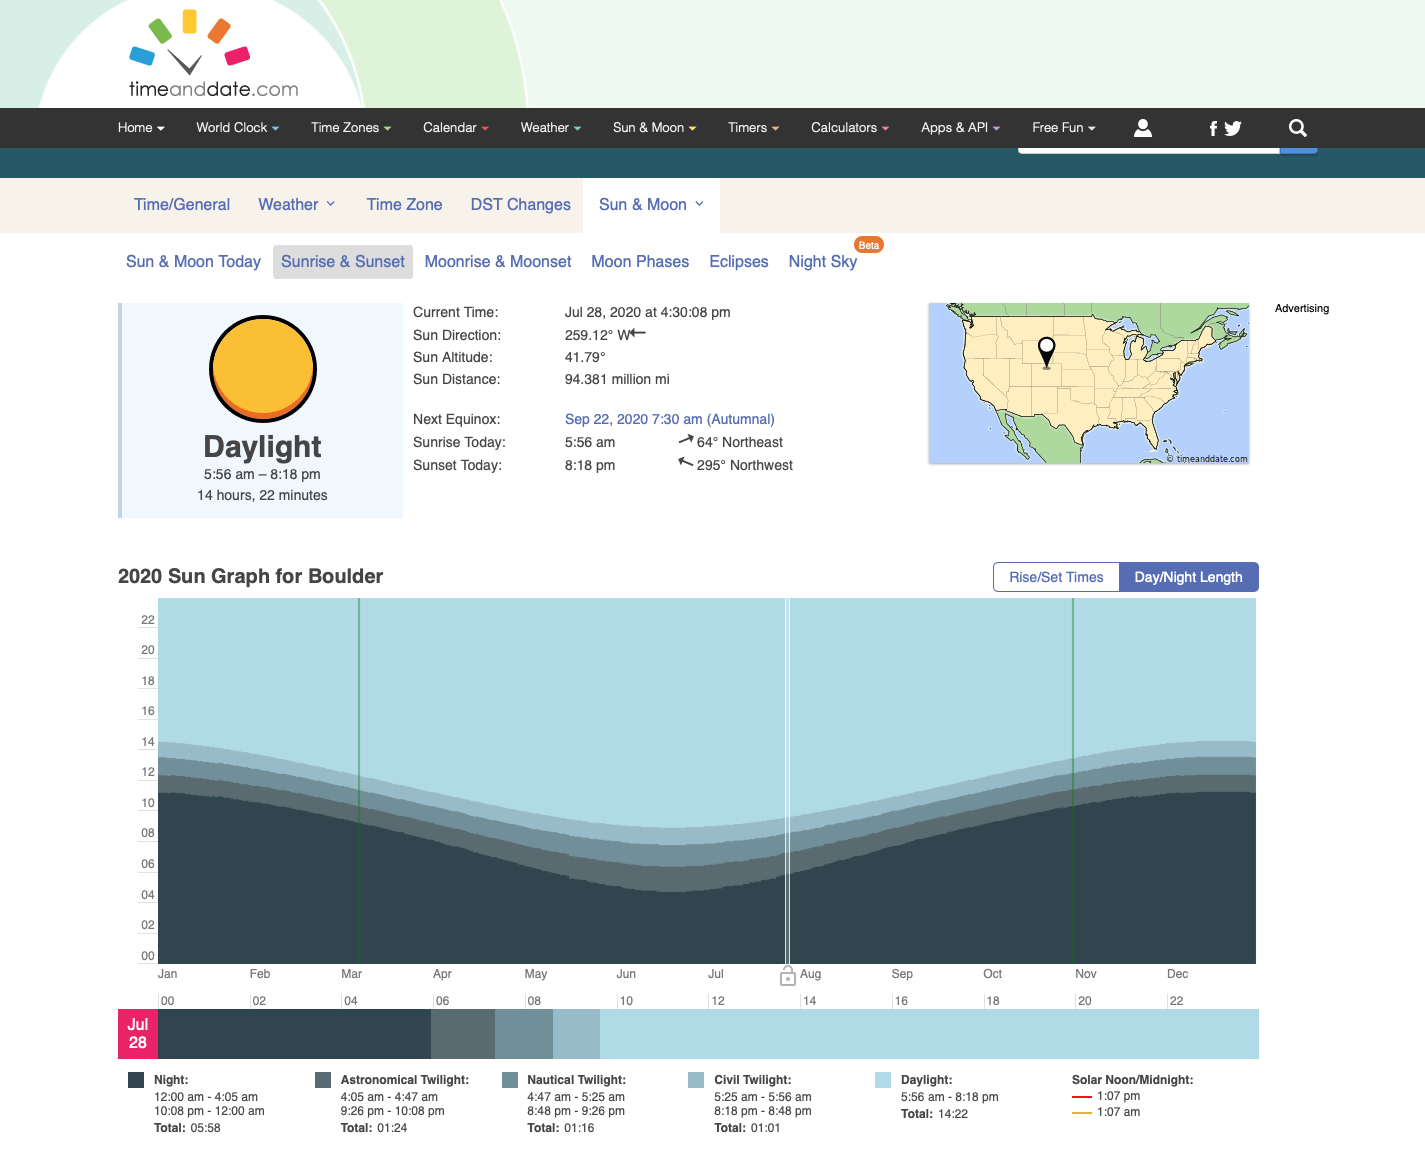
(2) Notice that the light blue (second box from right under the graph) shows the length of daylight. Students can then see how this varies over the course of the year, and should be able to slide the cursor to find the minimum and maximum daylight length.
(3) The graph slopes the most — meaning the greatest day-to-day changes in daylight — around the equinoxes. It slopes the least, meaning nearly steady length of daylight, from about mid-May to mid-July, and again from about mid-November to mid-January, which is around the solstices. Students can confirm this by looking at the readout for daylight under the graph as they move the cursor.
(4) Studying other locations should help students recognize that latitude is the key variable, which will help prepare students for the next section in which we discuss how seasons differ around the world. For example, if you pick a location within the Arctic Circle, you’ll see the continuous daylight around the time of the June solstice.