This is a short subsection, because we already covered the basics of the water cycle in Chapter 4. However, it is a very important topic both in of itself and for the rest of this chapter, so it is useful to review the cycle before we move on. Note that we also introduce some more vocabulary that will be useful to students as we discuss weather and climate.
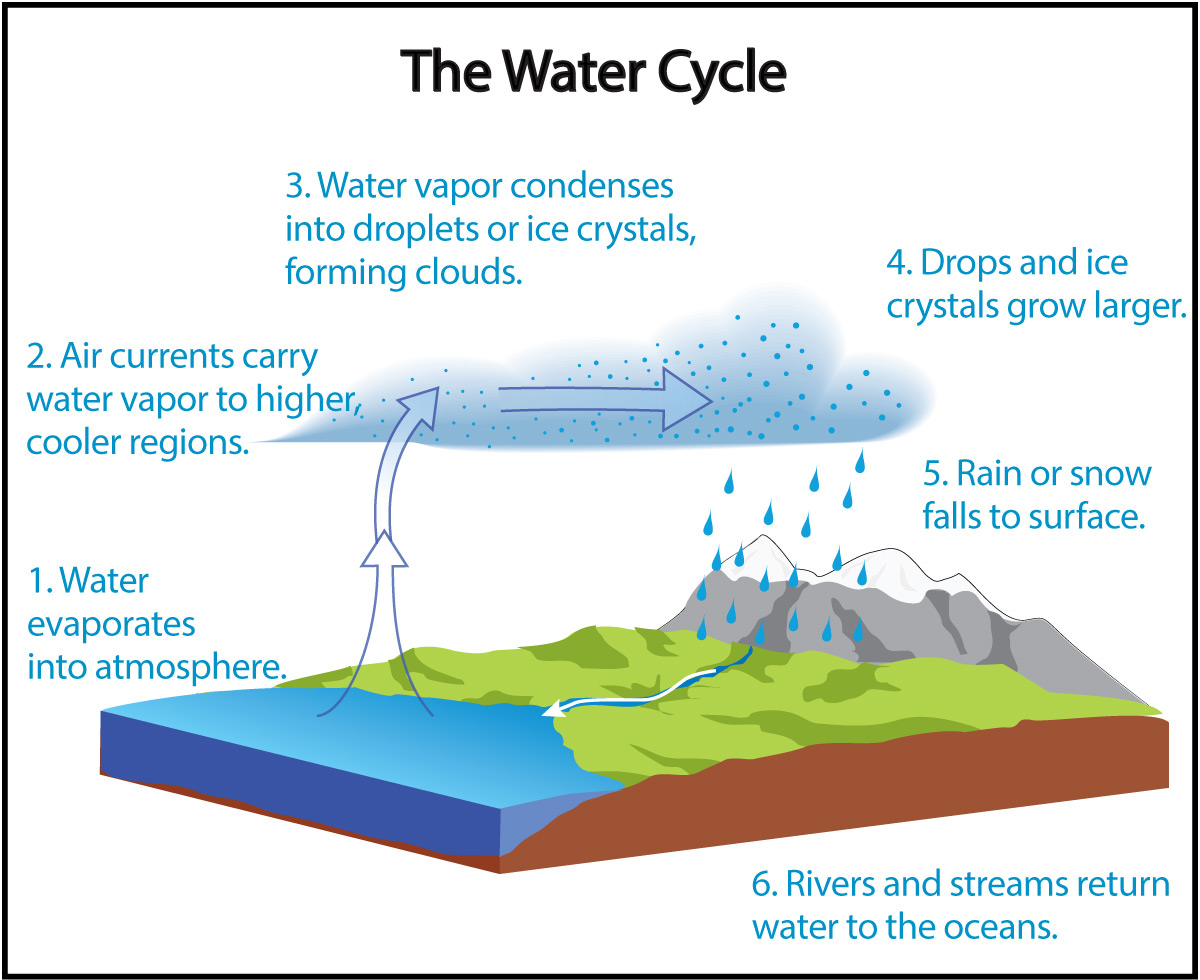
We’ve now covered the basics of our atmosphere and hydrosphere, including how water is distributed in the hydrosphere. We are therefore ready to revisit the water cycle that we introduced in Section 4.2.2. Figure 6.1.3–1 repeats the water cycle figure shown earlier (Figure 4.39). Before you continue, use the quiz that follows to review the drivers of the water cycle.
Quiz – The Water Cycle
Answer the following questions based on what you’ve learned previously about the water cycle.
Note: As always, after you finish the quiz, be sure you read the feedback that explains the correct answers, to make sure you understand the reasons for these answers.
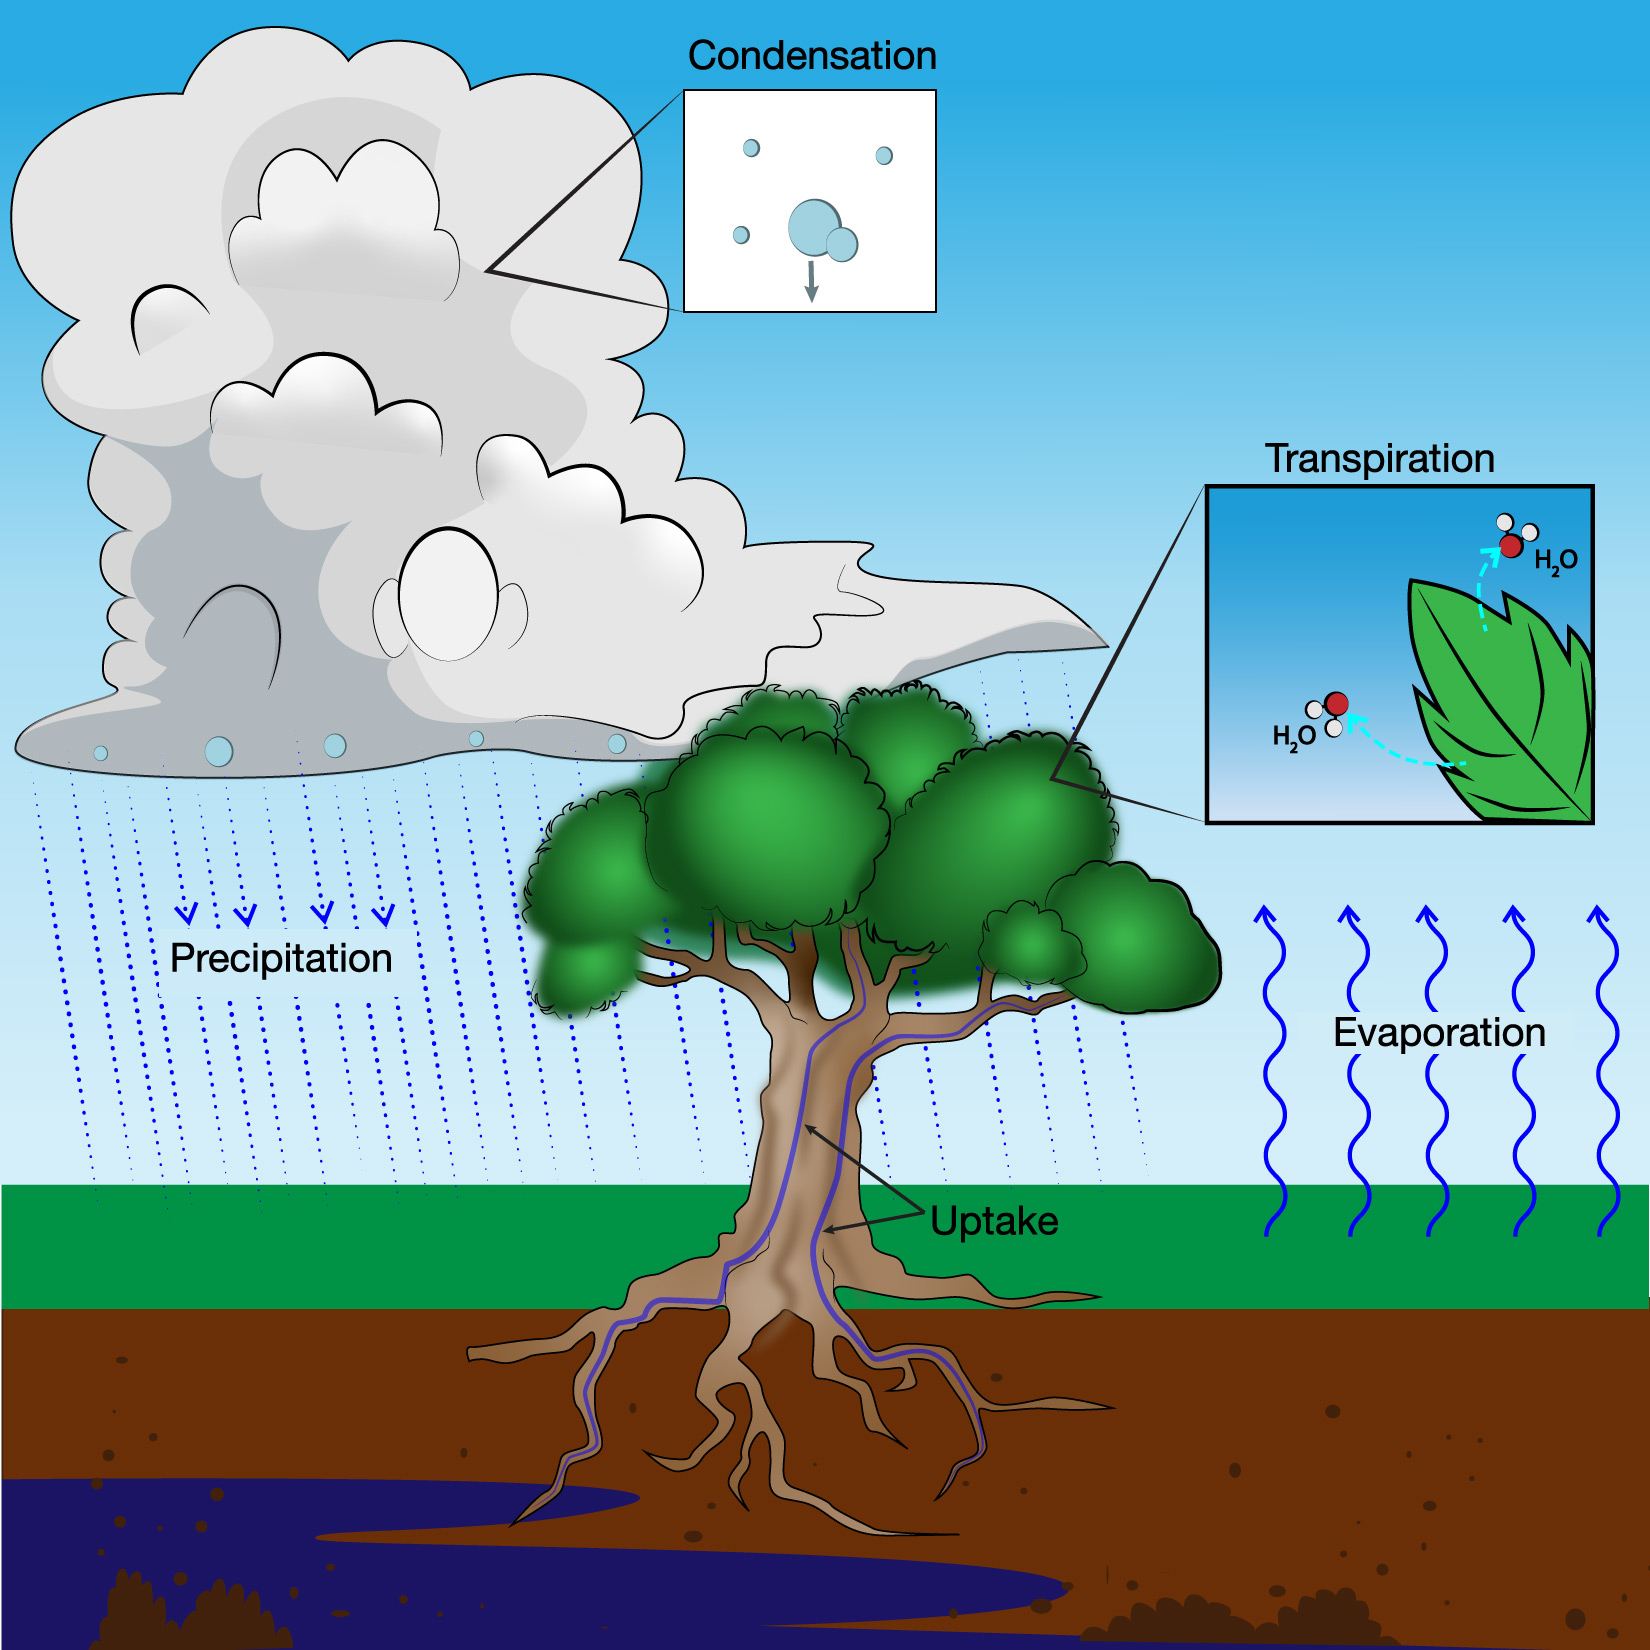
You probably recognize that Figure 6.1.3–1 shows a very simplified version of the water cycle. For example, the figure focuses on how water in its various forms (frozen, liquid, vapor) cycles between the hydrosphere and atmosphere. However, the water cycle is also linked to the biosphere, since life requires water, and the geosphere, since water flows along landscapes and underground. To help you understand some of the additional details of the water cycle, it will be useful to introduce a few more vocabulary terms.
- condensation : This is the process that forms raindrops or ice crystals (such a snowflakes) as water vapor condenses into liquid or solid form.
- precipitation : In talking about weather, precipitation refers to any water that falls to the ground from the skies , which usually means rain or snow (but can also be sleet or hail , which we’ll discuss in Section 6.3.1).
- plant uptake : Much of the water (rain or snow) that falls on land is eventually absorbed by plants. We call the process uptake, because plants use their roots to take this water up from the ground.
- transpiration : Some of the water that plants uptake is used for growth or metabolism, but most of the water simply rises up through the plant and is ultimately released into the atmosphere from its leaves. To distinguish the water that is released by plants from water that simply evaporates from the ground (without first entering a plant), we give this process its own name: transpiration. In other words, transpiration and evaporation both return water to the atmosphere .
Figure 6.1.3–2 summarizes this vocabulary.
These new terms all represent processes that are part of the water cycle, although they are not shown in the basic diagram of the water cycle in Figure 6.1.3–1. (The activity below shows how they can be incorporated into a more detailed diagram.) Our basic figure also leaves out a few other ideas we’ve discussed, such as the existence of groundwater and the way in which water becomes salty. Nevertheless, you should be able to figure out where these processes and ideas would go in the diagram. Use the following questions to check that you can do this.
Discuss the following questions with a classmate. Then click to open the answers to see if they agree with what you came up with.
- Which step(s) in the water cycle of Figure 6.1.3–1 represent condensation?
Steps 3 and 4. Water begins to condense to make droplets or ice crystals in Step 3, and condensation continues as the droplets or crystals grow larger in Step 4.
- Figure 6.1.3–1 shows evaporation occurring over the ocean. Where else does evaporation occur?
Evaporation can occur anywhere on Earth’s surface, whether it is on the land or ocean.
- Figure 6.1.3–1 does not show plant uptake or transpiration. If we wanted to add them, where would they go?
Plant uptake and transpiration both go on land, since that is where most plants live. (We are not considering sea plants here.) In fact, we find plants — and therefore uptake and transpiration — almost everywhere on land, though there is much more in some places (like rainforests) than others (like deserts).
- Figure 6.1.3–1 does not show groundwater. If we wanted to add that, where would it go, and how should we show it?
Groundwater would be shown just beneath the land surface. It would slope downward with the land, so that groundwater would ultimately enter the oceans (often after first feeding into rivers or streams).
- Which step(s) in in the water cycle of Figure 6.1.3–1 contribute to the saltiness of water in the oceans?
Steps 5 and 6. The rainfall and snowfall of Step 5 contributes to weathering of rock, which breaks down the rock into particles that include salts. The flow of rivers and streams in Step 6 causes additional weathering and transports the salts to the ocean.
If you continue to study Earth science, you will learn much more about the water cycle. Indeed, scientists are still learning about it, particularly as we get more and better data from satellite measurements. Video 6.1.3–3 shows some of these additional details, and also reviews key ideas you’ve already learned.
Video 6.1.3–3 - This NASA video summarizes key ideas we’ve discussed about the water cycle, while adding new ideas that you may learn more about in the future. Credit: NASA.
Activity
The Water Cycle in More Detail
This activity will help you understand some of the additional details of the water cycle that go beyond those shown in Figure 6.1.3–1.
- Working in small groups or as a class, make a list of “details” of the water cycle that might be added to a more complete illustration of it. List as many of these “details” as you can think of.
- The United States Geological Survey (USGS) has created two posters to illustrate additional detail in the water cycle. One version is aimed at kids (click here to see it; there is also an interactive version here). A second version is for adults (click here for the adult version). View both versions of the poster and discuss the additional “details” that they show compared to Figure 6.1.3–1. Then, as a class, discuss the pros and cons of each version and hold a class vote on which version (kids or adults) you prefer.
- Watch Video 6.1.3.–3. Make a list of and briefly discuss the meaning of at least three new ideas that you learn from the video.
- Working individually or in small groups, make your own water cycle poster. You can choose how much detail you want to include, which may be anywhere from the simple level of Figure 6.1.3–1 to the more complete posters from the USGS or even incorporating additional ideas from the NASA video. Be as creative as you wish, and use your artistic skills.
This activity is designed to help students recognize that there is much more they may learn about the water cycle in the future. Note that the last part — making your own water cycle poster – is the most time-consuming, but also gives students a chance to put their artistic talents to work. Notes:
- (1) At minimum, students should cite the additions discussed in the Q&A that follows Figure 6.1.3–2. Beyond that, the number of these ideas that students come up with will depend on their background knowledge. You can look ahead at the water cycle posters in question 2 for ideas for this list.
- (2) These posters both have a lot of detail. The goal of this question is simply for students to explore the posters, using the class vote at the end as way of making sure they have discussed the posters and can voice an opinion as to which version they prefer.
- (3) Some of the ideas that students may wish to discuss are: the idea of atmospheric rivers; differential evaporation in different parts of the ocean; warmer air can hold more water; the role of storms in heat transfer; and the role of satellite data in understanding the water cycle.
- (4) This should be fun for those students who choose to make their own poster. As usual, look for accuracy and creativity. Ask students to justify the level of detail they include. If you get particularly good posters, consider hanging them on your classroom walls.