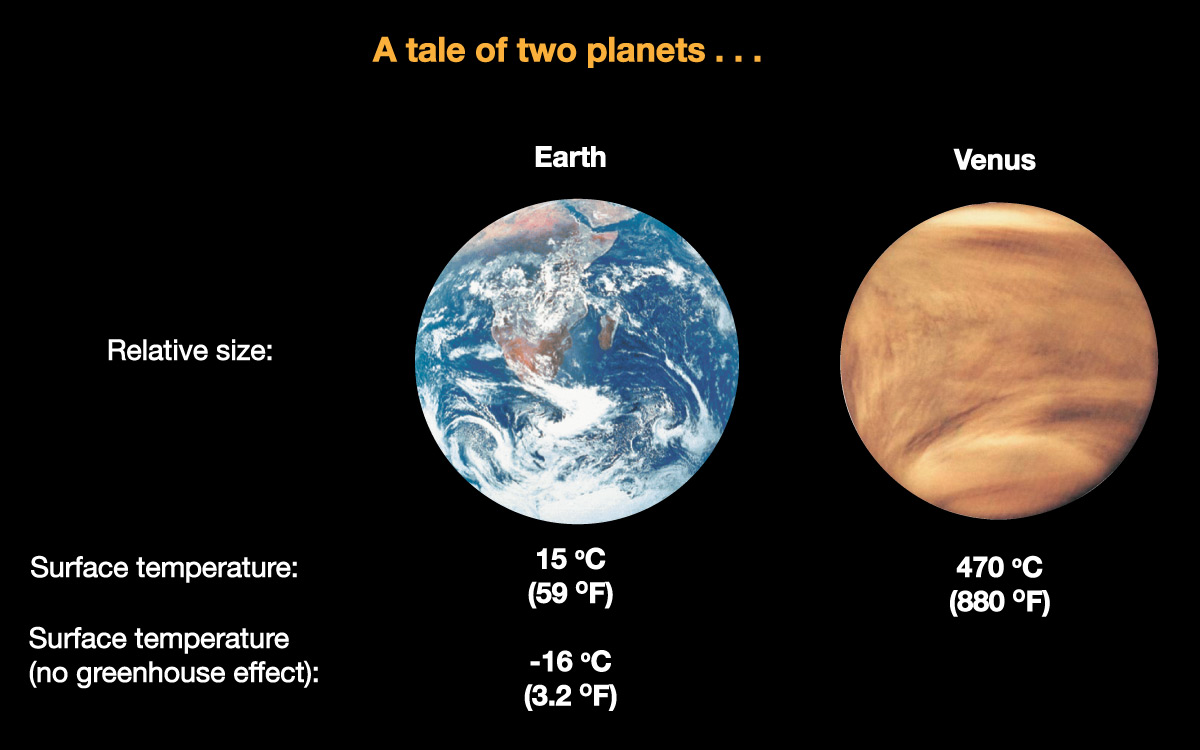
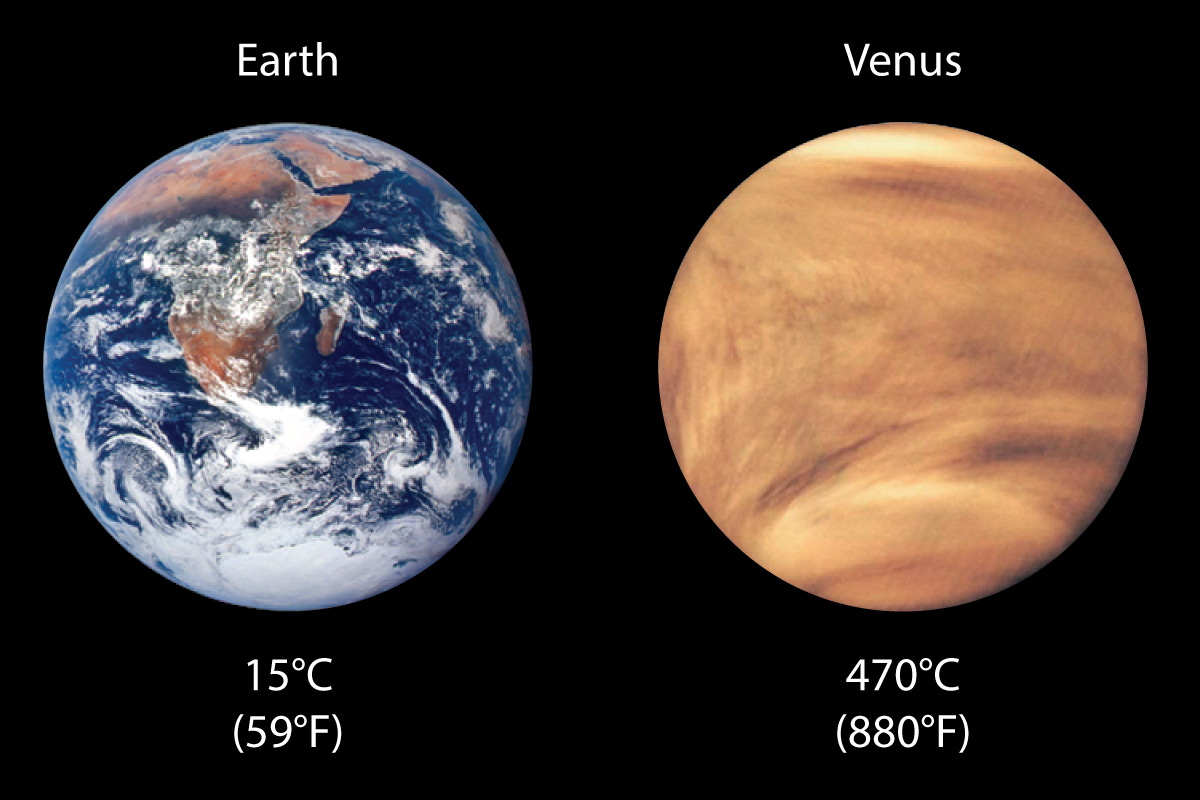
Let’s quickly review what we’ve discussed so far. We know from our “tale of two planets” (Venus and Earth) that carbon dioxide and other greenhouse gases really do make planets warmer than they would be otherwise. We also know that human activity is increasing the concentration of carbon dioxide (and other greenhouse gases) in Earth’s atmosphere.
If you put those two ideas together, it’s pretty obvious that we should expect our actions to be causing the world to get warmer, and data show that this is indeed happening. Let’s briefly investigate how we can be confident that global warming really is happening and really is human-caused.
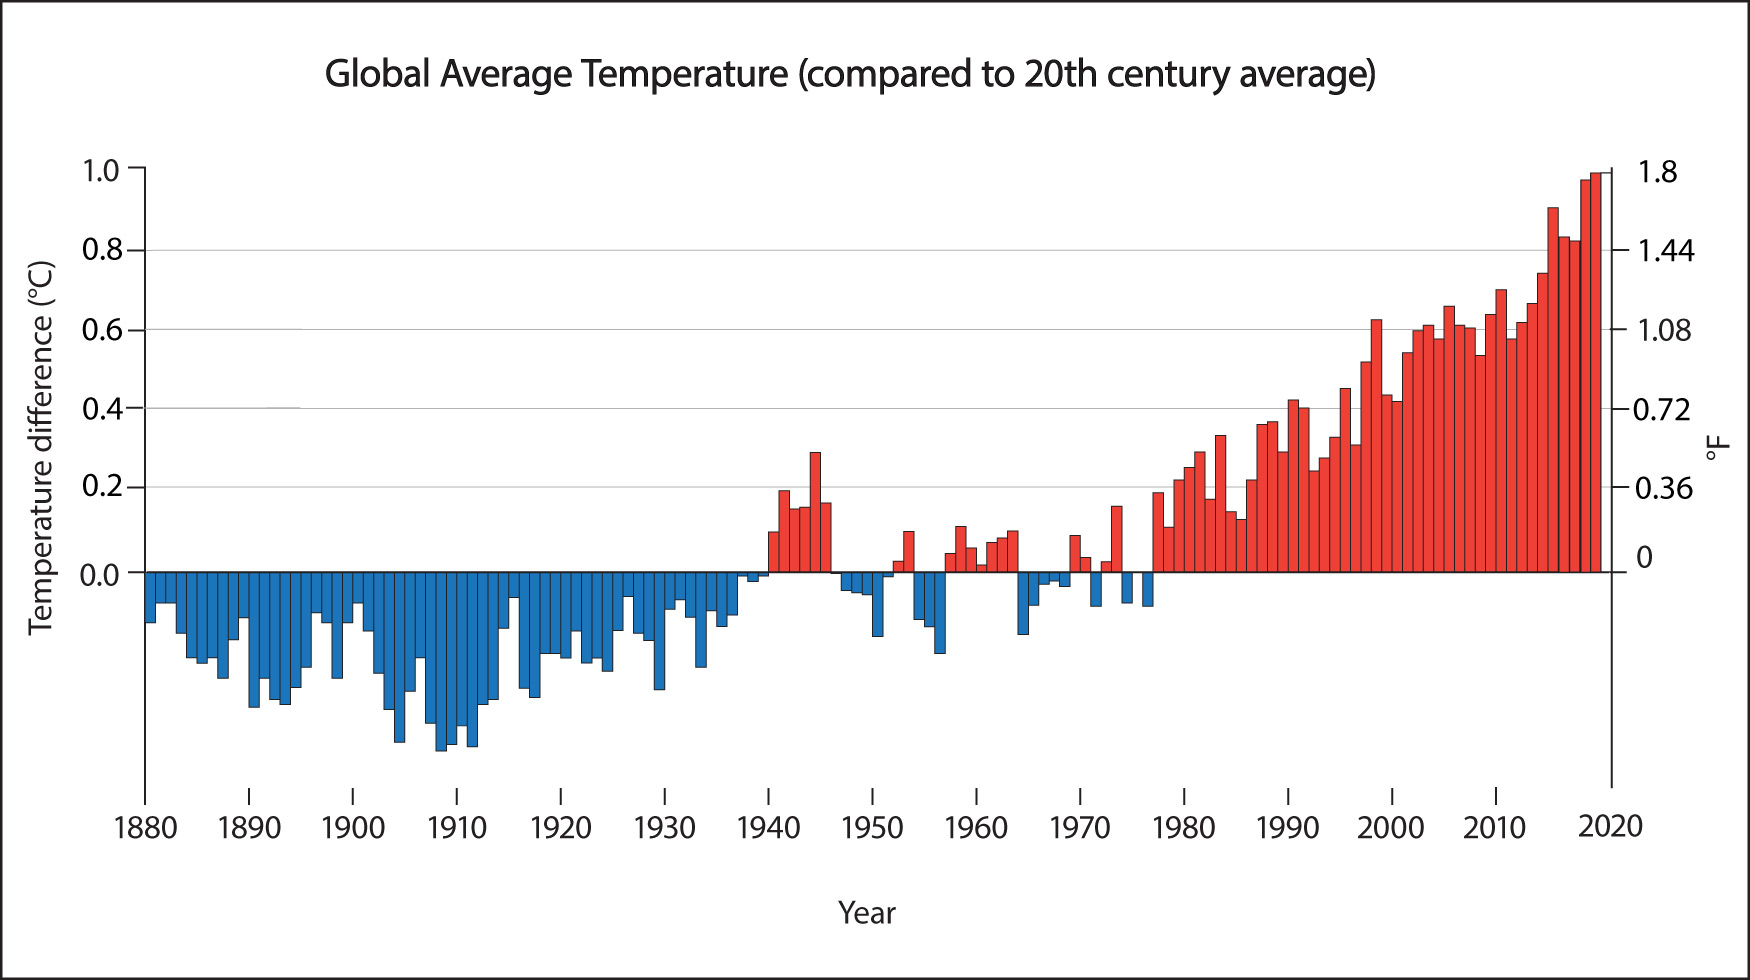
Data Confirm that Warming is Occurring as Expected
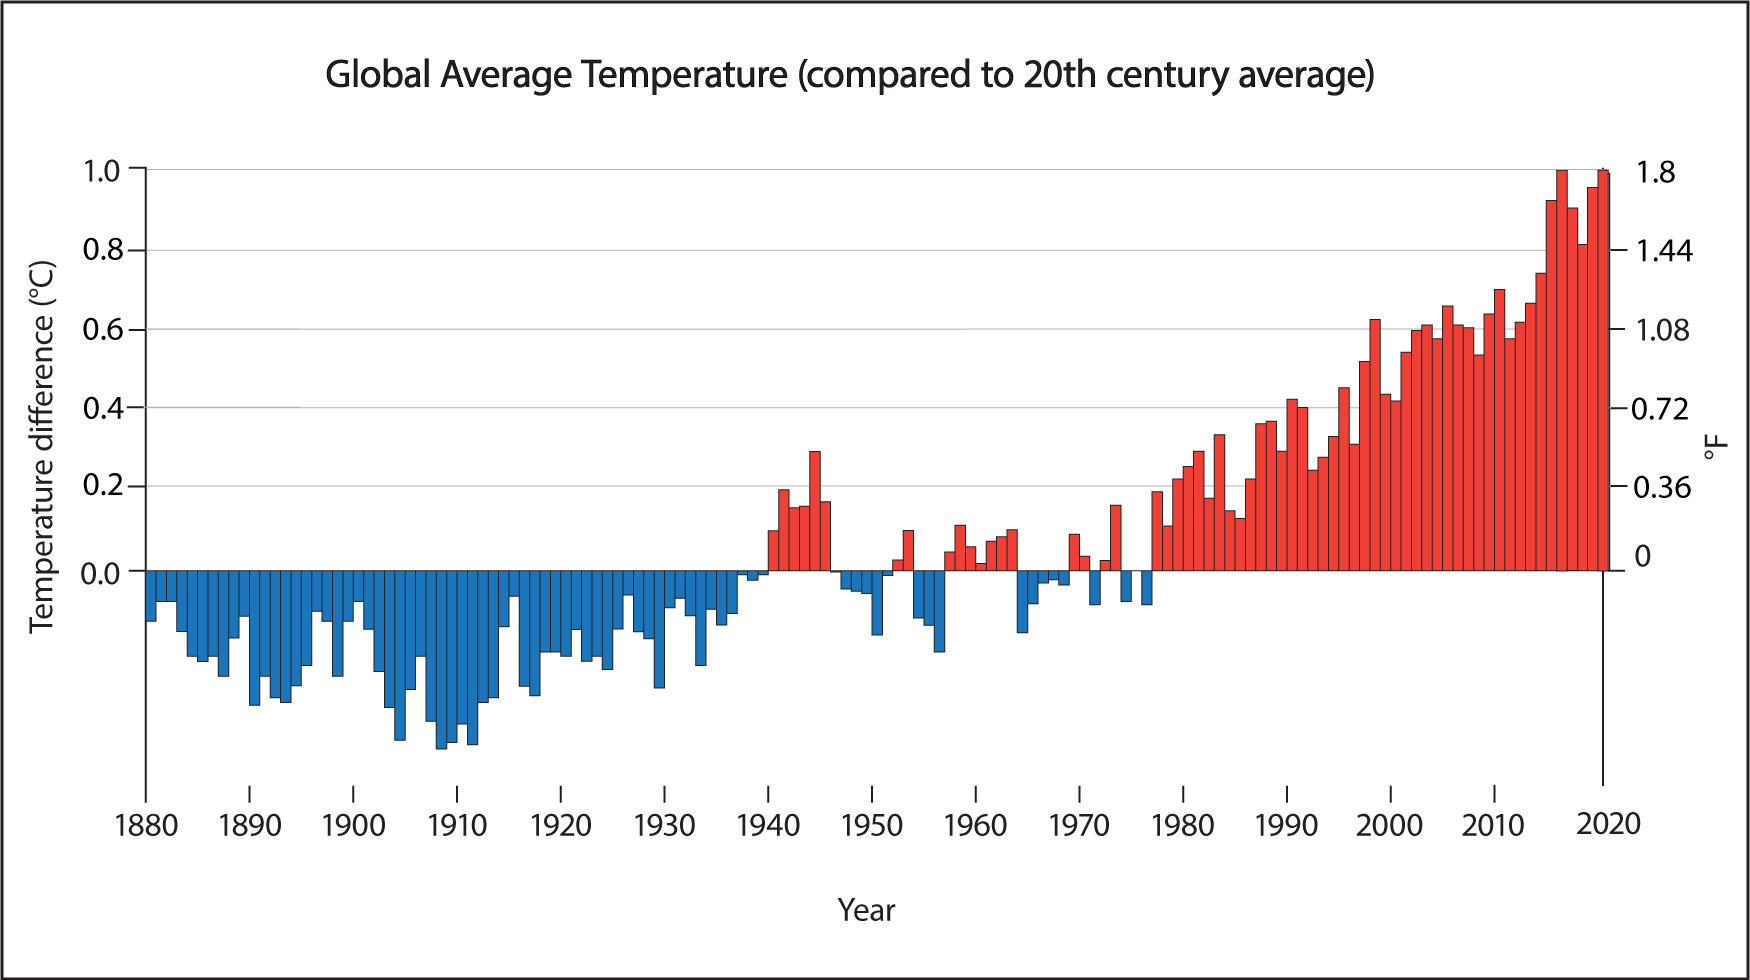
Figure 7.1.3–1 shows how Earth’s global average temperature has changed since 1880, which is as far back as scientists have reliable measurements of this temperature. As you can see, global warming is clearly happening, just as we expect that it should as a result of human activity.
Figure 7.1.3-1 does not show uncertainty bars, because we consider that above the level of middle school. But in case you are wondering about the uncertainties in the global average temperature data, here is what you need to know:
First, let’s review what “uncertainties” mean in data science: Scientists generally state an uncertainty (often referred to as a “margin of error”) in terms of some level of confidence, and the most common level used is “95% confidence” (which you may hear scientists refer to as “two sigma,” since it reflects two standard deviations on a normal distribution). For example, if a measurement is stated as “0.8°C with an uncertainty of 0.1°C” (written as 0.8°C ± 0.1°C), it means that with 95% confidence we can assume that the true value is between 0.7°C and 0.9°C. Note that these uncertainty statements are not mere guesswork; they are based on statistical analysis of the data and the potential sources of error in the measurements.
As you might expect, the uncertainties in global average temperature measurements are greater for times further in the past, because they were fewer weather stations at those times. Indeed, the reason that the data begin in 1880 is because prior to that, the uncertainties are nearly as large as the measurements, which means we cannot rely on them at all.
Overall, the uncertainties for the measurements shown in Figure 7.1.3-1 are approximately as follows:
- For the early years (e.g., 1880–1900), the uncertainty in the measurements (with 95
%confidence) is about 0.1°C. For example, the bar for 1885 shows –0.2°C, so the true value (with 95% confidence) was between –0.3°C and –0.1°C. - The uncertainty becomes smaller as time goes on, and for recent decades (since about 1980) is down to about 0.03°C. For example, the bar for 2015 shows a value of 0.90°C, so the true value (with 95
%confidence) was between 0.87°C and 0.93°C.
If you would like more detailed discussion of the uncertainties, visit the web site for the GISS (Goddard Institute for Space Studies) Surface Temperature Analysis. You’ll also find an excellent (but higher level) discussion of the measurements and uncertainties in this scientific paper: J. Hansen et al., “Global Surface Temperature Change,” Rev. Geophys. 48, RG4004 (2010).
Quiz – Reading the Global Temperature Graph
Answer the following questions to make sure you understand how to read the data shown in Figure 7.1.3–1.
Note: As always, after you finish the quiz, be sure you read the feedback that explains the correct answers, to make sure you understand the reasons for these answers.
There are No Other Plausible Explanations for the Warming
The data in Figure 7.1.3–1 show that Earth is warming just as we expect it should due to increasing greenhouse gas concentrations. Still, scientific work must be very thorough, so before we conclude that human activity is the cause of the current warming, we need to check out other possibilities. Scientists have done that, and as we’ll see here, there is nothing else that could explain the current warming.
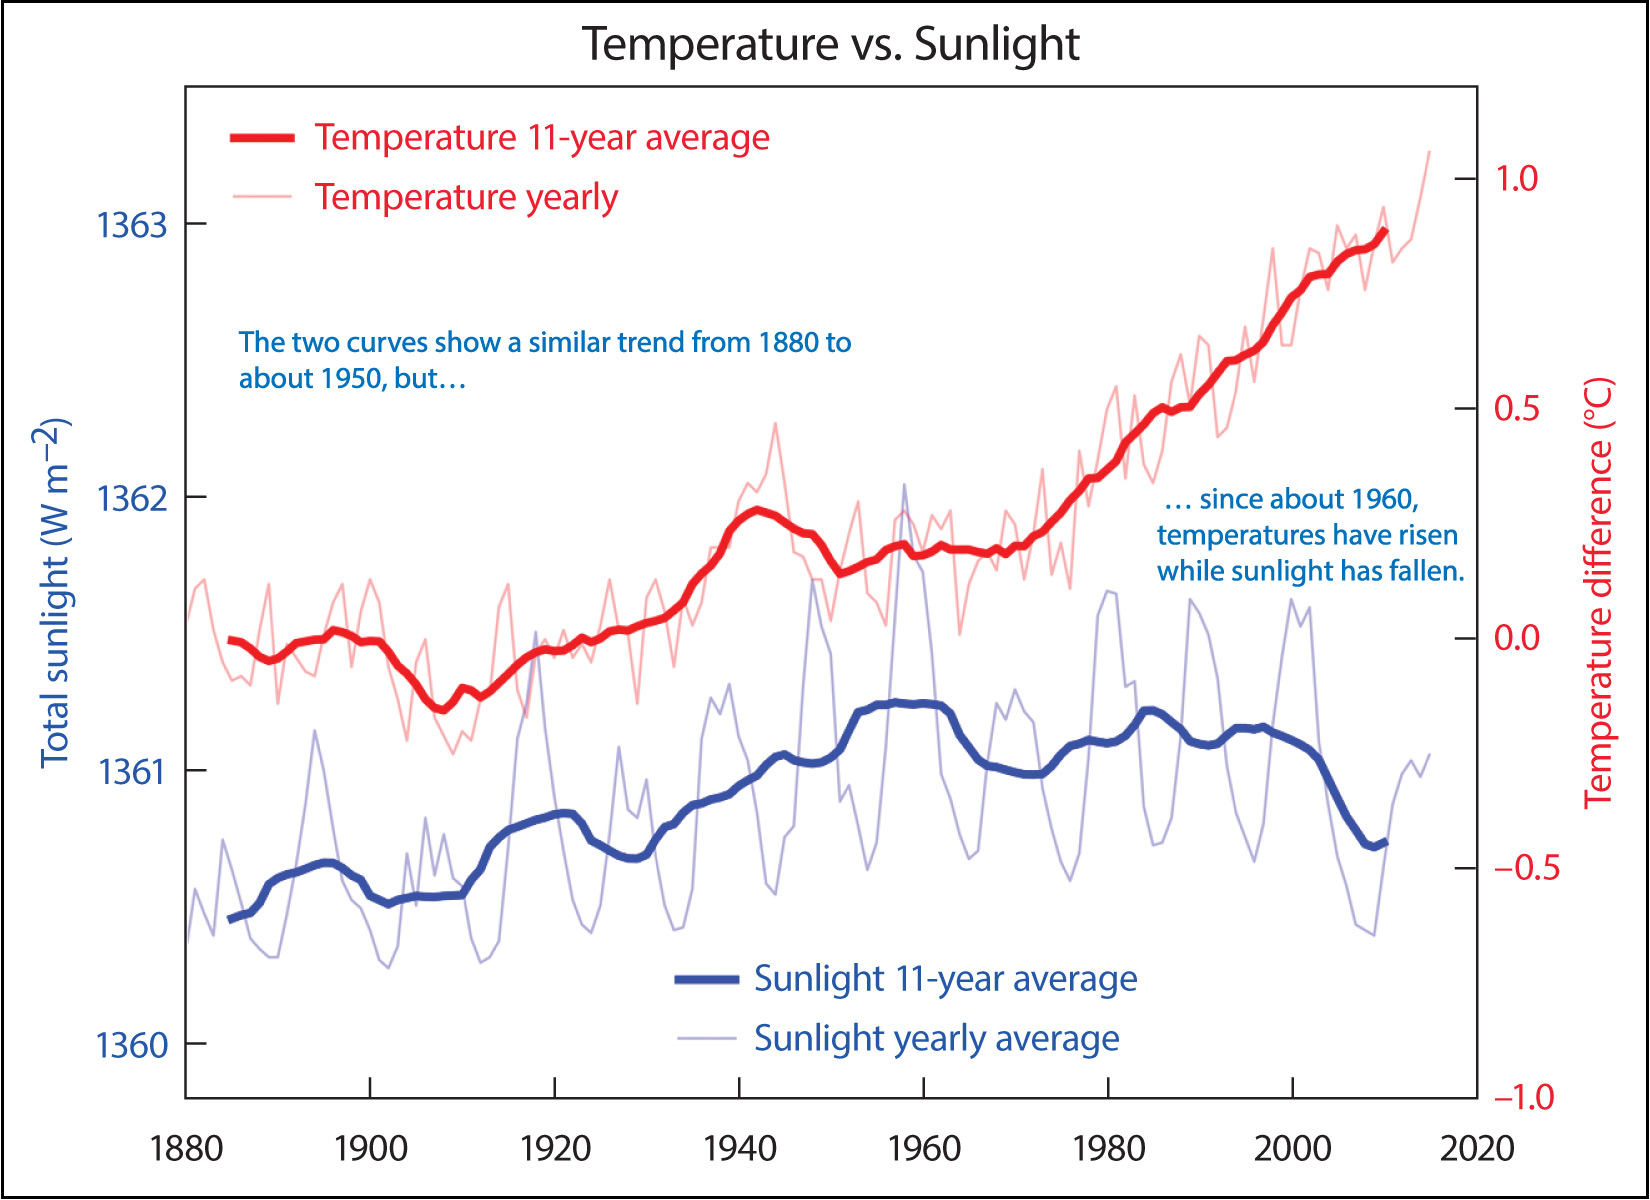
If you think about sources of energy for Earth, there’s really only one other possible explanation for a warming world: the Sun. If the Sun were becoming even slightly brighter, then it could be a cause of rising temperatures. Scientists can measure the amount of energy reaching Earth from the Sun, and Figure 7.1.3–2 shows this data along with the data for Earth’s global average temperature since 1880. Notice that the amount of sunlight reaching Earth does indeed change by small amounts over time. However, in recent decades the amount of sunlight has actually been going slightly down, not up, which means the Sun cannot be the cause of recent warming.
In fact, there are several other ways in which scientists know that the Sun cannot be responsible for the recent warming. For example:
- If the Sun were responsible for global warming, we would expect the extra sunlight reaching Earth to warm the surface and the entire atmosphere. In contrast, more detailed analysis of the greenhouse effect shows that while it predicts warming of the surface, oceans, and lower atmosphere, it should cause cooling in the upper atmosphere (the stratosphere and above).
Measurements show that Earth’s upper atmosphere has in fact been cooling even while the surface warms, which is what we expect for the greenhouse effect but would make no sense if global warming were being caused by the Sun.
- If the Sun were responsible for global warming, we would expect daytime to warm as much or more than night time. In contrast, detailed analysis of the greenhouse effect predicts that nights should warm more than days.
Measurements show that nights have indeed warmed more than days, which is consistent with the greenhouse effect as the cause of global warming, but not with the Sun. - If the Sun were responsible for global warming, we would expect summer to warm as much or more than winter. In contrast, detailed analysis of the greenhouse effect predicts that winter should warm more than summer.
Measurements show that winter has warmed more than summer, again as expected if the warming is caused by the greenhouse effect, but not if warming were due to the Sun.
Together, these measurements clearly rule out the Sun as a cause of recent warming. Could there be any other natural cause, such as volcanic activity? Scientists can investigate such possibilities with climate models. We’ll discuss how these models work a little later, but Figure 7.1.3–3 shows the key result: Climate models that include only natural factors cannot explain the warming, but models that also include human factors can.
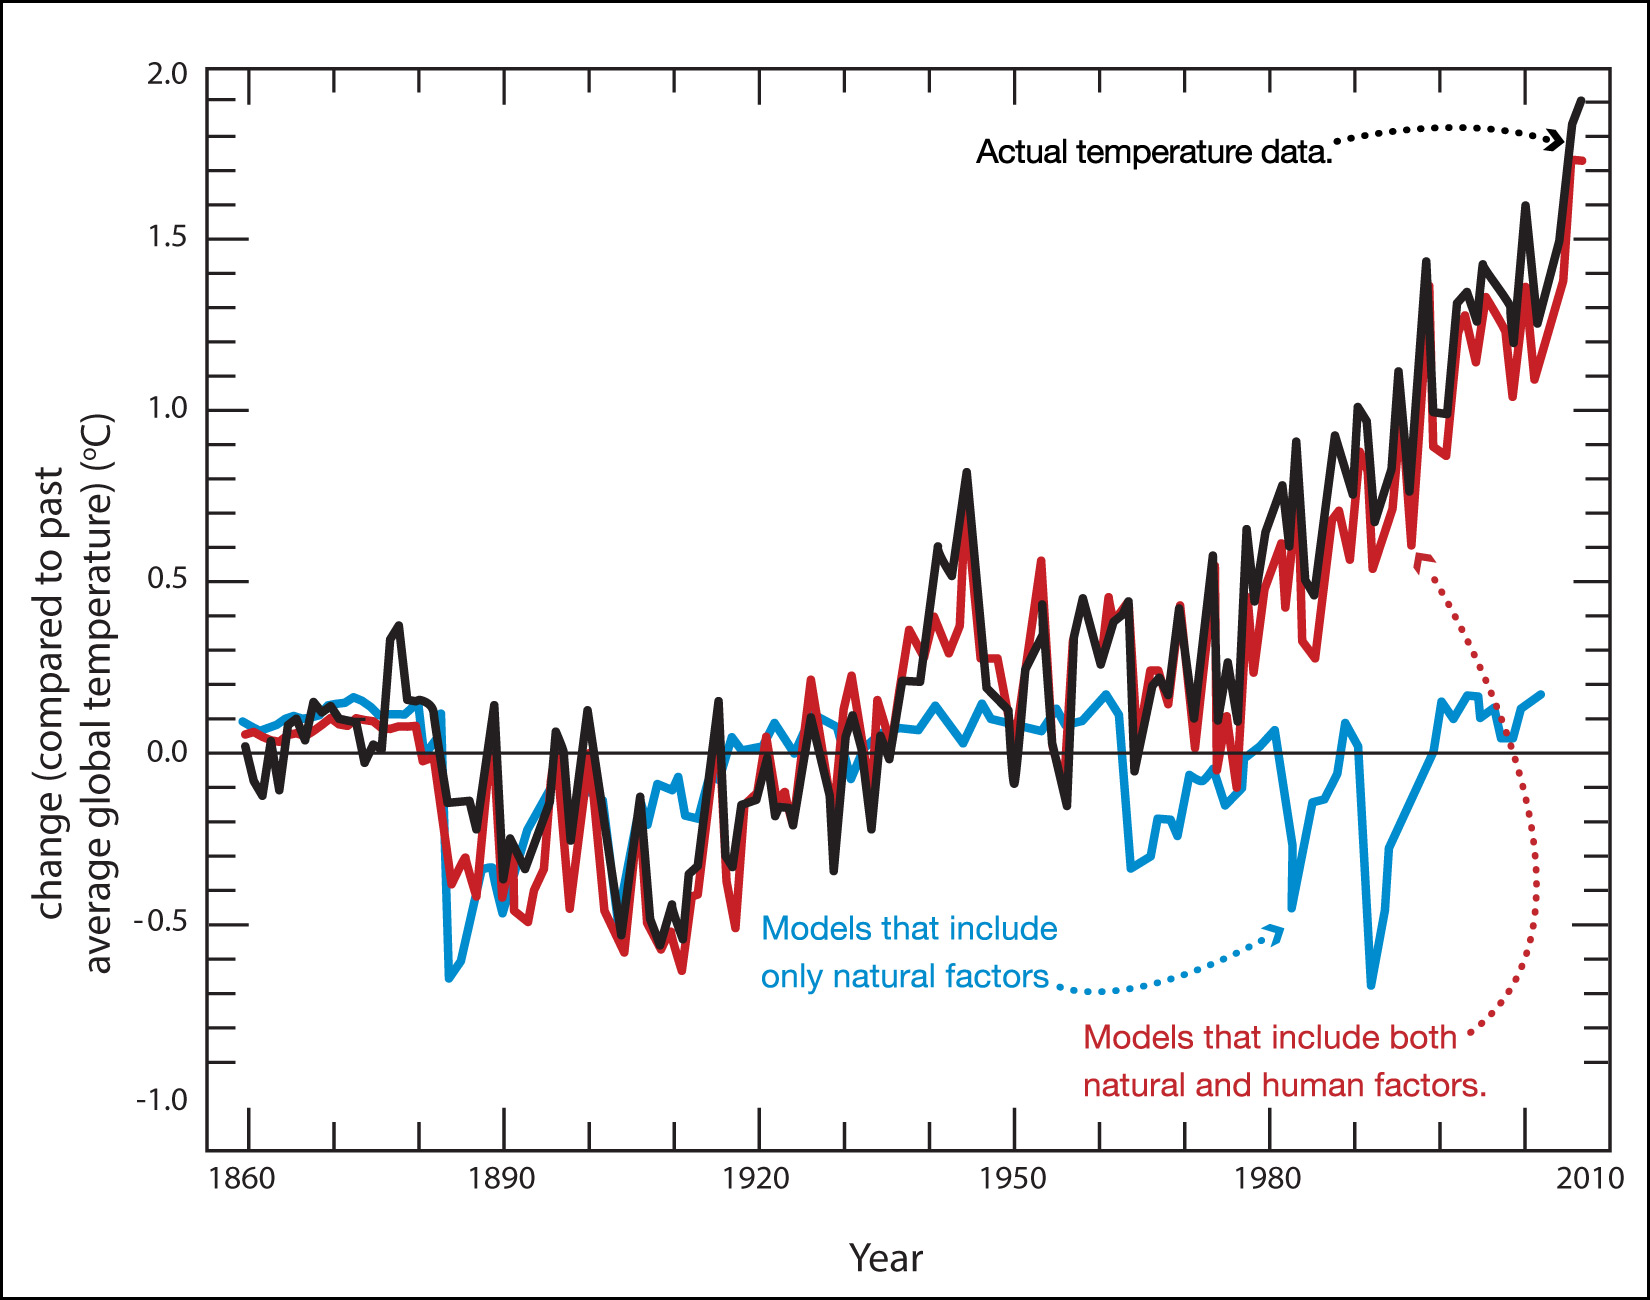
Note: Bloomberg Business created an outstanding animated version of this graph, which you can see here.
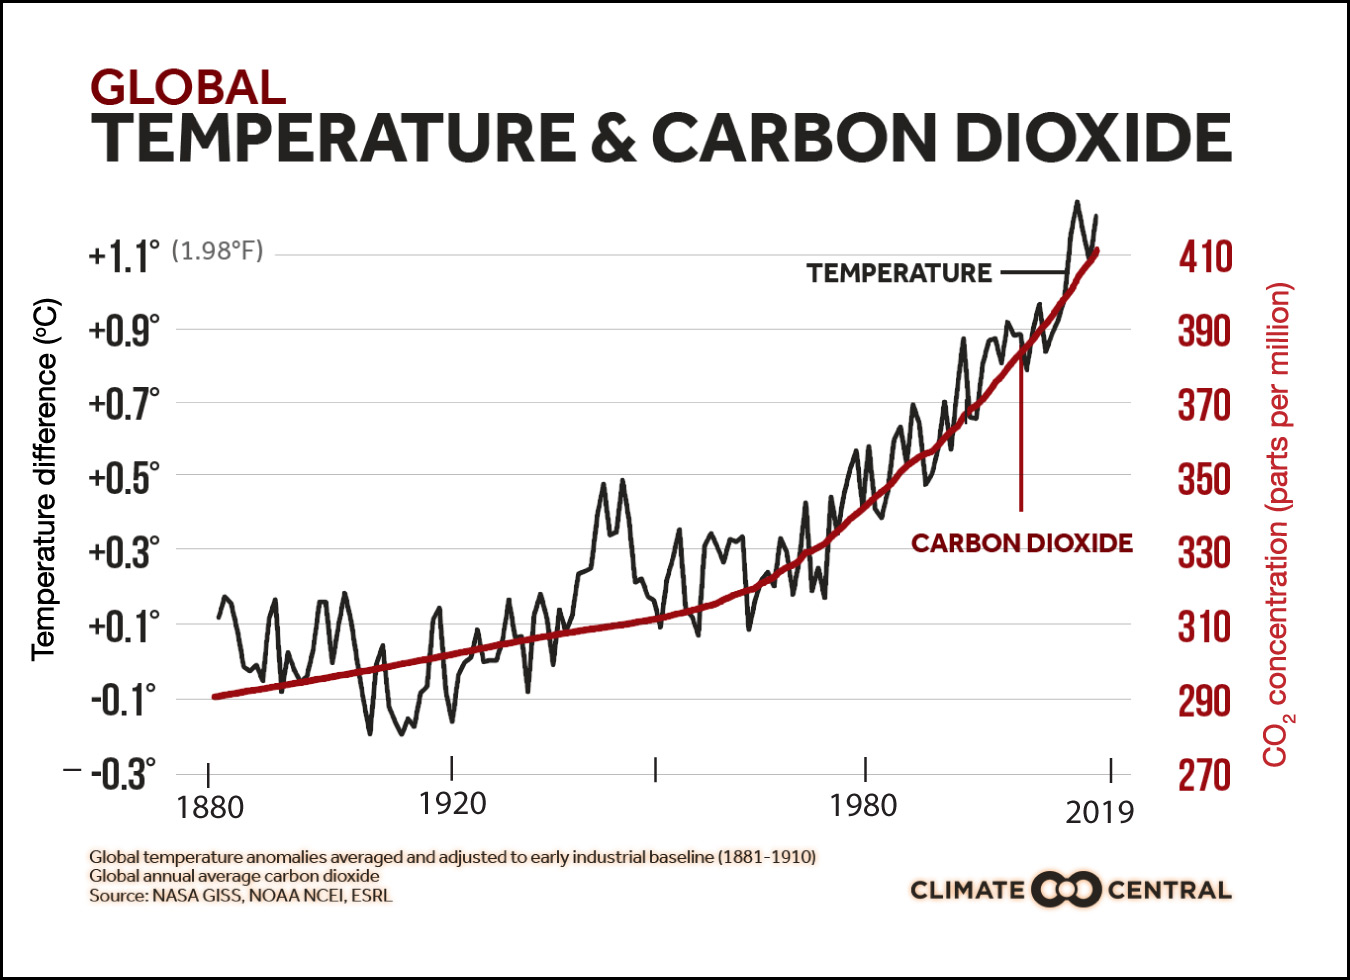
To summarize, we’ve found that there are no natural factors that can explain recent global warming, but that this warming makes perfect sense as a consequence of the strengthening greenhouse effect that is being caused by human activity, especially by the rise in carbon dioxide concentration. Figure 7.1.3–4 shows how well the carbon dioxide trend matches up with the warming trend.
Claim-Evidence-Reasoning Activity
The Cause of Global Warming
Suppose you hear someone make the following claim:
Claim: Human activity might be part of the reason for recent global warming, but most of the warming is natural, not human-caused.
Use evidence and reasoning to either support or refute this claim.
This CER activity focuses on what is, in fact, a common claim made by many so-called “skeptics” of global warming. But as students should now recognize, there is simply no evidence at all that can support this claim, and abundant evidence that refutes it. Based on the above discussion, their evidence and reasoning should include:
- There is no evidence at all that would suggest any impact from natural factors. We’ve shown several lines of evidence that rule out the Sun, and the models are consistent only with greenhouse warming as the cause, not with any significant effect from natural factors.
- We saw several detailed predictions of the greenhouse effect that ARE consistent with that as the cause of the current warming (such as the upper atmospheric cooling and the fact that nights and winters are warming more than days and summers). We also saw that this strengthened greenhouse effect matches well with the rising carbon dioxide concentration.
- From the prior section, students should be able to cite how we know that the rising carbon dioxide concentration is essentially 100% due to human activity, especially the burning of fossil fuels.
- So the bottom line should be very clear: There is no evidence for any natural causes in recent warming, and abundant evidence that it is entirely caused by humans.
- Note: To reinforce these ideas, you might wish to view the Bloomberg animation with your class and discuss it in a little more detail.
Summary: The 1-2-3 Science of Global Warming
We have now completed our discussion of the basic science of global warming, which we can summarize in a simple and easy to remember “1-2-3” format:
1. Fact: Carbon dioxide and other greenhouse gases trap heat and therefore make Earth (or any other world) warmer than it would be otherwise.
How we know: Two strong lines of evidence prove that this is a fact beyond any reasonable scientific doubt: (1) laboratory measurements of the greenhouse effect and (2) the fact that including the greenhouse effect is the only way to successfully predict the temperatures of worlds with atmospheres.
2. Fact: Human activity, especially the use of fossil fuels, has been adding significantly more of these heat-trapping greenhouse gases to Earth’s atmosphere.
How we know: Measurements show that the concentration of carbon dioxide, as well as of other greenhouse gases such as methane, has been rapidly rising. Careful analysis leaves no scientific doubt that human activity, especially the use of fossil fuels, is the source of these added greenhouse gases.
3. Inevitable Conclusion: Given that more greenhouse gas means warmer temperatures and we are adding more greenhouse gases to Earth’s atmosphere, it is inevitable that global warming must occur as a result.
Confirmation: Measurements show that Earth’s global average temperature is indeed increasing, and it is doing so in a way that can be explained only by the greenhouse effect, not by the Sun or other natural factors.
Figure 7.1.3–5 provides a visual summary of this “1-2-3” science of global warming.
Fact: Carbon dioxide and other greenhouse gases trap heat and therefore make Earth (or any other world) warmer than it would be otherwise.
Fact: Human activity, especially the use of fossil fuels, has been adding significantly more of these heat-trapping greenhouse gases to Earth’s atmosphere.
Inevitable Conclusion: Given that more greenhouse gas means warmer temperatures and we are adding more greenhouse gases to Earth’s atmosphere, it is inevitable that global warming must occur as a result.
Figure 7.1.3–5 – This illustration summarizes the “1-2-3” science of global warming.
Key Concepts: The Cause of Global Warming.
Earth’s climate is quite complex in its details, but the basic science of global warming is as “simple as 1-2-3”: (1) greenhouse gases make planets like Earth warmer than they would be otherwise; (2) the burning of fossil fuels and other human activities are increasing the concentration of greenhouse gases; (3) and therefore it is inevitable that global warming must occur as a result. This 1-2-3 science is supported by overwhelming evidence, leaving no reasonable scientific doubt that humans are the cause of the current global warming. And, because we are the cause, any solution to the problem of global warming requires changes in human activity, particularly with regard to the use of fossil fuels.
Claim-Evidence-Reasoning Activity
How can global warming be so simple when climate is so complex?
You know from Chapter 6 that Earth’s climate is quite complex in its details. This makes many people wonder how it is possible for the basic science of global warming to be so simple in comparison. The answer has to do with the way averages work. Climate is complex when you look at any individual location on Earth, but it becomes much simpler when you average all locations together, which is essentially what we are doing when we focus on the global average temperature. In this activity, we’ll use coin tossing to help you understand this concept.
- Your teacher will toss a coin, but first: Each student should write down a guess about whether the coin will land heads or tails. After your teacher tosses the coin, figure out what percentage of the students guessed correctly. Repeat this several times. What do you notice about the predictability of a single coin toss?
- You teacher will toss a set of 100 coins. Someone should count how many land heads. Repeat this several times, writing down the result each time. Do you notice any pattern?
- Discuss: Suppose you are offered two options for betting $10:
- Option 1: One coin will be tossed. If it lands heads, you win, if it lands tails, you lose.
- Option 2: 100 coins will be tossed. If between 40 and 60 of them land heads, you win, otherwise, you lose.
Which bet would you choose? Why?
- Discuss your results, then use evidence and reasoning to support the following claim:
Claim: There is no way to predict the result of an individual coin toss, but you can predict the approximate result of 100 coin tosses.
- Discuss: How do the ideas from coin tossing explain why it is much easier to consider the average climate (or temperature) for the whole world than to consider how climate may vary or change locally?
- Come up with a least three more examples that illustrate the general principle that it is easier to predict averages than to predict individual events. Example: If you consider a classroom of 25 kindergartners, it is much easier to predict the average height of all the students than to predict the height of a single student chosen at random.
This activity contains some statistical thinking that is useful in many different circumstances, but is applied here to global warming. Notes:
- (1) Students should quickly recognize (and probably already know) that a single coin toss is unpredictable. About half will guess right and half guess wrong on any single toss.
- (2) Students will see that in most or all cases, the number of heads will be somewhere close to 50 out of the 100 coins. (It will rarely be exactly 50, but will almost always be fairly close, such as between 40 and 60 heads.)
- (3) Option 2 is clearly a better bet, because the 100 coins will almost always (more precisely, about 96.5% of the time) give you between 40 and 60 heads. Note: It may be worth pointing out that this is a fairly narrow range of the possible outcomes, since the range of 40 to 60 (inclusive) is only 21 out of the 101 possible outcomes (it’s 101 because 0 is a possible outcome).
- (4) This claim is true, and students should be able to support it based on the evidence from the coin tossing experiments above.
- (5) The difference between a single coin toss and 100 coin tosses is essentially averaging, so it is analogous to the idea of averaging the climate (or temperatures) globally. That is why it is much easier to predict and understand global warming than local climate effects.
- (6) It should be fairly easy for students to come up with many more examples of the general principle that it is easier to predict averages than to predict individual events.
Journal Entry
Letter to a Skeptic
As we’ve discussed, the basic science of global warming can be understood just by knowing the 1-2-3 science above, and data confirm that global warming is really happening. Nevertheless, surveys show that some people still don’t believe it. You might even have family members or friends who think this way. In your journal, write down a few claims that you’ve heard from people who don’t believe in global warming. For each claim, briefly state whether or not you agree with it, and explain why or why not.
As we’ve noted earlier, the topic of global warming can be challenging because of the substantial number of “skeptics” that are likely to be among students’ family members and friends. (Fyi, recent surveys suggest that about 20% of the American public either does not believe that human-caused global warming is happening or does not believe it is human-caused.) This journal entry allows students a chance to think about the claims they may have heard from these skeptics and to write about how they would respond, without actually asking students to respond and risk any confrontation. If you grade the entries, be sure to focus on how well students explain their reasoning, not on whether they agree or disagree with skeptic claims.