Video 6.3.3–1 - This National Geographic video summarizes a few key ideas about weather. You are already familiar with some of these ideas, and we’ll discuss others (such as air masses and fronts) in this section. Credit: National Geographic.
You’ve probably noticed that adults often greet each other with talk about weather, saying things like “don’t you just love this weather?” or “that was sure a crazy storm.” This should actually seem reasonable, because the ever-changing weather is one of the most important daily factors in how we go about our lives.
The importance of weather to our daily lives also explains why scientists spend so much effort trying to predict the weather. After all, reliable predictions can save property and lives by allowing us to prepare for coming storms. We’ve already discussed most of the concepts we need to think about weather prediction. Here, we’ll put those together so you can understand what you hear and see in weather forecasts. Video 6.3.3–1 (above) summarizes a few key ideas, some of which we have already discussed and some that we will discuss in this section.
Measuring the Weather
Recall that six important characteristics that we use to describe weather include temperature, wind, atmospheric pressure, cloudiness, humidity, and precipitation. We usually describe cloudiness in a qualitative way, such as by describing how much of the sky is cloud-covered and what types of clouds we see. All of the others can be measured quantitatively with devices used in weather stations (Figure 6.3.3–2). Use the following questions to review key ideas about these measurements.
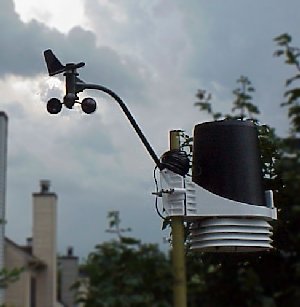
(a) This photo (repeated from Figure 4.26) shows a rooftop weather
station that measures the local temperature, pressure, humidity, wind
speed and direction, and rainfall. The anemometer for measuring
wind is the part hanging to the left, and the large black tube is the rain gauge (compare to part b). Credit: Wikimedia Commons.
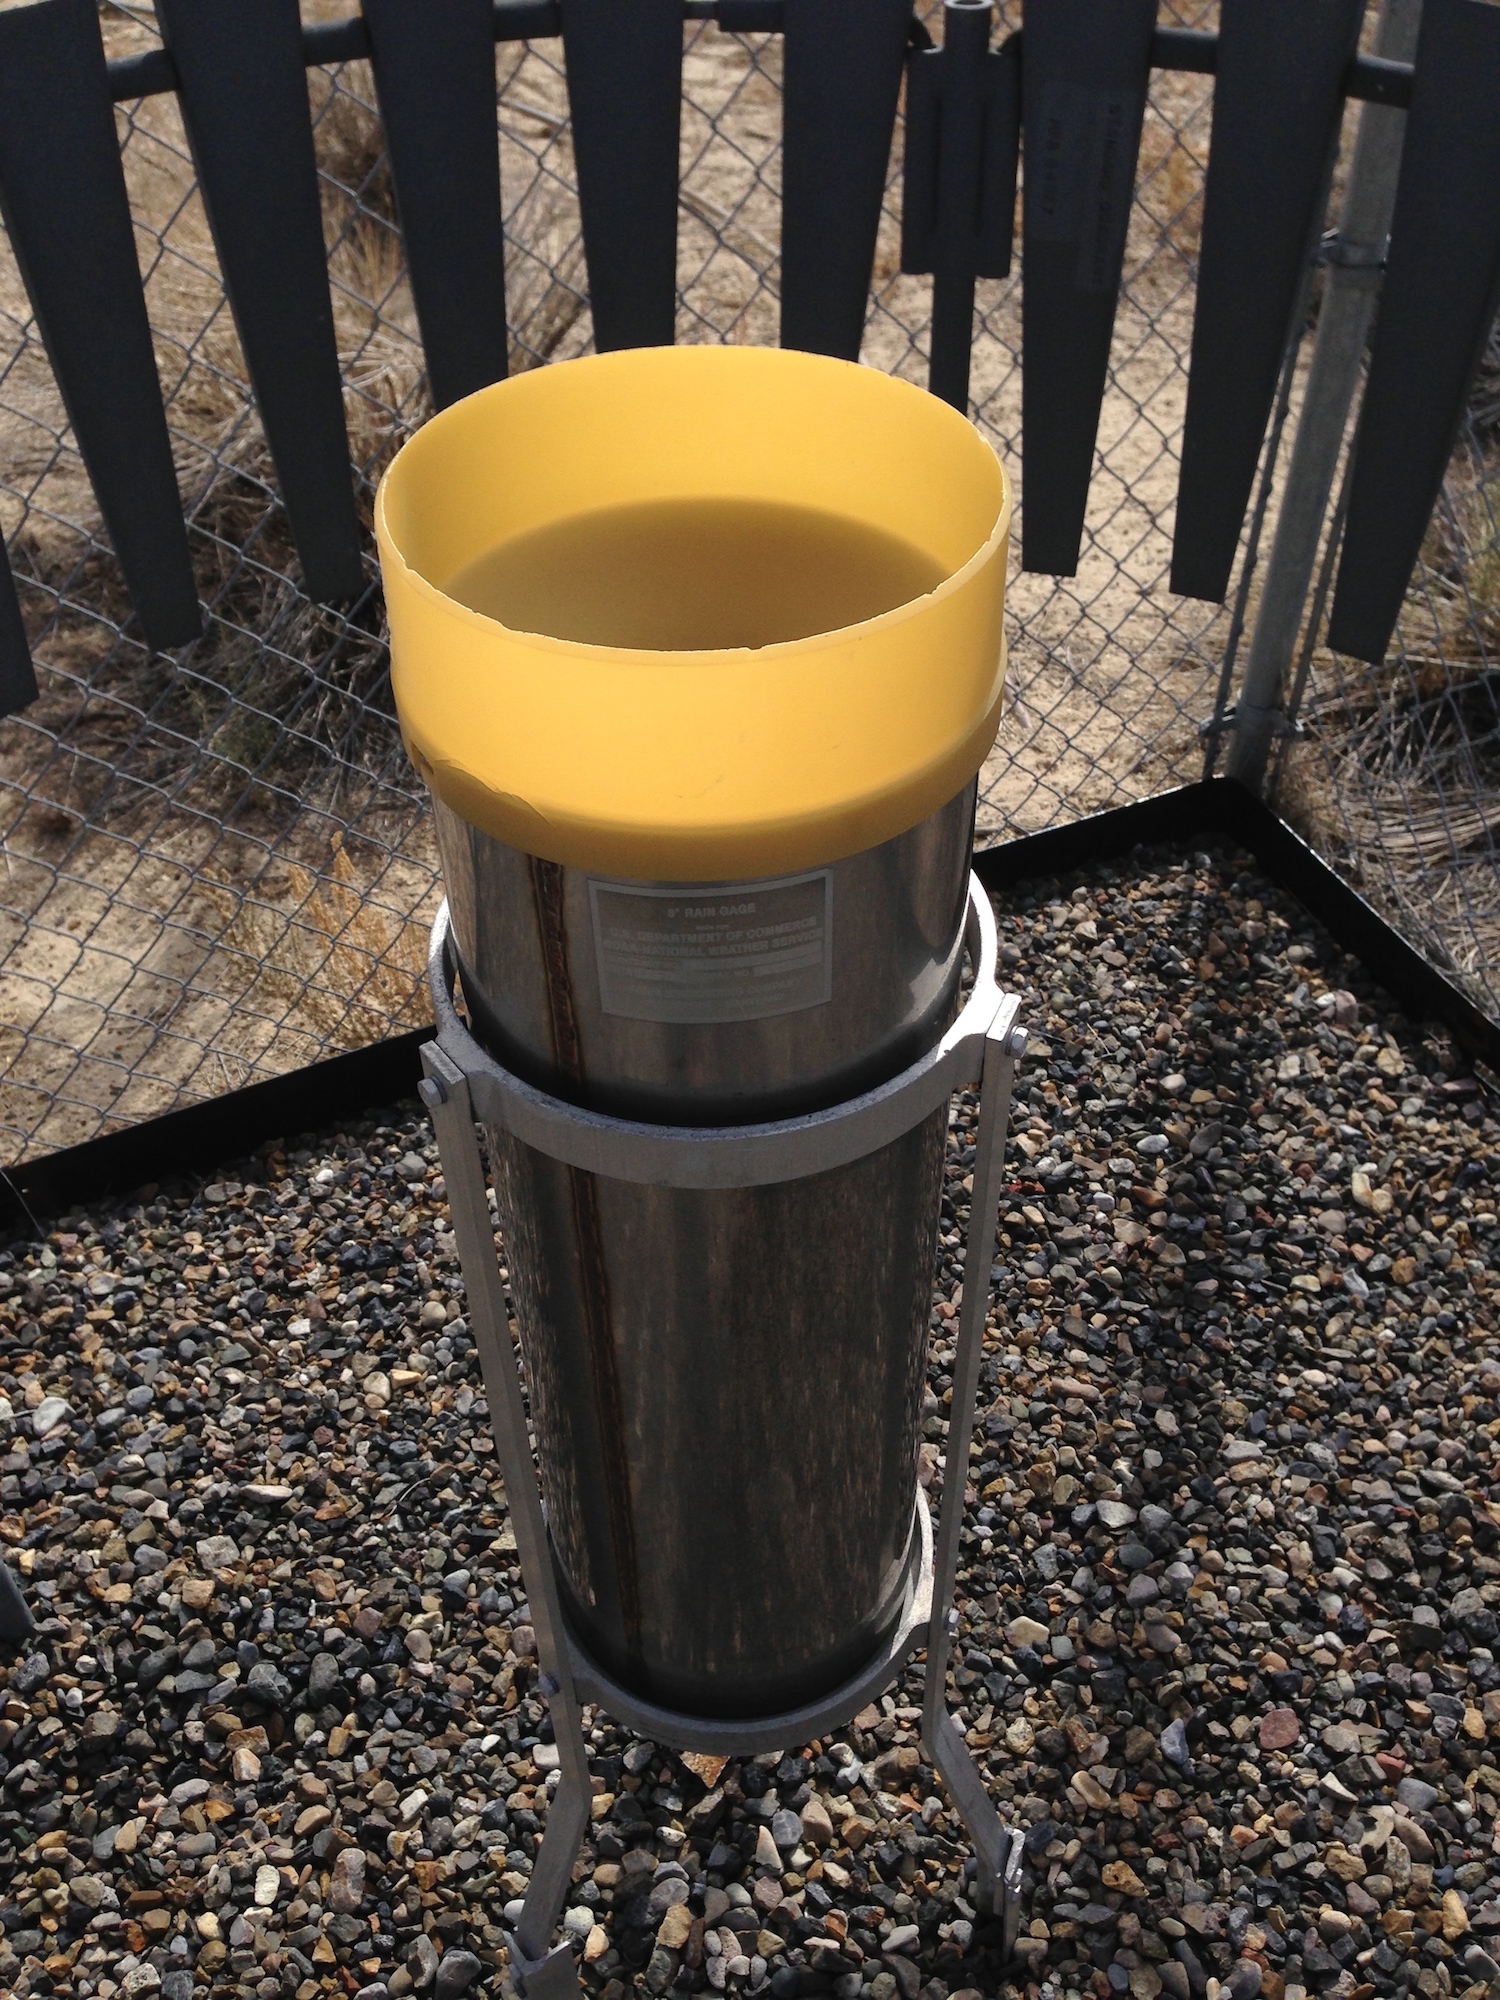
(b) A stand-alone rain gauge. Credit. National Weather Service.
Figure 6.3.3–2 – Devices for measuring local weather.
Discuss the following questions with a classmate. Then click to open the answers to see if they agree with what you came up with.
- What do we call a device that measures the temperature, and what units to we commonly use to report the temperature?
A thermometer is used to measure temperature, which we usually state in degrees on either the Fahrenheit or Celsius scales. Remember that these scales are defined so that the freezing temperature of water is 0°C (32°F) and the boiling temperature is 100°C (212°F).
- What do we call a device that measures atmospheric pressure? When we say that today’s weather has a high or low pressure, what is that being compared to?
A barometer is used to measure atmospheric pressure. When we talk about the pressure being high or low, we mean in comparison to the average atmospheric pressure for that location.
- What two things do we have to measure in order to describe wind?
We must measure the wind speed and direction. (Fyi, the common device used for measuring wind speed and direction is called an anemometer . In Figure 4.26a, the anemometer is the part hanging out to the left.)
- What is the common way of describing humidity in a weather report, and what does it mean?
The most common way of describing the humidity is with what we call the relative humidity , which tells us the percentage of the maximum possible amount of water vapor that is in the air at a particular temperature.
- Precipitation that falls as rain is generally measured with a “rain gauge” (see Figure 6.3.3–2b), which simply measures how deep the rain fills the gauge. How would you measure precipitation that falls as snow? Can you think of a “fair” way of comparing the amounts of precipitation that come in different forms, such as rain or snow?
For snowfall, we usually measure the depth of the snow that collects. To compare rain and snow (or sleet or hail), you can let the snow collect in your rain gauge, then melt it so that you see how much actual water it represents.
Recall from Section 4.1.4 that these types of measurements, made directly on the ground, represent what we call ground truth data . In addition, we get data through remote sensing from satellites.
As you learned in this box, satellites can have different general types of orbits. Most weather data comes from satellites that are in one of these two types of orbit (Figure 6.3.3–3):
- A polar orbit, meaning that the satellite orbits around Earth, passing over the poles with each orbit. Weather satellites in these orbits typically orbit at an altitude of about 850 kilometers (530 miles). Because Earth rotates beneath them as they orbit, any single satellite will pass over a different “slice” of Earth with each orbit. Over the course of a full day, the satellite will typically pass twice over every region of Earth. This means that a single satellite can only get a weather snapshot of a region about twice a day. However, with multiple satellites, we can get satellite data for each location more often than that.
- A geostationary orbit, meaning that the satellite orbits at an altitude of about 36,000 kilometers (22,000 miles), where its orbital period matches Earth’s rotation period. This means the satellite will always view the same side of Earth. With multiple satellites, we can get images of the entire Earth.
Today, many satellites are collecting weather data from around the world at any one moment. These satellite observations give us a broad-based picture of global weather that has tremendously improved weather forecasting in recent decades.
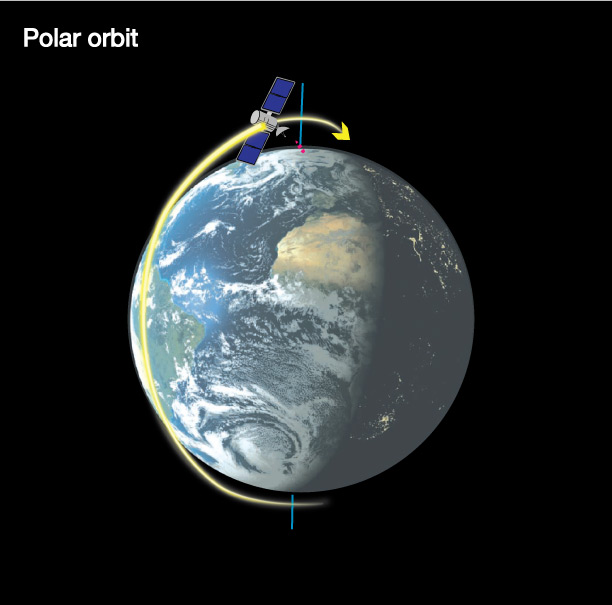
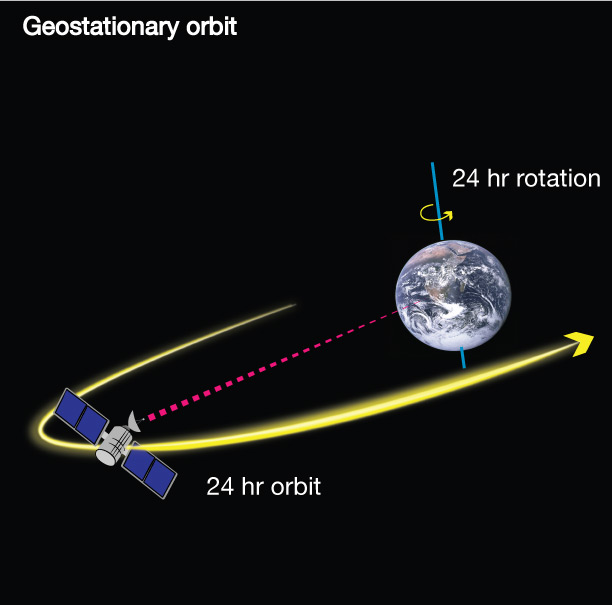
Figure 6.3.3–3 – Satellites used to study weather are usually in either polar or geostationary orbits.Credit: Zofostro Science.
Discussion
Satellite Observations
Discuss the following questions in small groups or as a class.
- Suppose you want to get continuous data for a region of Earth, such as continuous weather data for the United States. Which type of weather satellite should you use: one in a polar orbit or one in a geostationary orbit? Explain.
- Weather satellites in polar orbits have one major advantage over satellites in geostationary orbits. What is it, and why is it an advantage? Hint: Consider the satellite altitudes.
- NASA’s GOES ( “Geostationary Operational Environment Satellite”) satellites are very important for weather observations. These satellites (there have been 17 of them to date) view Earth in many different wavelengths of light, each providing different information about the weather. You can see current images from GOES for any part of North or South America by visiting the web page for the GOES Image Viewer. If you live in the Americas, go to that web page and click on the region that includes your location. Examine the “Geocolor” animation, along with a few other of the many different views available. In a general sense, discuss how these views appear to relate to the weather you are currently experiencing. (If you don’t live in the Americas, choose a region of interest and explore what it shows.)
- Optional: Continuing with the GOES Image Viewer, you can find brief information describing each of the available views at this National Weather Service web page (or more detailed fact sheets here). Choose at least one of the available views for your region, and explain what it is currently telling you about your regional weather.
This discussion will allow you to help students understand more about weather satellites.
- (1) For a continuous view of a region, you will need a satellite in geostationary orbit.
- (2) The fact that polar orbits are at much lower altitude means that a camera (or other instrument) of a particular size will be able to see the Earth with much higher resolution than the same camera in a geostationary orbit. To summarize: polar orbits have the advantage of higher resolution, while geostationary orbits have the advantage of continuous data.
- (3) This question is designed to get students to explore the GOES Image Viewer. The “Geocolor” view includes visible light (along with infrared), so it should be fairly easy to interpret. Students should be able to see, for example, how cloud patterns on the satellite view relate to the clouds visible in the sky at present.
- (4) This question helps students dig a little deeper into what they see with the GOES Image Viewer, by giving them links that will explain the many different views available.
Air Masses and Fronts
If you walk to school, you’ll almost always find that the weather at school is essentially the same as the weather at your home. If you get in a car and drive to a nearby town, the weather will probably also be very similar. But if you get on an airplane and fly a long distance, you may land in a place where the weather is completely different from yours. This tells us that, at any one moment, the weather tends to be similar over particular regions, but different from the weather in other regions. Of course, the weather also moves, so the weather that is in one region right now may move into a neighboring region over the coming days.
Scientists explain these ideas using the concept of air masses , which are large regions of air that share similar weather characteristics, such as similar temperature, humidity, and pressure. Air masses are typically more than 1,000 kilometers (600 miles) across, explaining why the weather is generally similar over fairly large regions. The high and low pressure systems shown on a weather map (see Figure 6.2.1–8) generally represent distinct air masses.
The places where different air masses meet are called weather fronts . There are four main types of weather front, called cold, warm, stationary, and occluded. Let’s briefly look at each.
Cold Fronts
A cold front is place where a mass of cooler, drier air is pushing into a mass of warmer, moister air (Figure 6.3.3–4). The cooler air is denser than the warmer air, so it forces the warmer air upward. This, in turn, means that moisture in the warm air will condense to form clouds as it rises upward. Weather maps show cold fronts with a line of blue triangles. Temperatures are lower behind the front (that is, in the cooler air mass) than ahead of it (where there is still a warmer air mass).
Important note: Despite its name, the “cold” air moving with a cold front is not necessarily very cold; it is simply cooler than the air it is replacing as it advances. For example, in Figure 6.3.3–4b, notice that the “cold” temperatures are still well above freezing. In the summer time, the air behind a cold front may actually be quite warm, as long as it is pushing into an even warmer air mass.
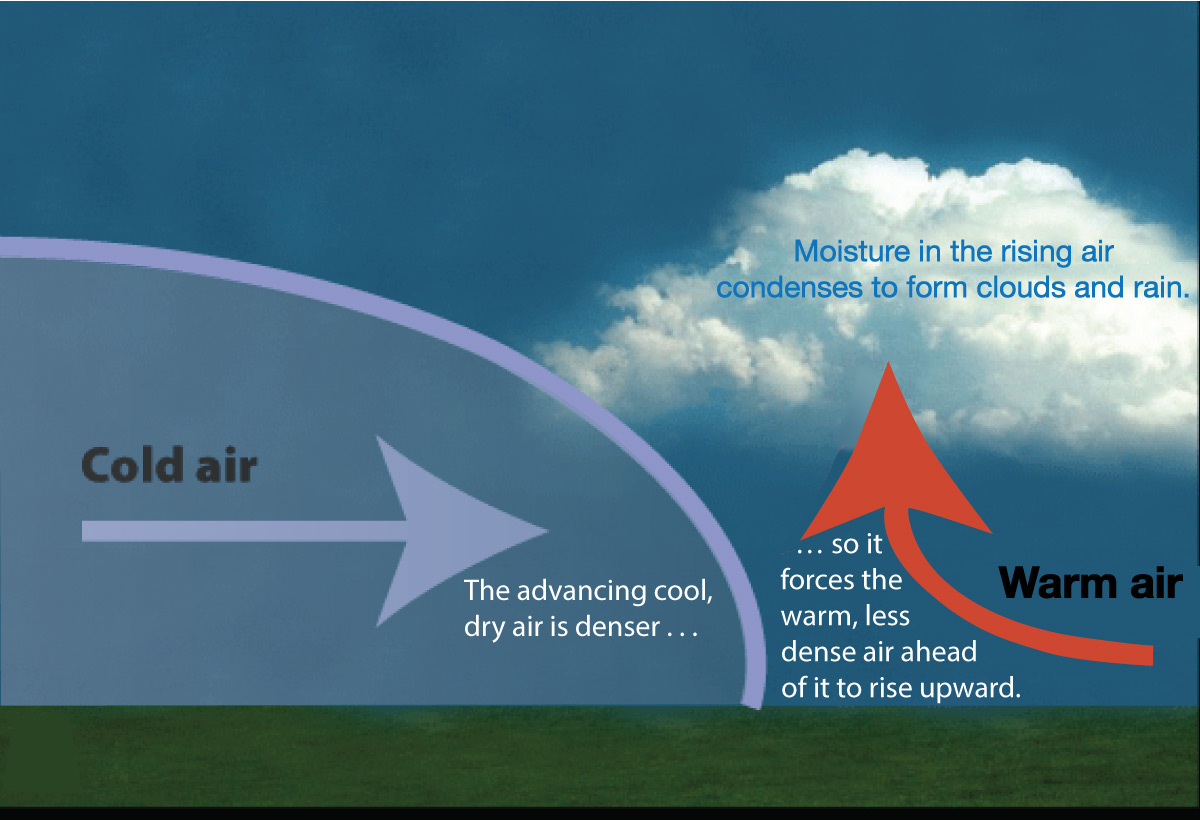
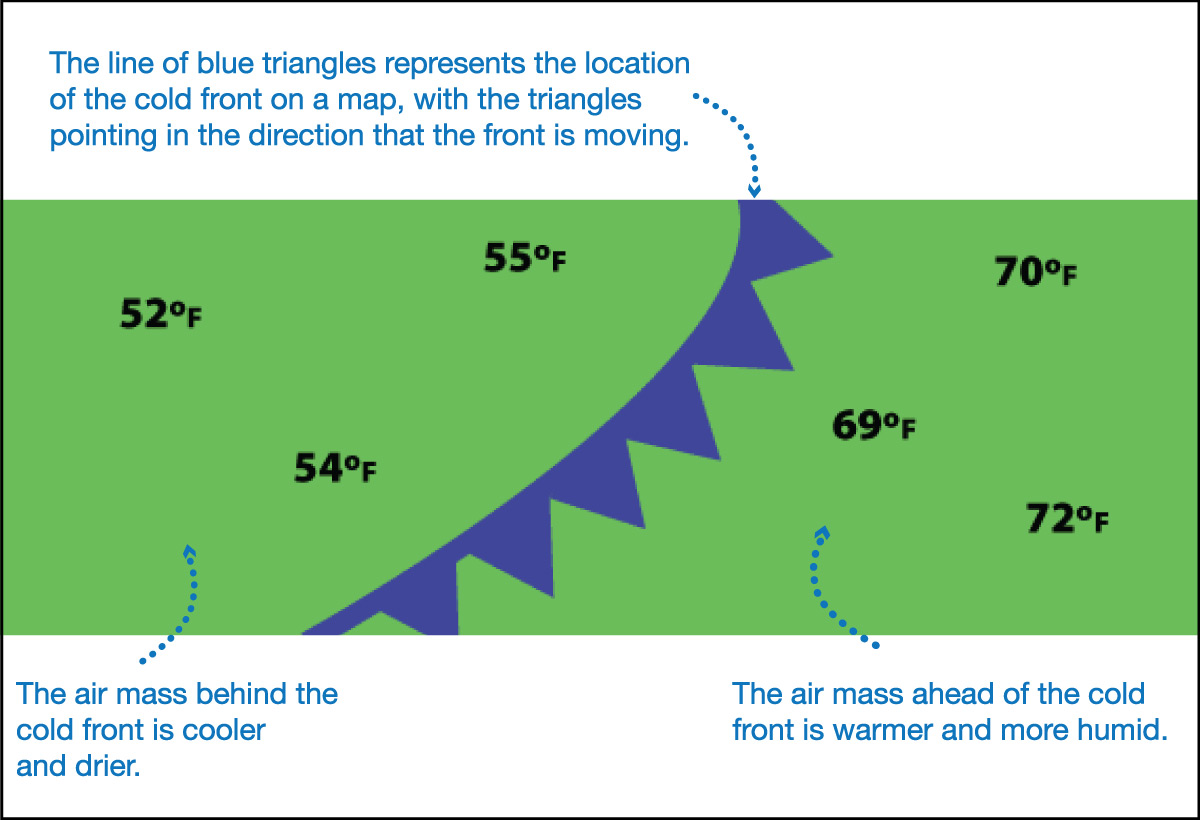
Figure 6.3.3–4 – The process of and symbols for a cold front , where a mass of cooler, drier air pushes into a mass of warmer, moister air. Notice that the front is moving to the right in these illustrations. Credit: Adapted from Windows to the Universe, Lisa Gardiner.
The clouds that form along a cold front are often thick and therefore very likely to produce storms with heavy rain, hail, or snow. As a result, cold fronts are often clearly visible to our eyes both from the ground and in satellite photos (Figure 6.3.3–5). This also explains why cold fronts are often associated with severe weather such as thunderstorms and tornados.
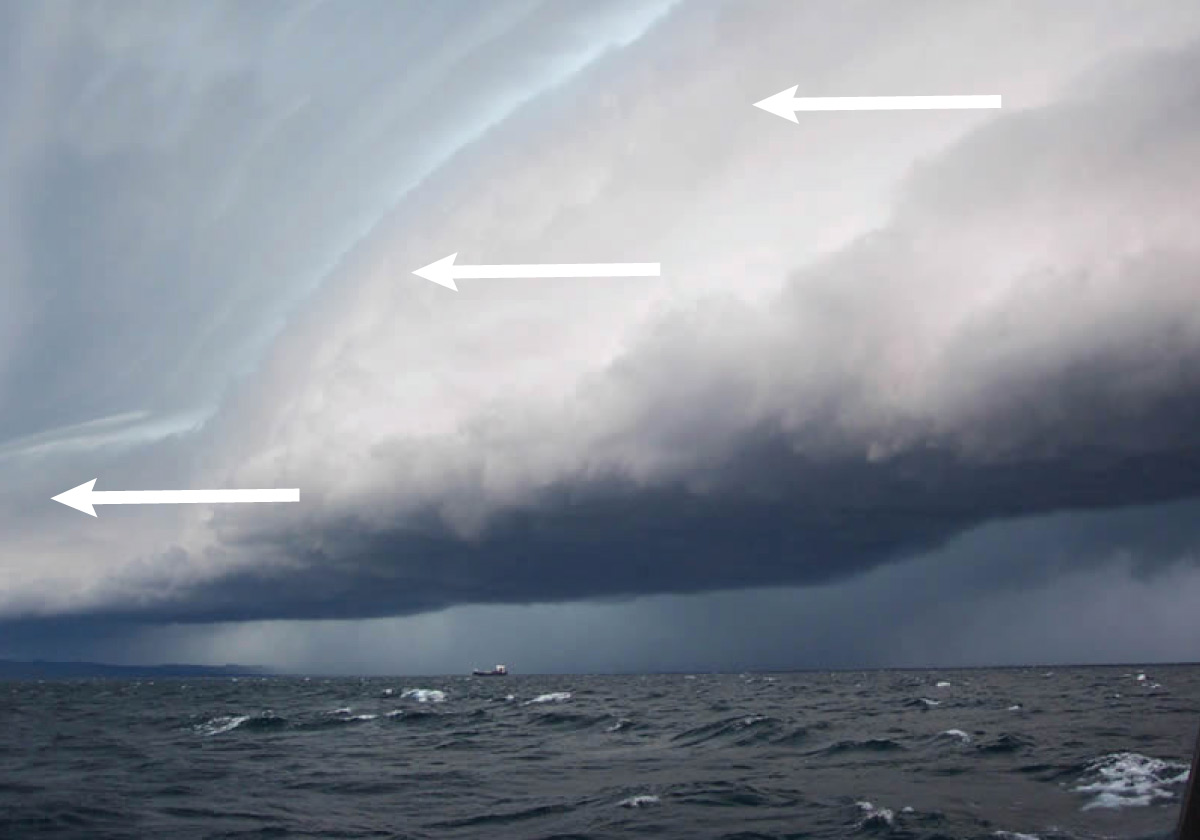
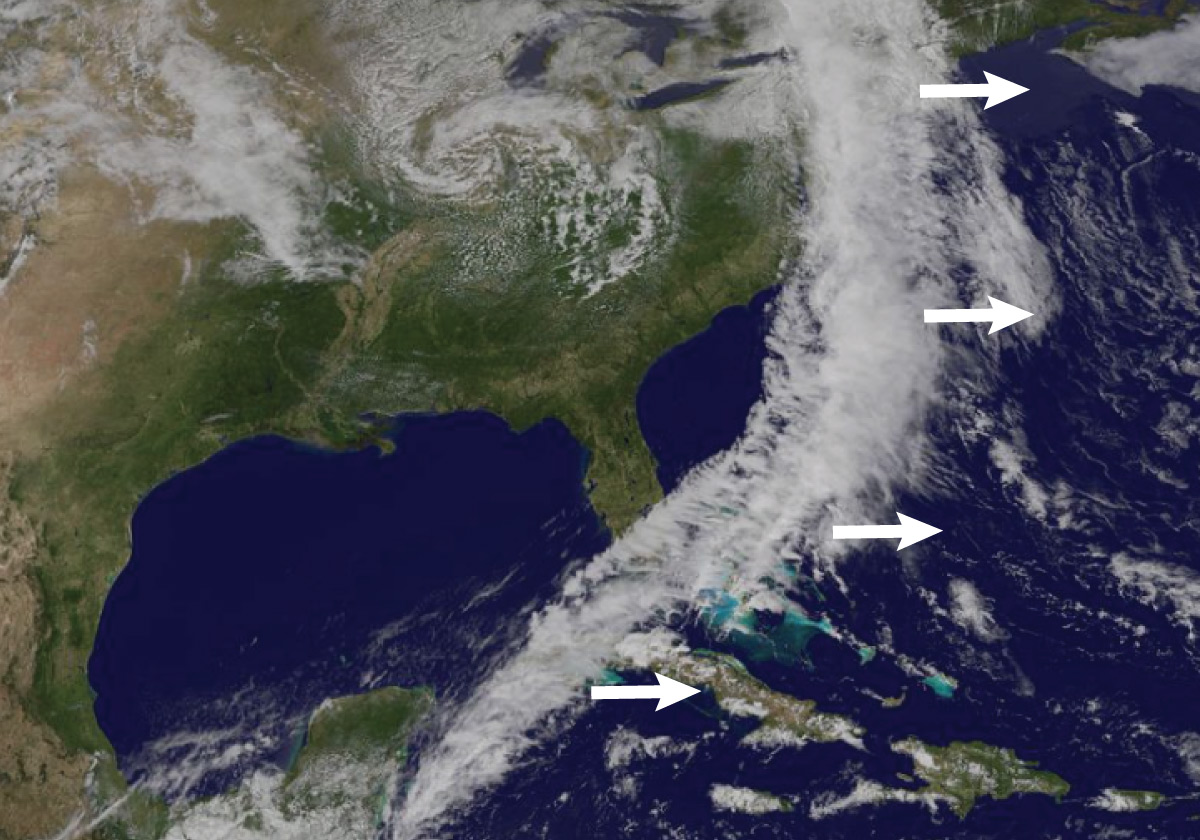
Figure 6.3.3–5 – Cold fronts are typically marked by the advance of stormy weather that can be seen both from the ground and from space.
Warm Fronts
A warm front occurs where a mass of warmer air pushes into a mass of cooler air (Figure 6.3.3–6). The warmer air is less dense than the cooler air it is pushing into, so the warm air tends to move both forward and upward, leading to cloud formation. You’ll therefore often get rain as a warm front passes through, but once it pushes ahead, your weather will warm up with the warmer air that comes behind it.
Important note: Again, the air in a warm front is not necessarily very warm; it is simply warmer than the air it is replacing as it advances.
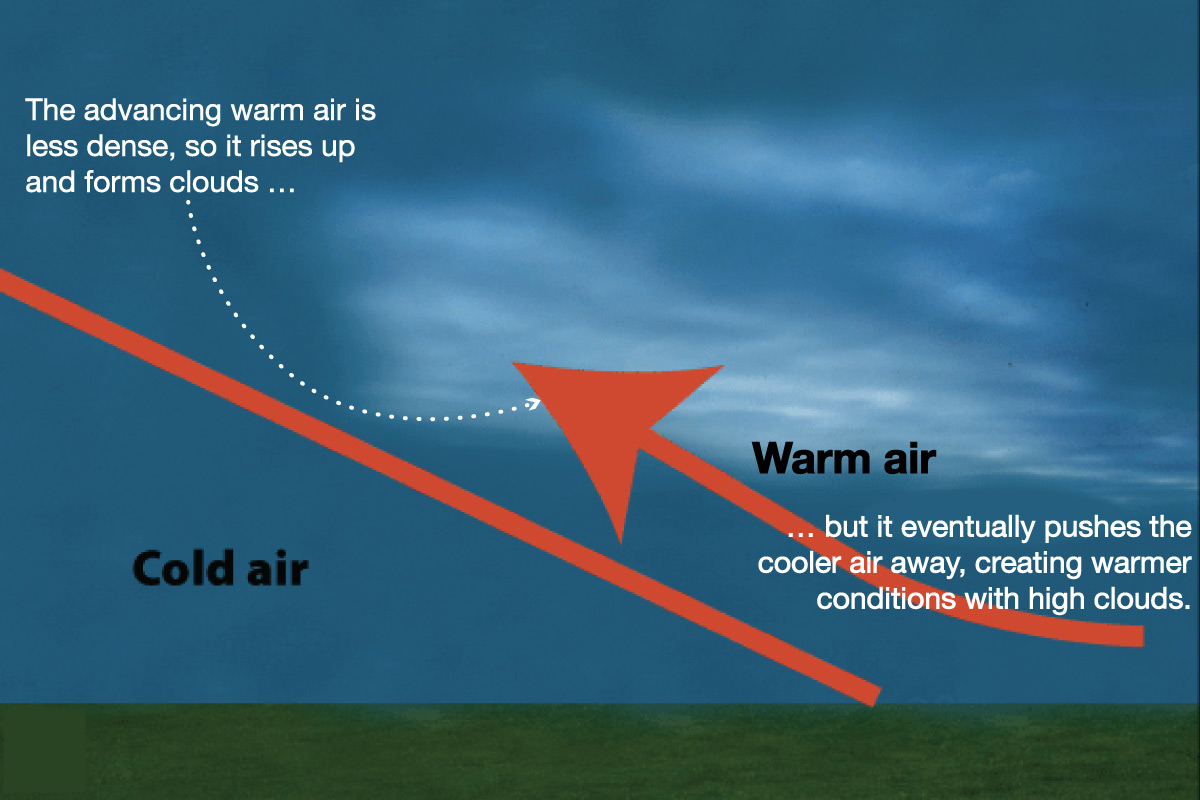
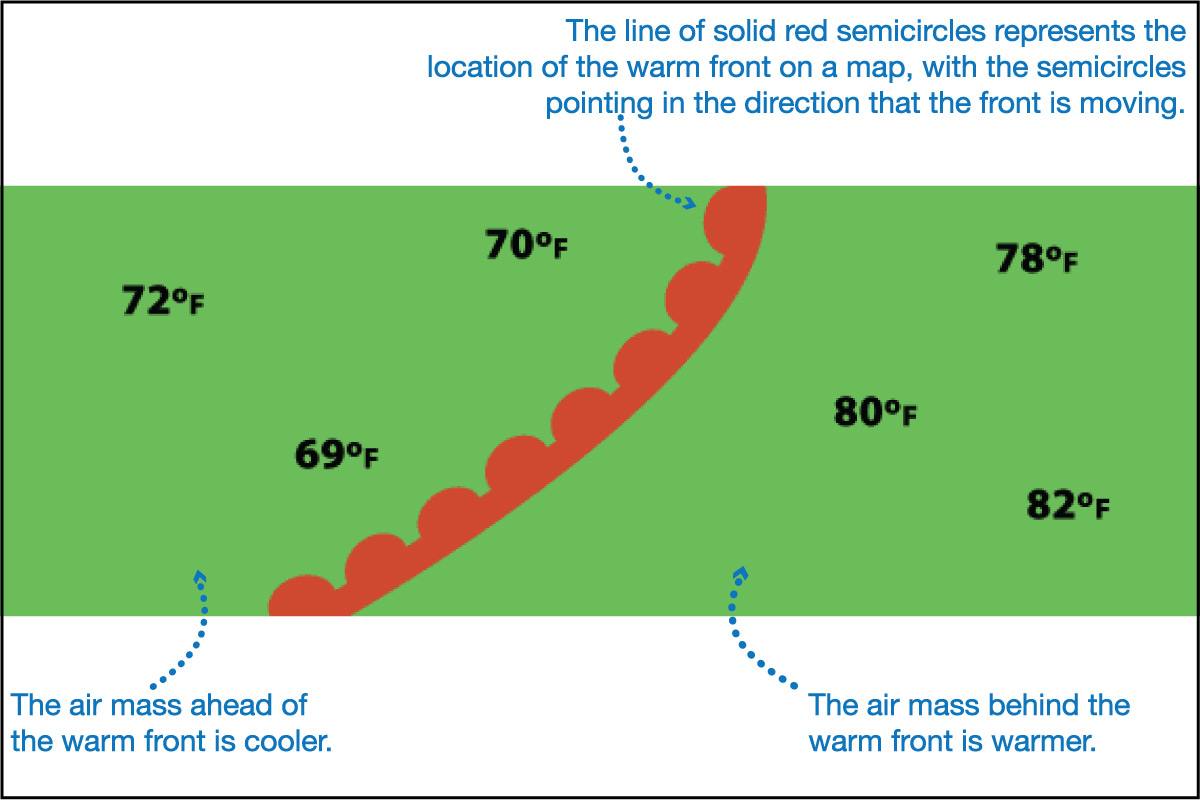
Figure 6.3.3–6 – The process of and symbols for a warm front , where a mass of cooler, drier air pushes into a mass of warmer, moister air. Notice that the front is moving to the left in these illustrations. Credit: Adapted from Windows to the Universe, Lisa Gardiner.
Keep in mind that weather is complex, and warm fronts and cold fronts can sometimes be close together or even overlapping. Figure 6.3.3–7 shows a remarkable satellite image and video in which we see both a warm front and a cold front, both advancing on a high pressure air mass.
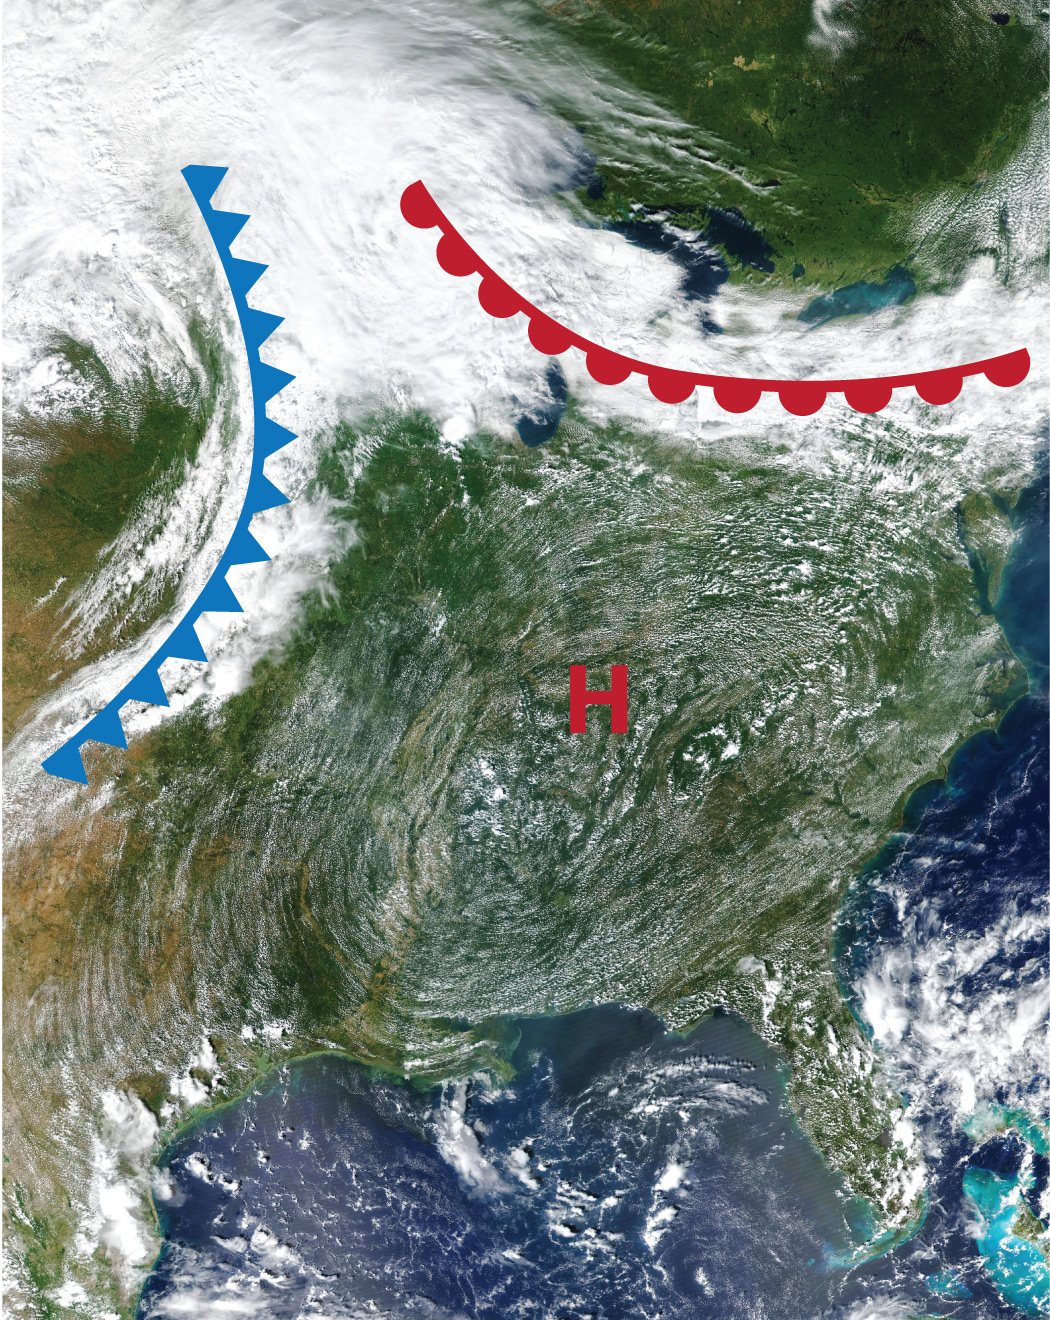
(left) The photo is overlaid with the standard symbols for the advancing cold and warm fronts and for the high pressure region.
(above) This time-lapse video shows the weather system as it moved over a period of about 6 hours.
Figure 6.3.3–7 - This satellite photo and video (from GOES on Sept. 12, 2019) shows both a cold front (to the left, moving eastward) and a warm front (to the north, moving southward), both moving into a high pressure region. Notice that the clouds are thicker and stormier over the cold front. Credit: NASA.
Discussion
Satellite View of Fronts
Discuss the following questions based on the image and video in Figure 6.3.3–7.
- Explain how the symbols on the photo in in Figure 6.3.3–7 indicate the directions in which the fronts are moving. Can you see this motion in the video? (It may be a bit difficult to see, because the video shows a period of only 6 hours, while the fronts kept moving for days.)
- What can you say about temperatures on the two sides of each front in the image?
- Are winds blowing into or out of the high (H) pressure region, and why? (Hint: Think about what you know about high and low pressure, ignoring the fronts for the moment.)
4. Which way is air circulating around the high (H) pressure region, and why? Can you see this circulation in the video? (Hint: see Figure 6.2.1–9.)
This is a brief discussion that you can do in small groups or as a class, designed to review some key concepts and make sure students understand what they see in Figure 6.3.3–7.
- (1) The triangles and semicircles point in the directions of motion, telling us that the cold front is moving toward the east and the warm front is moving southward. You can see this vaguely in the video, though the fact that it shows only 6 hours makes it a little hard to see clearly.
- (2) Both fronts are moving into the same region, which is the air mass characterized by high pressure. Therefore: The air behind the cold front must be cooler than the air in the H region, while the air behind the warm front must be warmer than that air. To summarize: (temperature of air behind cold front) < (temperature of H region) < (temperature behind warm front).
- (3) Winds blow from high pressure to lower pressure, so winds are blowing outward from the H.
- (4) In the Northern Hemisphere, air circulates clockwise around high (H) pressure regions, due to the Coriolis effect. This circulation is clearly visible in the video.
Occluded Fronts
Cold fronts generally move faster than warm fronts. As a result, a cold front can sometimes catch up to a warm front that was moving ahead of it. The result is called an occluded front (Figure 6.3.3–8). As with other fronts, you’ll often get rain or other precipitation as the front passes by you, with clearer skies after it passes. Video 6.3.3–9 summarizes some of the ideas we’ve discussed about cold, warm, and occluded fronts.
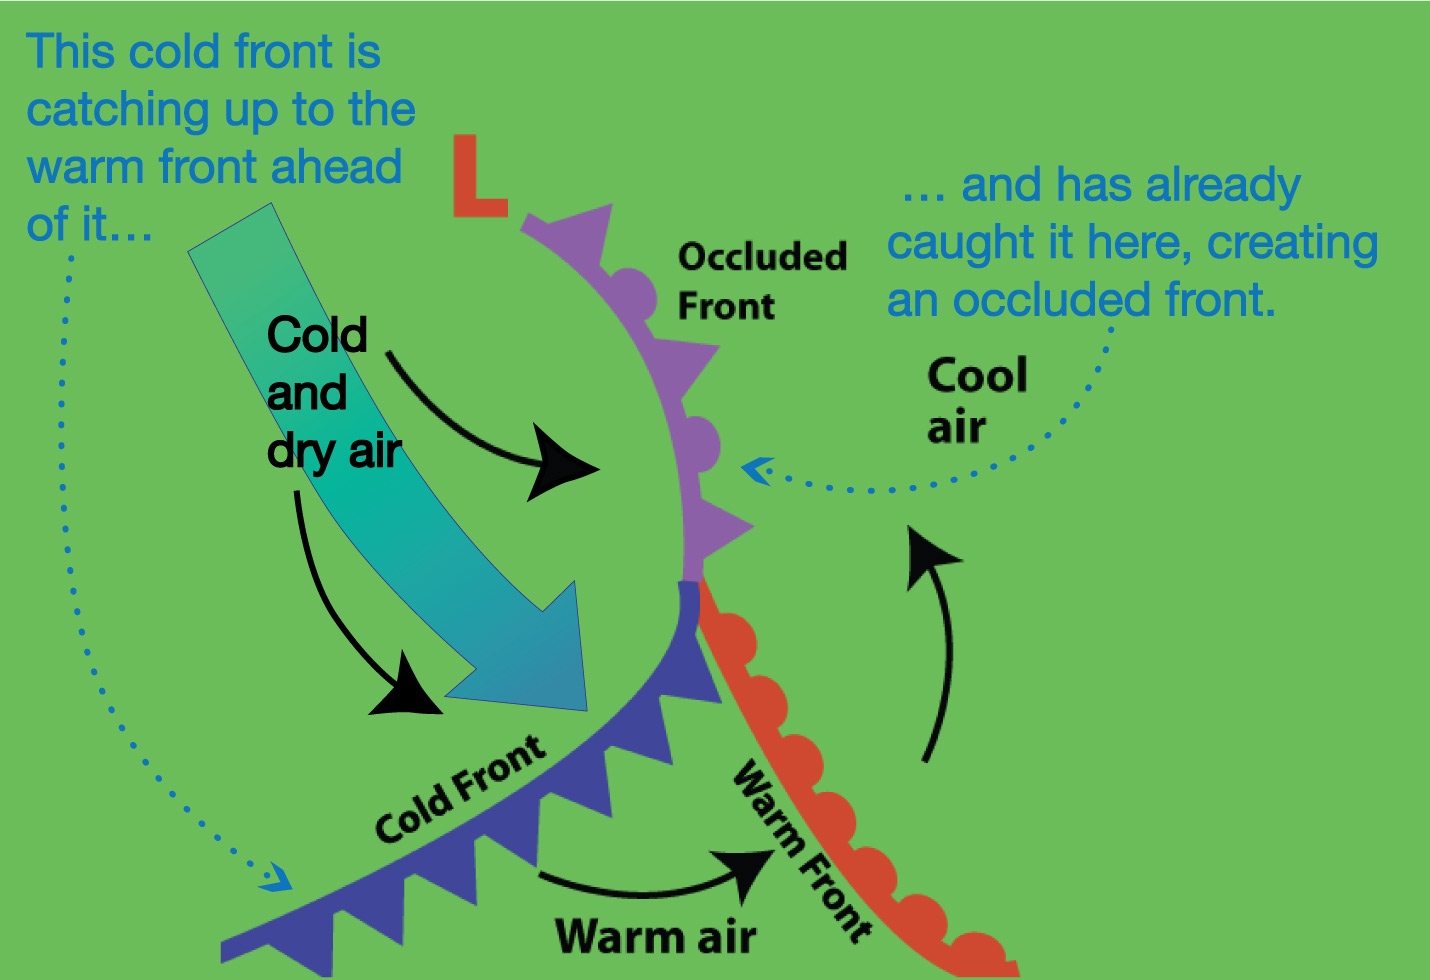
Figure 6.3.3–8. This diagram shows a cold front that is overtaking a warm front, creating an
occluded front in the place where it has already overtaken it. Notice that the symbol for an
occluded front is the purple line of alternating triangles and semicircles, which all point
in the direction that the front is moving. Credit: Windows to the Universe, Lisa Gardiner.
Video 6.3.3–9 - This video summarizes important ideas about cold, warm, and occluded fronts. Credit: Met Office UK.
Stationary Fronts
A fourth type of front occurs when two air masses of different temperature are advancing from opposite directions, so that they collide with one another. If neither is strong enough to push the other out of the way, the result can be a stationary front , which is essentially a place where a front has stopped moving (Figure 6.3.3–10). Winds often blow in opposite directions along the two sides of a stationary front, helping it to stay in place until the winds shift. Stationary fronts can sometimes stay in place for days, and because fronts are often marked by storms, these fronts can produce long-lasting rain and flooding.
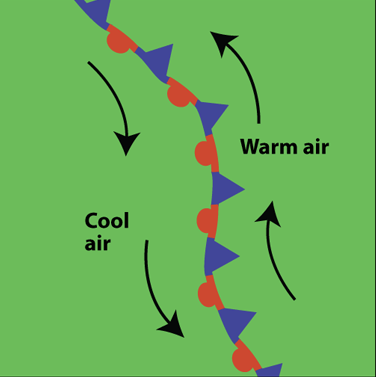
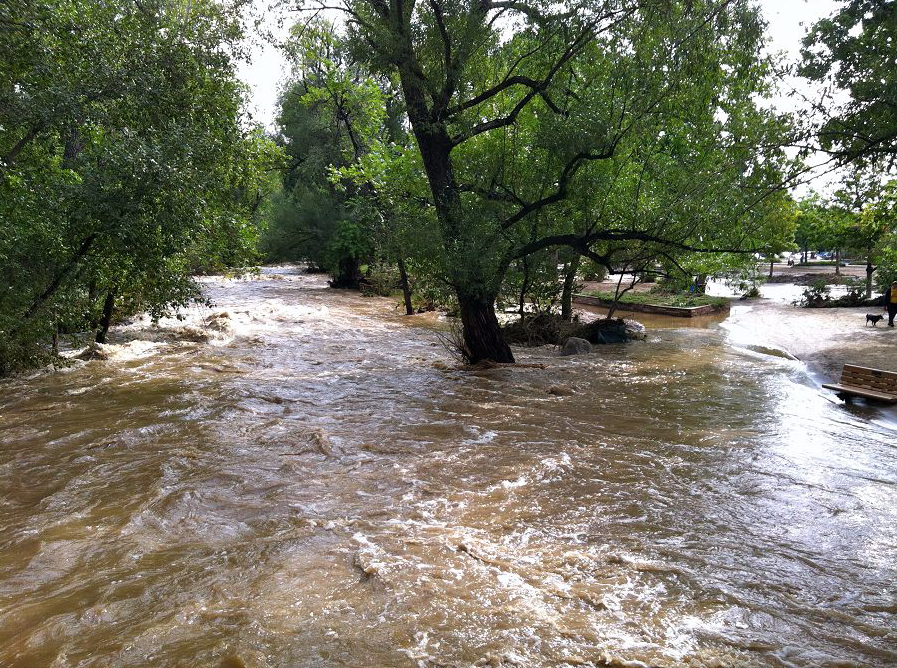
Figure 6.3.3–10 – A stationary front forms where two air masses of different temperature collide, and neither can push ahead of the other. This can sometimes lead to many days of severe weather along the front.
Weather Maps
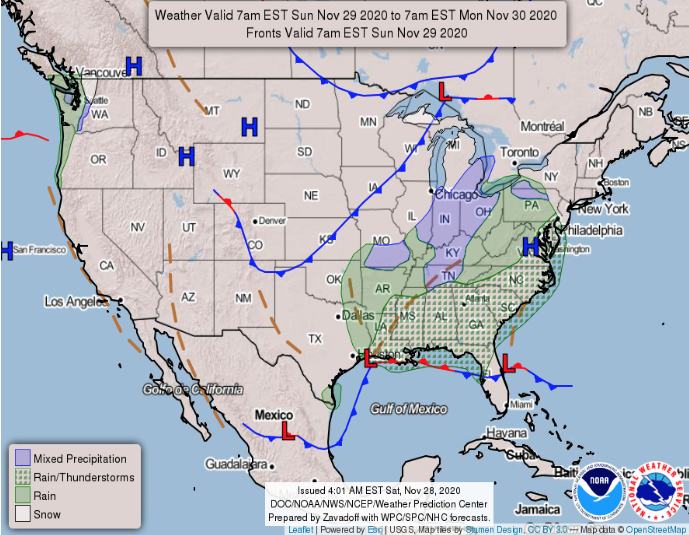
You now have all the tools you need to understand the major features of most weather maps. Weather maps come in many different styles, but all follow similar principles. Figure 6.3.3–11 shows two typical weather maps (and you’ve also seen one earlier in Figure 6.2.1–8). Based on what we’ve already discussed, you should recognize most of the symbols . Here is a brief summary:
- The H symbols tell you where high-pressure air is centered. Remember that high pressure means:
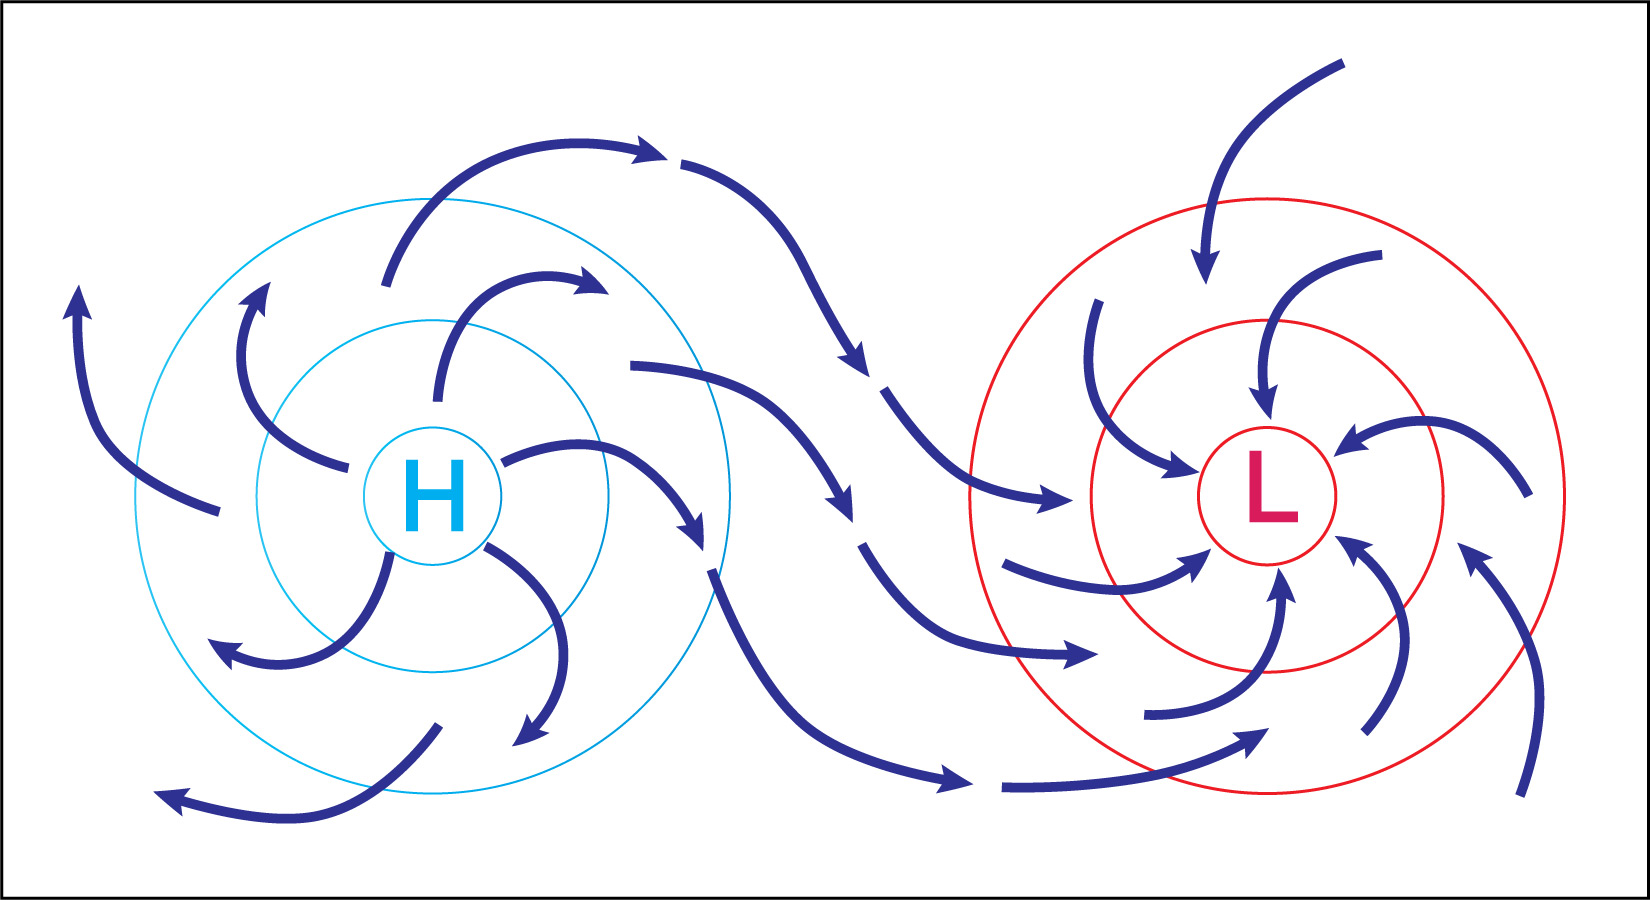
- winds blowing outward and curving to the right in the Northern Hemisphere , which makes for a clockwise circulation (see Figure 6.2.1–9); and
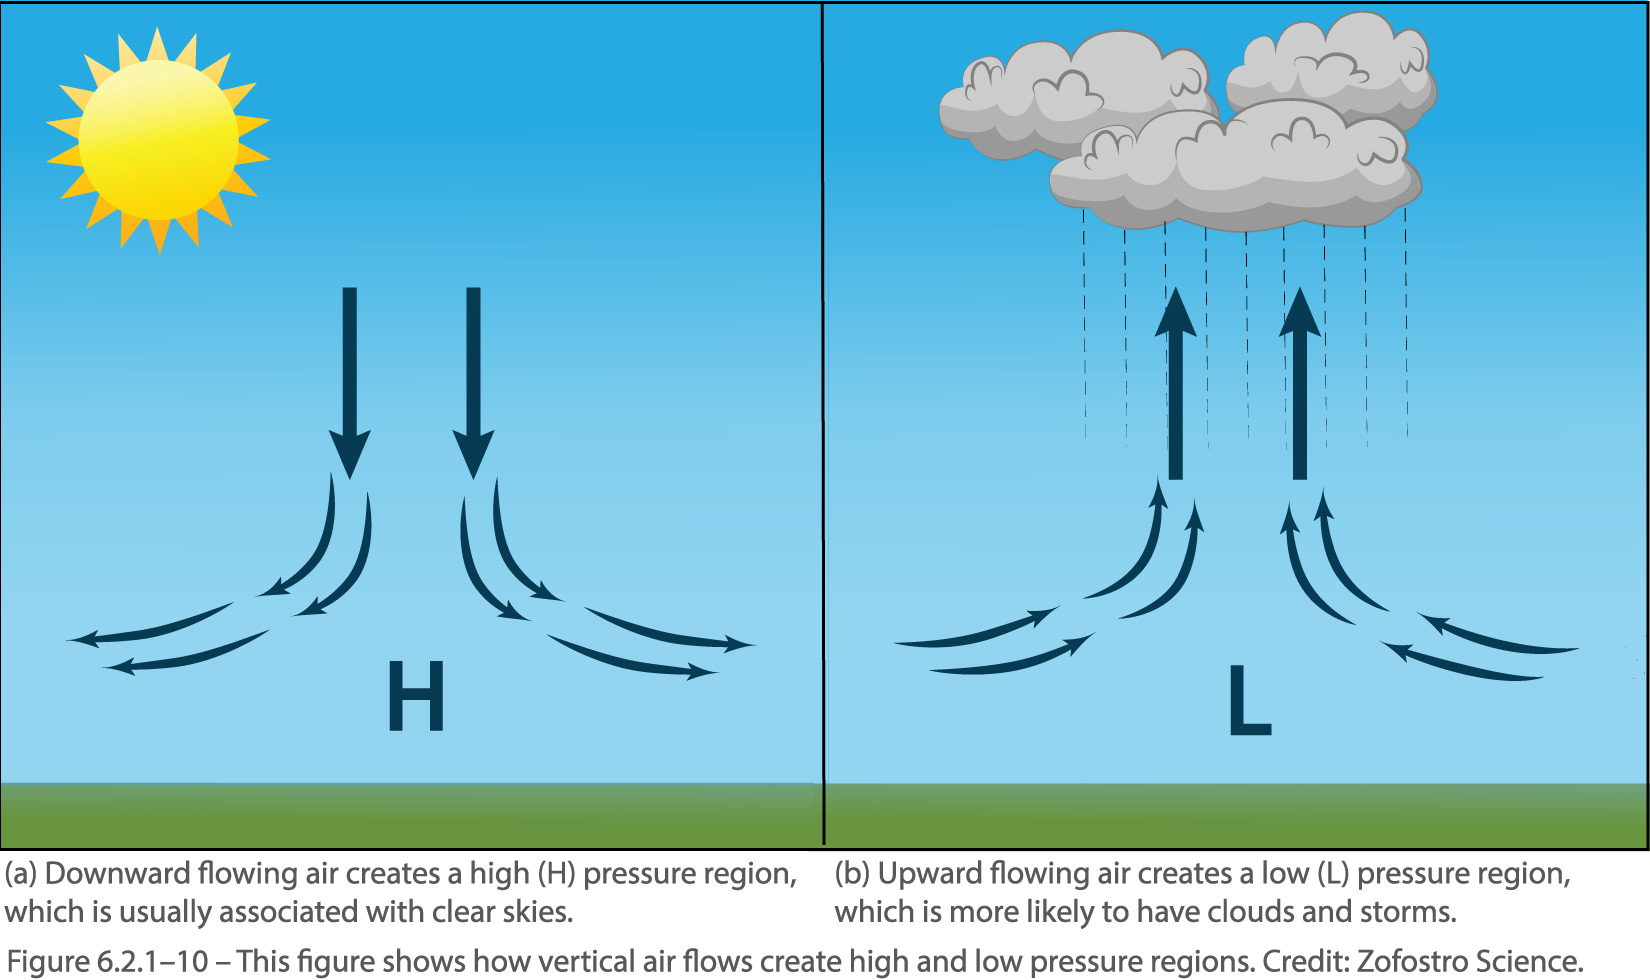
- a downward air flow that generally means drier air and clearer skies over the H region (see Figure 6.2.1–10).
- The L symbols tell you where low-pressure air is centered. Remember that low pressure means:
- winds blowing inward and curving to the right in the Northern Hemisphere , which makes for a counterclockwise circulation; and
- an upward air flow that often means cloudy skies and precipitation over the L region.
- Cold, warm, occluded, and stationary weather fronts are indicated by the lines with triangles and/or solid semicircles, as we’ve discussed above. Note that Figure 6.3.3–11a shows all the front types except for stationary, while Figure 6.3.3–11b shows all but occluded fronts.
- The two maps show two different ways of indicating regions with precipitation. Figure 6.3.3–11a uses words, while Figure 6.3.3–11b uses shading that references the legend at the lower left.
Before you continue, make sure you can find and identify all the above features on the two weather maps. To further help clarify the ideas, watch Video 6.3.3–12.
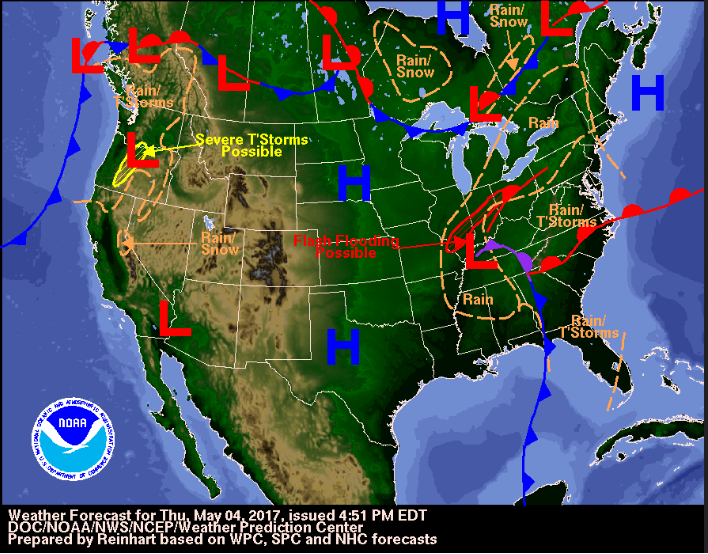
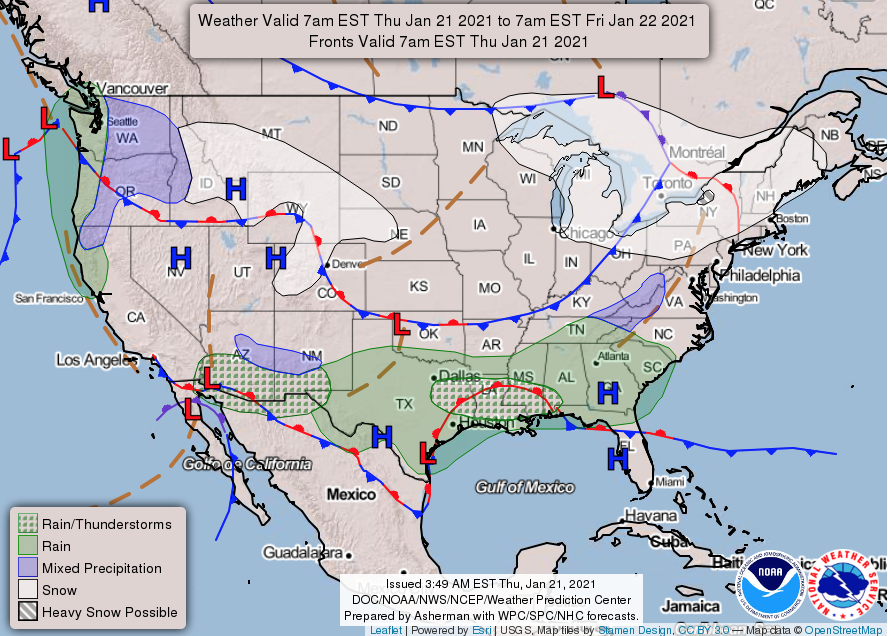
Figure 6.3.3–11 – Two examples of typical weather maps. Credit: NOAA, National Weather Service.
Video 6.3.3–12 - This video, created by a meteorologist for a classroom in Raleigh, North Carolina (USA), summarizes many of the ideas we’ve discussed and how you can see them on a weather map. Remember that the wind circulation directions he talks about apply to the Northern Hemisphere, and would be opposite in the Southern Hemisphere. Credit: Ryan Tidwell-Davidson.
Some weather maps show additional details. Figure 6.3.3–13 shows three common examples. The map in Figure 6.3.3–13a has the same general features as the maps above, but also adds infrared satellite views that reveal cloud cover and color-coded radar data that reveals regions of precipitation. Figure 6.3.3–13b shows a map with added contours that show pressure changes more precisely, allowing us to get a sense of surface wind speeds. Figure 6.3.3–13c shows a map of winds at high-altitude, allowing us to see patterns of jet streams (review the jet stream discussion in Section 6.2.1). Weather forecasters use a combination of all of these types of weather maps, and many more.
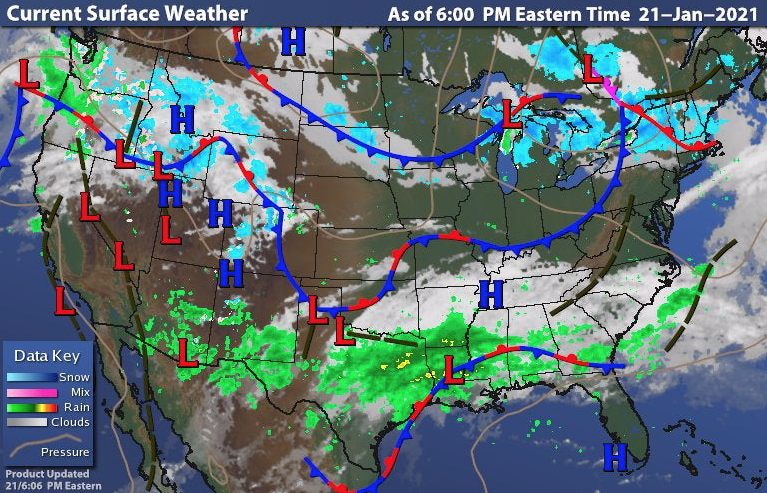
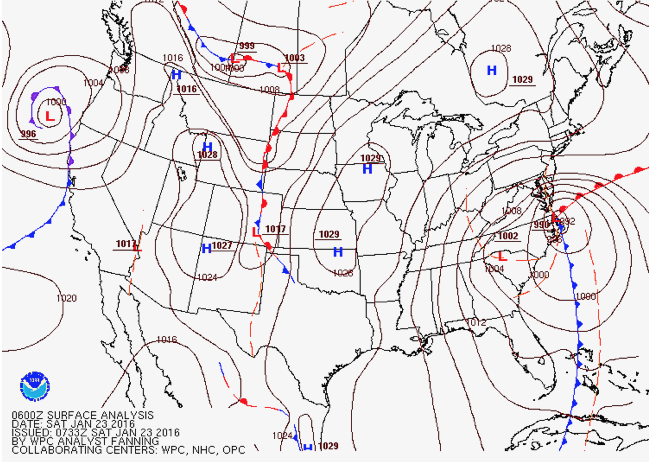
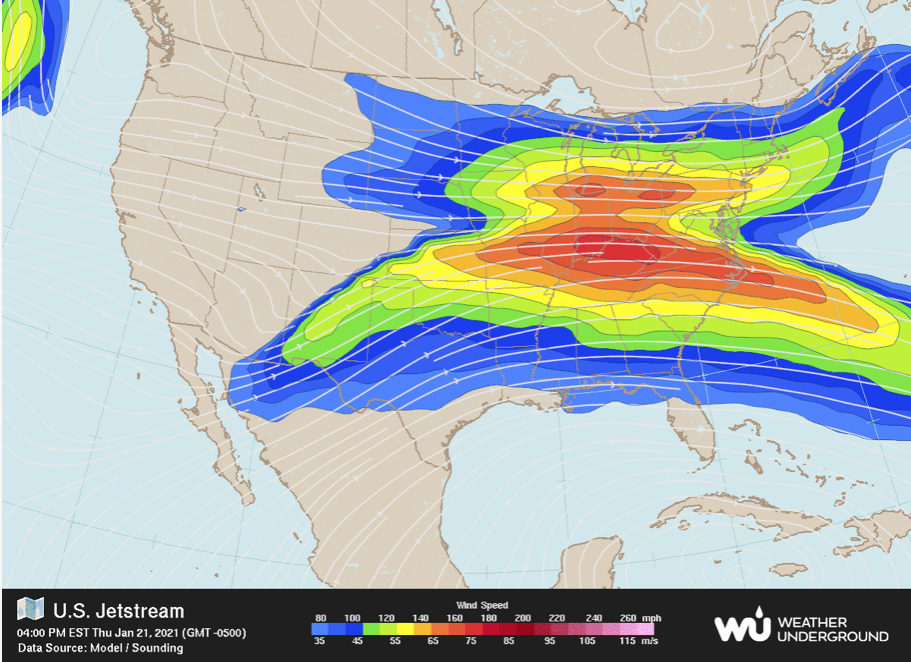
Figure 6.3.3–13 – Three examples of weather maps with additional details compared to those shown earlier.
Activity
Today’s Weather Map
Find one or more weather maps showing today’s weather for your region or country. There are many sources you can use. For the USA, we recommend starting with the National Weather Service daily maps. For other locations, a search on “current weather map” will turn up many options. Then work in small groups to answer the following questions.
- Based on what you’ve learned in this chapter, identify and explain the meaning of as many of the symbols and other features of the maps as you can.
- How would you describe the weather you are experiencing outside right now? Discuss how your actual experience fits in with what you would see on the weather maps.
- Based on the weather maps, and especially the positions and directions of any nearby fronts , discuss how you would expect your weather to change over the coming days.
Use this activity to make sure students know how to read a weather map. Answers will vary with your location and the current weather conditions.
Activity (Advanced)
An Interactive Global Weather Map
There are several web sites that offer interactive maps that allow you to examine different aspects of the weather for any location in the world. For this activity, we recommend using either Weather Underground’s “Wundermap” or the interactive weather maps from Meteoblue. For whichever interactive map you choose, first spend a little time learning how to use it (for example, how to zoom in and out, how to move around, and how to click different options to explore different aspects of the weather). Then create a 3-minute “lesson” that you could present to your classmates or your family that explains how to use the map and discusses the current weather that it is showing. Your lesson can be either “live” (presented to the class) or recorded as a video.
This activity is labeled advanced because these interactive maps go well beyond what we have discussed in this chapter. Nevertheless, students should be able to figure out how to see things we have discussed (such as high and low pressure regions, fronts, temperatures, humidity, precipitation), and many will enjoy learning about and exploring additional features available in these interactive maps. The goal of the 3-minute presentation is simply to be able to quickly demonstrate an understanding of how one of these interactive maps works.
Weather Prediction
For most of human history, the weather came unexpectedly and often suddenly, sometimes leading to tragedy on a massive scale. That began to change as weather stations spread around the world, and people began to learn about the effects of changing pressure and advancing weather fronts . For example, people learned that barometer measurements can often tell us about the general trend we should expect in the weather.
To be sure you understand how changing pressure aids in weather prediction, discuss the following questions with a classmate. Then click to open the answers to see if they agree with what you came up with.
- When you hear a weather forecaster say that “the barometer is rising” or “the barometer is falling,” what does that mean?
Remember that a barometer is used to measure air pressure. So a rising barometer means the local air pressure is rising, and a falling barometer means the air pressure is falling.
- Based on what you have learned about high (H) and low (L) pressure regions on weather maps, what does a “rising barometer” suggest about how your weather will be changing in the coming hours to days?
Remember that high (H) pressure is typically associated with clearer skies (see Figure 6.2.1–10). Therefore a rising barometer suggests that a higher pressure air mass is moving into your region, which means a good chance that your skies will be clearing up, bringing nicer weather.
- What does a “falling barometer” suggest?
A falling barometer suggests that a low (L) pressure air mass is moving into your region, in which case you may get rain or snow as it moves in.
Weather measurements and communication between people at different weather stations made it possible to make educated guesses about how weather might change up to a few days ahead of time. This knowledge was very useful even if imperfect. It also saved lives, by making it much more likely that people would get advance warning of dangerous storms.
The dawn of the space age brought much more improvement in weather forecasting, because weather satellites allow us to actually see weather systems as they move on our planet. Today, scientists can do even better by using computer models to aid in weather prediction. These models combine the available weather data with known physical laws affecting air and water on Earth to make predictions about how the weather will change in coming days. Video 6.3.3–14 gives a one-minute overview of how models are used in weather forecasts, and Video 6.3.3–15 summarizes many of the ideas we’ve discussed in this chapter, using a famous hurricane disaster to show how important weather prediction is to our lives.
Video 6.3.3–14 - This 1-minute video gives a brief overview of how models are used in weather forecasting. Credit: Met Office UK.
Video 6.3.3–15 - This 7-minute video discusses how weather prediction can now help us avoid tragedies like those that used to occur when hurricanes arrived without warning. It also summarizes many other ideas discussed in this chapter. Credit: NASA.
Keep in mind that even the best weather predictions can never be perfect. That is why weather forecasters always talk in terms of probabilities. For example, they may say that “there is a 60% chance of rain at noon tomorrow.” Several factors will affect the accuracy of weather forecasts:
- The most important factor is time. For example, weather predictions for a couple hours from now are much more likely to be correct than those for tomorrow, tomorrow’s forecast is more likely to be correct than the forecast for 3 days from now, and so on. Forecasts beyond about 10 days are almost useless, and even with future improvements in computers and our understanding of weather, it will probably never be possible to predict the weather more than a couple weeks out.
- Geography also plays an important role. Generally speaking, it is easier to predict weather in places where the terrain is smooth (or over the oceans) than in places where there are more mountains and valleys, primarily because of the way those geographical features can interact with winds.
- Size scale is also very important. It is easier to predict the general weather over a large region than to predict exactly what will happen in one small area. For example, scientists can make reasonable predictions about the general region in which thunderstorms are likely to occur, but cannot predict exactly where the rain will be heaviest or where a tornado might hit.
Activity
Weather Forecast Accuracy, Part 2
It’s time now to evaluate the record you’ve been keeping for “Part 1” of this activity. By now, you should have at least two weeks of data on each day’s actual weather and the 24-hour, 3-day, 5-day, 7-day, and 10-day forecasts made each day. You should also now have ratings for the accuracy of the forecasts each day, based on how the weather actually turned out. Working in small groups or as a class, study your data carefully and use it to answer the following questions.
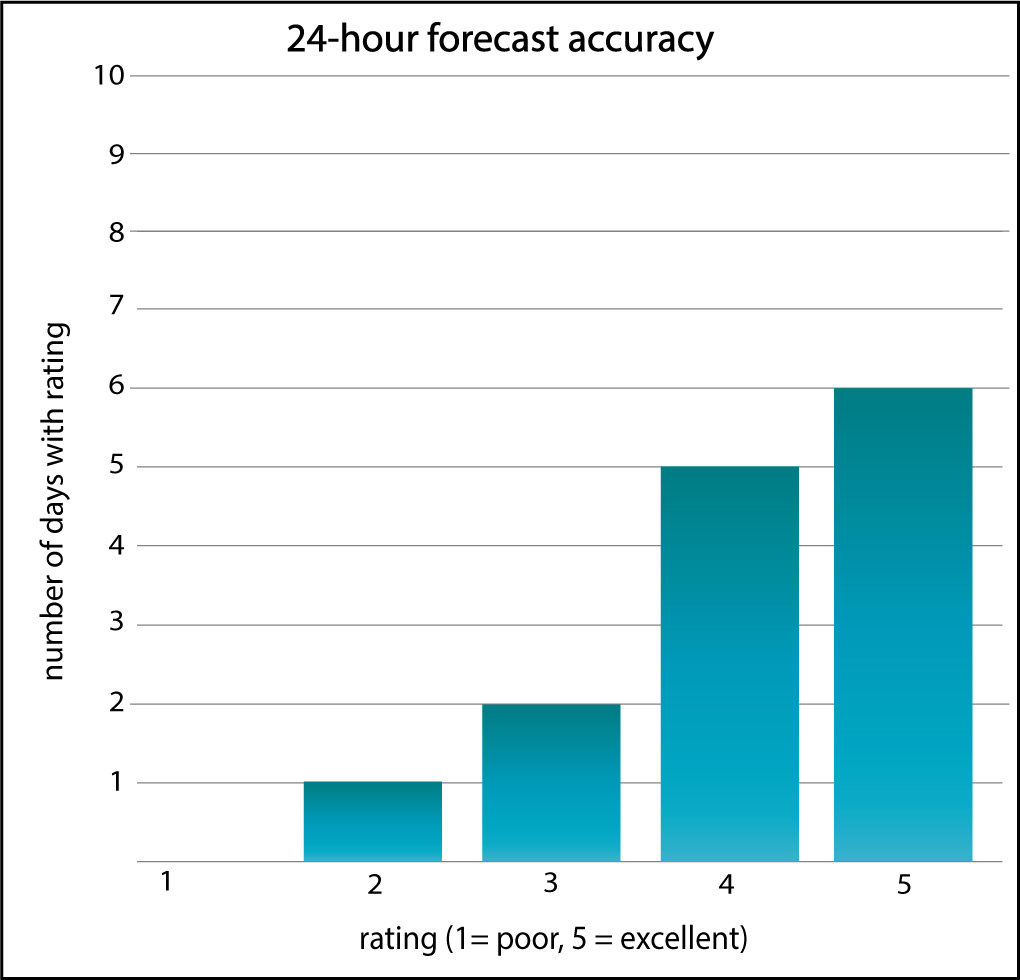
- Start with the 24-hour forecasts. You should have a 1 to 5 rating of the accuracy of each day’s 24-hour forecast, based on how it compared to the actual weather the following day. Make a bar chart in which you show how many of the 24-hour forecasts got each rating. That is, it should look something like this bar chart below, but with the data that your class collected:
- Now make similar bar charts for each of the other forecasts (3-day, 5-day, 7-day, and 10-day).
- Discuss how the reliability of the different forecasts compare. For example, how does the reliability of the 24-hour forecasts compare to that of the 3-day forecasts, how do the 3-day forecasts compare to the 5-day forecasts, and so on?
- Based on what you’ve learned, discuss the general value of weather forecasts made different numbers of days ahead of time.
This activity returns to the “Part 1” activity on the chapter opening page, in which students started collecting data. Hopefully, by now they have plenty of data with which to address the questions asked here.
- (1 and 2) We suggest bar charts because they are easy to make. Students simply need to make a frequency table of for the data and then turn the data into bar charts, either by hand or using a spreadsheet program (such as Excel or Google Sheets).
- (3) The key is that students should find that the longer-out forecasts are less reliable.
- (4) This discussion can be fairly short, focusing on the general value of the forecasts. For example, it’s usually safe to make plans based on a 24-hour forecast. The longer-term forecasts are less useful for making specific plans, but still very useful for warning of possible severe weather that may be coming your way.
We’ll close this chapter by returning to one important idea that we briefly introduced earlier (in the Discussion “Weather and Climate Predictability”): Climate is much more predictable than weather. The reason goes back to the fact that climate is a long-term average of weather, and averages are always easier to predict than individual events. As a simple example of why, consider the following:
- If you choose a single 6-year-old child and a single 7-year old child at random, there’s no way to know in advance which one will be taller.
- However, there’s no doubt that the average height of 7-year-old children is taller than that of 6-year-old children.
This example illustrates the general principle that it is always easier to predict averages than individual events. (You can explore further examples in this Chapter 7 activity.) It is therefore easier to predict local climate than local weather. It is also easier to predict future changes in global climate than in individual local climates, an idea that will be very important as we discuss climate change in Chapter 7.
Key Concepts:Climate is more predictable than weather
Many people wonder how it is possible for scientists to predict how the climate will change in future decades when we can’t predict the weather more than a couple weeks ahead of time. The answer is simple: Climate is the long-term average of weather, and averages are always easier to predict than individual events. That is why it is much easier to predict climate than weather, and easier to predict changes in global climate than changes in local climates.
Activity
Family Weather Presentation
We hear or see weather forecasts all the time, but many people don’t actually know how to interpret them. Prepare a 5-minute presentation for your own family members in which you will explain to them how they can make sense of weather forecasts. You may use a format of your choice (such as a slide show or video). You may wish to look back at the videos included throughout this section for inspiration.
This activity gives students a chance to put together all that they’ve learned in a presentation that they can actually give to their families. This should help both students and their family members, who may not themselves know how to think about weather forecasts.
Journal Entry
Atmosphere, Hydrosphere, and Me (Revisited)
Look back at the journal entry you wrote at the beginning of Section 6.1, in which you listed as many ways you could think of at the time in which the atmosphere and hydrosphere are important to your life. (You may also have added to the list as you worked through this chapter.) Revisit your list, adding to it based on what you have learned. Then, at the end, write a short summary of the roles of air and water in your life. Feel free to be creative. For example, your summary could be a short essay, or a poem, or a story, or even an annotated drawing.
This journal entry asks students to revisit the one they made at the beginning of Section 6.1, in order to consider what they have learned. Encourage creativity in the summary that they write.
Optional Video/Journal Entry/Class Discussion
Astronauts’ View of Earth
Have you ever wondered what it would be like to be an astronaut, looking down on Earth from above? Watch the following NASA video that discusses the way astronauts view the Earth from the International Space Station, and which shows many of the phenomena we’ve discussed throughout this book from the vantage point of space. As you watch, make notes about aspects of the astronaut perspective you find most interesting or surprising. Then, do either or both of the following:
- Class discussion: Discuss your general reactions to the video. How do you think the astronaut perspective can be used by all of us to improve our world?
- Journal entry: Make a journal entry of any length in which you describe your reactions to the video, including whether you would like to be able to go into space one day
If you can spare the 29 minutes needed to show this NASA video (https://youtu.be/DIkqs9_FK28) in class, we highly recommend it. It should lead to some very interesting class discussions and/or journal entries. It is also a great way to close out this chapter, and prepare for the next chapter in which we deal with the important topic of global warming.