“Triangulation”: Using Parallax to Measure Distance
Parallax has another important role in our lives: The fact that the amount of parallax we observe for an object gets smaller with increasing distance means that careful measurements of parallax allow us to calculate distances. This is very important in everyday life, because this technique — usually called “triangulation” — is used to measure distances for engineering and construction. And in astronomy, stellar parallax provides us with our only direct method for measuring distances to stars. Use this activity to help you understand how the method works.
Materials
- Protractor
- Graph paper
- Ruler, meter stick or tape measure
- Wire or twist tie
- Tape
- Pencil
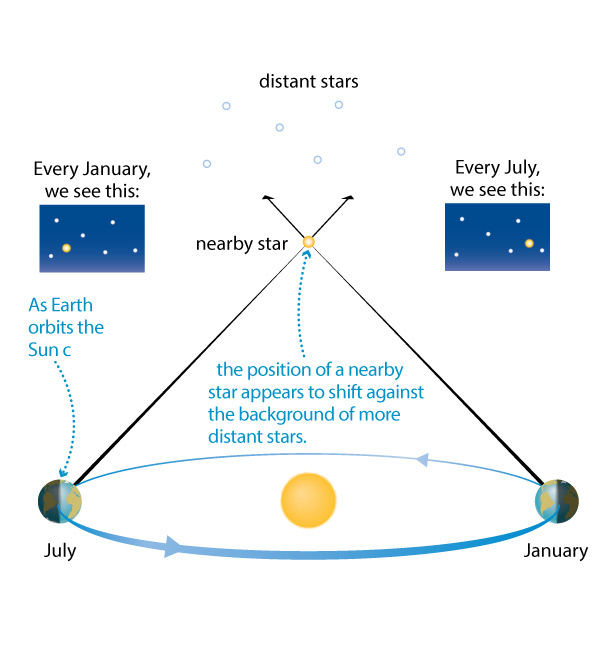
Before starting, consider again Figure 3.3. In this activity, you will reproduce this type of observation at a much smaller scale, to measure distances within your classroom.
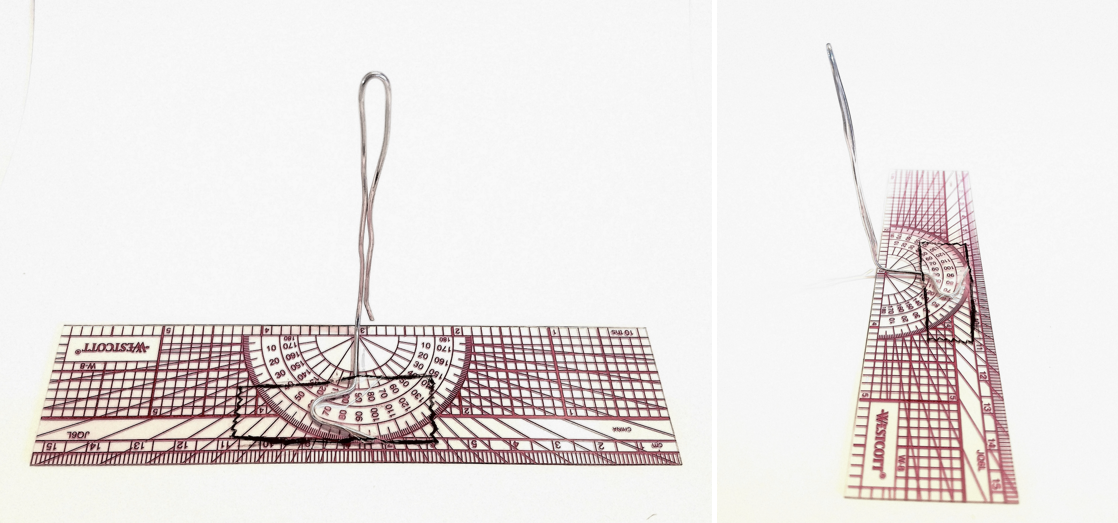
Step 1: Modify your protractor so that you can use it to measure angular position. Take your twist tie and bend one end into a slight ‘?’ shape, then use tape to attach the twist tie to the center of your protractor at a right angle, like so:
Step 2: Choose an object to which you will find the distance. Have you or your partner take a position as close to the object as possible and then pace out at least 10 steps straight away from it. You can take more than 10 steps, but you want to take at least 10 steps in order to be able to complete the experiment.
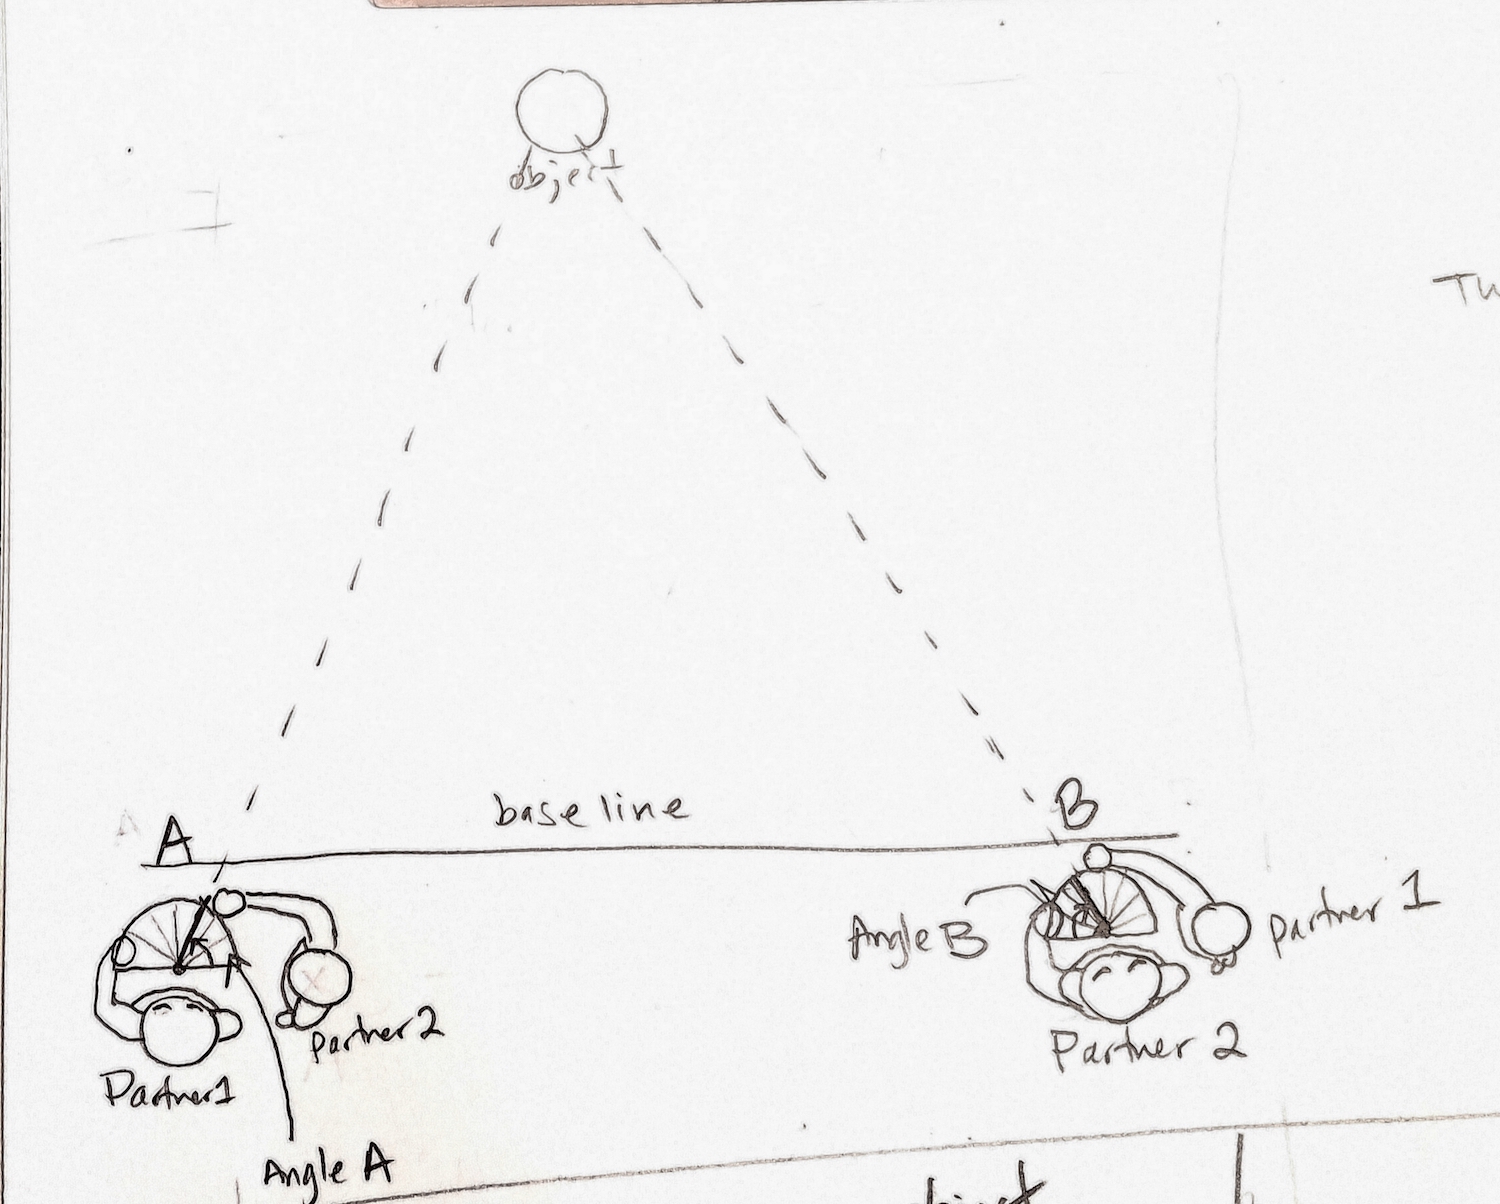
Step 3: Establish a baseline for observation. Looking back at Figure 1, notice how the two positions of the Earth in July and January represent points that are exactly opposite each other in the ‘circle’ of the Earth’s orbit. The distance between these two points is called the baseline, and it is from these two opposite positions that astronomers make their observations to measure the parallax of distant stars. You will need to set up a baseline from which to make your observations. Using a ruler or meter stick, measure out a 12-foot baseline, and mark the end positions A and B like the example shown here:
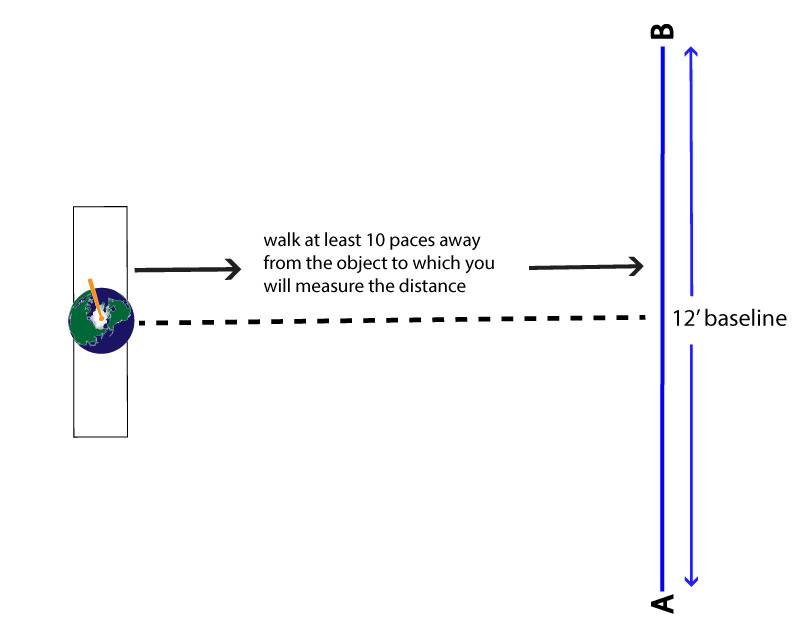
Orient your baseline so that it is perpendicular to the path that leads back to your object.
Step 4: Observe the position of the object and measure the angle from position A. Have partner 1 stand at point A of your baseline and hold the protractor at eye level. Keeping the edge of the protractor parallel to the baseline, have partner 1 move the protractor until the object appears aligned behind the twist tie, from the point of view of partner 1. Now have partner 2 move a pencil around the edge of the protractor until it aligns directly between the twist tie and the object, from the point of view of partner 1:
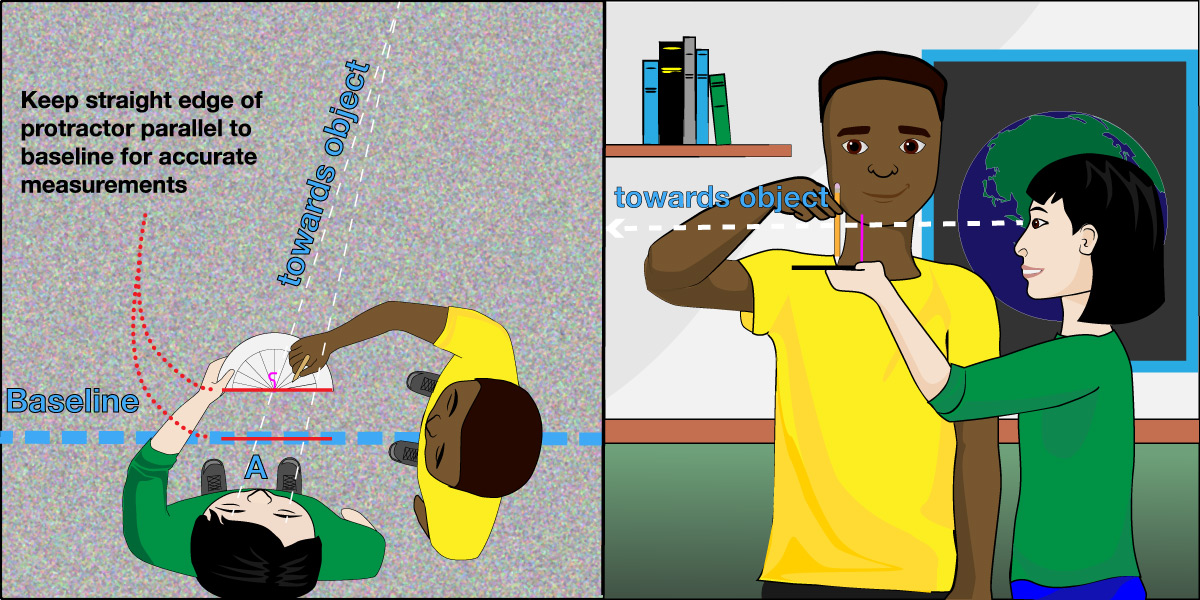
Partner 2 should note the angle on the protractor where the pencil aligns. Record this value as “angle A”.
Step 5: Observe the object and measure the angle from position B. Repeat step 4 from position B on the other end of the baseline. This time have partner 2 hold up the protractor and align the twist tie in front of the object. Have partner 1 move the pencil around the protractor as before, stopping when the twist tie, pencil and object are all aligned from the point of view of Partner 2. Record this value as angle B.
Step 6: Graph your data. On graph paper, draw a line to represent your baseline. Choose a scale where one square of graph paper equals one foot of real distance, so that the baseline you draw on your paper should be 12 squares long.
Place the protractor so that the flat edge is parallel to the baseline, with the center on point A. Make a mark for angle A that you measured at this position. Use a ruler to draw a straight line connecting point A on your baseline to the mark for angle A, and continue this straight line all the way to the top of the page.
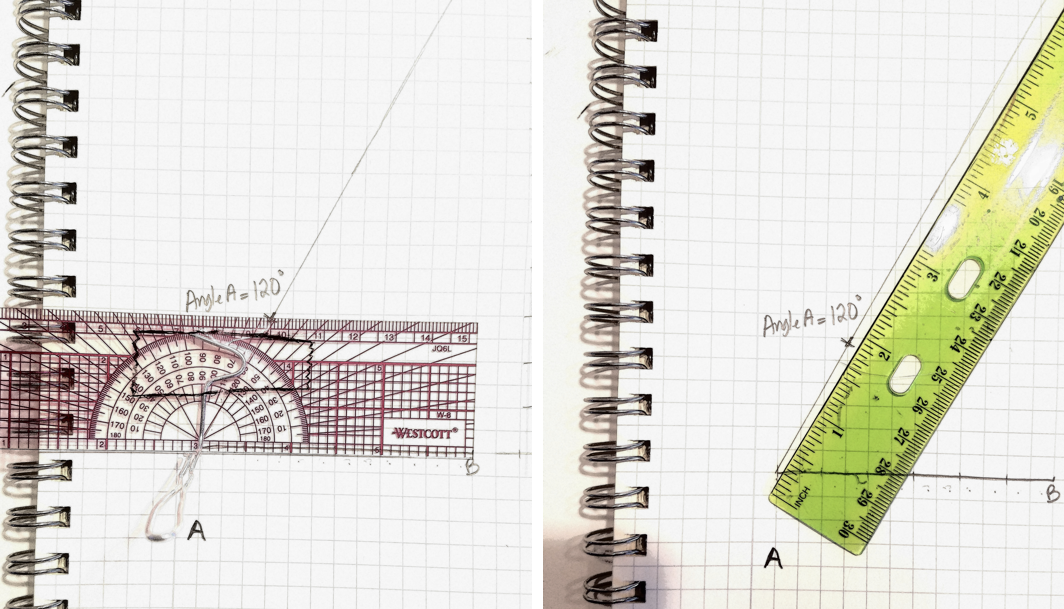
Now place the protractor with the center on point B and mark angle B that you measured during the experiment. Use the ruler to draw a line connecting point B to the mark for angle B and continue this straight line all the way to the top of the page as well.
Step 7: Measure the distance. The point where the lines through angles A & B intersect represents the location of the object to which you were measuring the distance. Using your ruler, make a straight line connecting the point of intersection to the baseline. Count how many squares separate the point of intersection from the baseline and record this number as the distance. Since we chose a scale where one square of graph paper represents 1 foot of actual distance, the distance you measured on the graph paper equals the distance to your object in feet.
Now check your answer by using the measuring stick to measure the real distance – it should be very close to the distance you measured on the graph paper. Notice that you did not have to extend any sort of measuring device to the object to learn its distance – how cool that this is how astronomers can measure the distances to stars without having to actually travel to them!
The topic of parallax and distance goes beyond the NGSS for middle school, but it offers an excellent opportunity to connect with the mathematics and many applications of the distance measurement method more commonly called “triangulation.” In essence, this process simply requires measuring the apparent shift in angular position of an object due to parallax. This is how astronomers measure the distances to distant stars using parallax, and how surveyors measure distances to objects here on Earth. This activity helps students understand this method, formally called trigonometric parallax. Students will choose an object in the classroom and measure the distance to it by observing the position of an object and recording their viewing (or, parallax) angle as they observe the object from two different view points.
- Note: Steps 6 and 7 of the activity use graph paper; while any graph paper can work, you may wish to print and use the graph sheet that we have posted here.
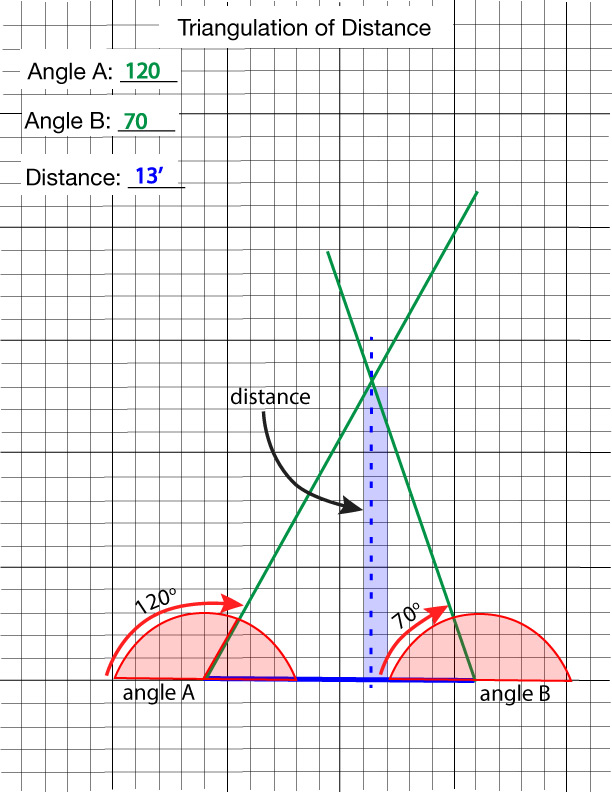
Student’s final distance sketches should look like the sketch to the right. Individual sketches and distances will vary based on the objects the students choose to observe and what angles they measure. However, the overall result should look similar to this.
Students mark the angles measured for A and B by centering the protractor on the ends of the baseline (blue line) as shown. They should then use a ruler to draw a line that connects the ‘A’ end of the baseline, through the mark for angle A, that continues up a good portion of the page (green lines). Do the same for angle B on the ‘B’ end of the baseline.
The dashed blue line represents the distance to the object that the students were observing. In this example, the distance is 13 feet.
Your students are free to establish a longer baseline (more than 12 feet) as the method will work the same, so long as they also make sure to mark their baseline distance accurately on the graph paper. If they choose a 14 foot baseline, they should mark a 14 square baseline on the graph paper. Likewise, if you should choose to do this experiment outside, you can have, for example, a 40 foot baseline. By choosing the correct scale of (for example) 2 feet per square of graph paper, you can use this method to measure farther distances.
Unless they are all observing the same object from the same baseline, student’s answers will vary quite a bit. It may be interesting to compare results between students to see how this method works accurately for different distances and angle measurements.